Exam 5: Predictive Analytics I: Trees, K-Nearest Neighbors, Naive Bayes,
Exam 1: An Introduction to Business Statistics and Analytics98 Questions
Exam 2: Descriptive Statistics and Analytics: Tabular and Graphical Methods120 Questions
Exam 3: Descriptive Statistics and Analytics: Numerical Methods145 Questions
Exam 4: Probability and Probability Models150 Questions
Exam 5: Predictive Analytics I: Trees, K-Nearest Neighbors, Naive Bayes,101 Questions
Exam 6: Discrete Random Variables150 Questions
Exam 7: Continuous Random Variables150 Questions
Exam 8: Sampling Distributions111 Questions
Exam 9: Confidence Intervals149 Questions
Exam 10: Hypothesis Testing150 Questions
Exam 11: Statistical Inferences Based on Two Samples140 Questions
Exam 12: Experimental Design and Analysis of Variance132 Questions
Exam 13: Chi-Square Tests120 Questions
Exam 14: Simple Linear Regression Analysis147 Questions
Exam 15: Multiple Regression and Model Building85 Questions
Exam 16: Predictive Analytics Ii: Logistic Regression, Discriminate Analysis,101 Questions
Exam 17: Time Series Forecasting and Index Numbers161 Questions
Exam 18: Nonparametric Methods103 Questions
Exam 19: Decision Theory90 Questions
Select questions type
A cable television company has randomly selected a sample of 637 Basic package customers for a marketing test to see which customers are more likely to upgrade to the Premium package. They monitored several predictor variables based on customer activity during the most recently billed month. Then they included a special upgrade offer for the Premium package along with their bill. The response variable Upgrade equals Yes if a customer accepted the offer to upgrade to the Premium package and equals No otherwise. Below is the confusion matrix from the k-nearest neighbors classification analysis.  What is the non-upgrader misclassification rate for the k-nearest neighbors classification?
Free
(Multiple Choice)
4.9/5  (39)
(39)
Correct Answer: Verified
B
An internet service provider (ISP) has randomly selected a sample of 223 observations concerning values of the response variable Churn and several predictor variables based on customer activity during the most recently billed month. Here Churn equals Yes if a customer churned-left the internet service provider for another ISP-and equals No otherwise. The predictor variable MinutesOn is the average daily minutes the customer spent online. EmailSent is the average daily number of emails the customer sent from the email address provided by the ISP. ServCalls is the number of times the customer called for service. Below is part of the classification tree they derived from the data collected in the study. 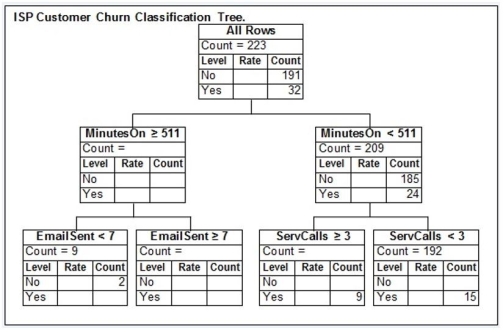 Of the sampled customers who spent an average of at least 511 minutes online per day and sent an average of at least 7 emails per day from their ISP-provided email address, how many did not churn?
Free
(Multiple Choice)
4.8/5 (47)
Correct Answer:Verified
A
An MBA admissions officer wishes to predict an MBA applicant's grade point average (GPA) for the MBA program on the basis of the applicant's score on the Graduate Management Admission Test (GMAT) and their undergraduate GPA (UGPA). The admissions officer used a random sample of previously admitted applicants to build a regression tree that can be used to predict the MBA GPAs of future MBA students. Below is the final regression tree.  Based on this regression tree, how many of the admitted applicants in the sample had a GMAT score of less than 650?
Free
(Multiple Choice)
4.8/5 (35)
Correct Answer:Verified
D
An internet service provider (ISP) has randomly selected a sample of 223 observations concerning values of the response variable Churn and several predictor variables based on customer activity during the most recently billed month. Here Churn equals Yes if a customer churned-left the internet service provider for another ISP-and equals No otherwise. The predictor variable MinutesOn is the average daily minutes the customer spent online. EmailSent is the average daily number of emails the customer sent from the email address provided by the ISP. ServCalls is the number of times the customer called for service. Below is part of the classification tree they derived from the data collected in the study.  Of the sampled customers who spent an average of at least 511 minutes online per day and sent an average of at least 7 emails per day from their ISP-provided email address, what is the sample proportion of those who did not churn?
(Multiple Choice)
4.7/5 (42)
A cable television company has randomly selected a sample of 222 Basic package customers for a marketing test to see which customers are more likely to upgrade to the Premium package. They monitored two predictor variables based on customer activity during the most recently billed month. Then they included a special upgrade offer for the Premium package along with their bill. The response variable Upgrade equals True if a customer accepted the offer to upgrade to the Premium package and equals False otherwise. The predictor variable ViewTime is the average daily minutes the customer had at least one TV on in their house. Network is 1 if the TV is tuned to a traditional ("over the public airwaves") broadcast network at least 50 percent of the time that it is turned on and 0 otherwise. Let the events U, Uc, HV, and NV denote the events that the randomly selected Basic customer, respectively, upgraded, did not upgrade, had a high ViewTime [a view time greater than the median amount of 507 minutes], and was primarily a traditional broadcast network viewer [i.e., spent at least 50% of time tuned to a traditional network]. The data they collected show: 1) 43 out of 222 Basic customers upgraded, or P(U) = 43/222.
2) 179 out of 222 Basic customers did not upgrade, or P(Uc) = 179/222.
3) 37 out of 43 upgraders had a high ViewTime, or P(HV|U) = 37/43.
4) 63 out of 179 non-upgraders had a high ViewTime, or P(HV|Uc) = 63/179.
"5) 7 out of 43 upgraders was primarily a traditional broadcast network viewer,
Or P(NV|U) = 7/43."
"6) 52 out of 179 non-upgraders was primarily a traditional broadcast network viewer,
Or P(NV|Uc) = 52/179.
Using naive Bayes' Theorem, what is the approximate probability that a Basic customer will upgrade if they have a high ViewTime and primarily view traditional broadcast networks?"
(Multiple Choice)
4.8/5 (38)
Which of the following possible response variables is most appropriate to predict using a regression tree?
(Multiple Choice)
4.8/5 (30)
To "overfit" the data is to adjust the data until it matches our desired classification tree.
(True/False)
4.8/5 (37)
An automobile finance company analyzed a sample of recent automobile loans to try to determine key factors in identifying borrowers who would be likely to default on their auto loan. The response variable Default equals 1 if the borrower defaulted during the term of the loan and 0 otherwise. The predictor variable AutoDebt% was the ratio (expressed as a percent) of the required loan payments to the borrower's take-home income at the time of purchase. JobTime was the number of years the borrower had worked at their current job at the time of purchase. CredScore was the borrower's credit score at the time of purchase. Below is part of the classification tree the finance company derived from the data collected in the study. Assume they classify those with a default probability estimate of at least .5 as Defaulters. 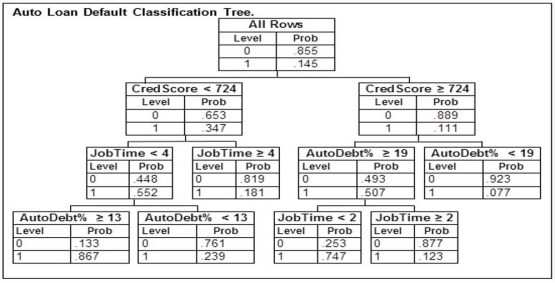 A potential borrower with a credit score of 743 who has been at their current job for 3 years is applying for a loan with payments equaling 12% of their income. Based on this classification tree, the best estimate of the probability that this loan applicant would default would be
(Multiple Choice)
4.8/5 (38)
An MBA admissions officer wishes to predict an MBA applicant's grade point average (GPA) for the MBA program on the basis of the applicant's score on the Graduate Management Admission Test (GMAT) and their undergraduate GPA (UGPA). The admissions officer used a random sample of previously admitted applicants to build a regression tree that can be used to predict the MBA GPAs of future MBA students. Below is the final regression tree. 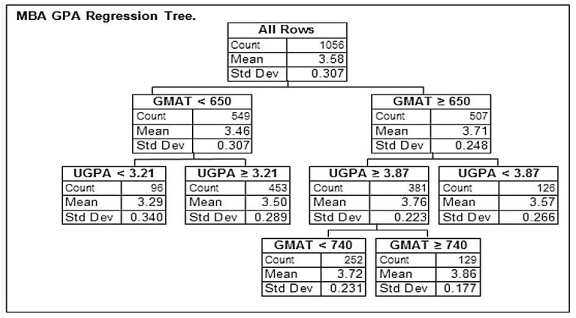 Based on this regression tree, how many of the admitted applicants in the sample had a GMAT score of at least 650?
(Multiple Choice)
4.8/5 (34)
An MBA admissions officer wishes to predict an MBA applicant's grade point average (GPA) for the MBA program on the basis of the applicant's score on the Graduate Management Admission Test (GMAT) and their undergraduate GPA (UGPA). The admissions officer used a random sample of previously admitted applicants to build a regression tree that can be used to predict the MBA GPAs of future MBA students. Below is the final regression tree.  An MBA applicant has a GMAT score of 650 and an undergraduate GPA of 3.87. Based on this regression tree, which of the following is the best estimate of this applicant's MBA GPA if they are admitted into the program?
(Multiple Choice)
4.8/5 (26)
An internet service provider (ISP) has randomly selected a sample of 223 observations concerning values of the response variable Churn and several predictor variables based on customer activity during the most recently billed month. Here Churn equals Yes if a customer churned-left the internet service provider for another ISP-and equals No otherwise. The predictor variable MinutesOn is the average daily minutes the customer spent online. EmailSent is the average daily number of emails the customer sent from the email address provided by the ISP. ServCalls is the number of times the customer called for service. Below is part of the classification tree they derived from the data collected in the study.  Of the sampled customers who spent an average of less than 511 minutes online per day and placed at least 3 service calls, how many did not churn?
(Multiple Choice)
4.9/5 (34)
A cable television company has randomly selected a sample of 637 Basic package customers for a marketing test to see which customers are more likely to upgrade to the Premium package. They monitored several predictor variables based on customer activity during the most recently billed month. Then they included a special upgrade offer for the Premium package along with their bill. The response variable Upgrade equals Yes if a customer accepted the offer to upgrade to the Premium package and equals No otherwise. Below is the confusion matrix from the k-nearest neighbors classification analysis.  How many customers in the sample were correctly classified as non-upgraders by the k-nearest neighbors approach?
(Multiple Choice)
4.7/5 (36)
An automobile finance company analyzed a sample of recent automobile loans to try to determine key factors in identifying borrowers who would be likely to default on their auto loan. The response variable Default equals 1 if the borrower defaulted during the term of the loan and 0 otherwise. The predictor variable AutoDebt% was the ratio (expressed as a percent) of the required loan payments to the borrower's take-home income at the time of purchase. JobTime was the number of years the borrower had worked at their current job at the time of purchase. CredScore was the borrower's credit score at the time of purchase. Below is part of the classification tree the finance company derived from the data collected in the study. Assume they classify those with a default probability estimate of at least .5 as Defaulters.  A potential borrower with a credit score of 523 who has been at their current job for 1 year is applying for a loan with payments equaling 17% of their income. Based on this classification tree, the best estimate of the probability that this loan applicant would default would be
(Multiple Choice)
4.8/5 (30)
An MBA admissions officer wishes to predict an MBA applicant's grade point average (GPA) for the MBA program on the basis of the applicant's score on the Graduate Management Admission Test (GMAT) and their undergraduate GPA (UGPA). The admissions officer used a random sample of previously admitted applicants to build a regression tree that can be used to predict the MBA GPAs of future MBA students. Below is the final regression tree.  Based on this regression tree, what proportion of the admitted applicants in the sample had both a GMAT score of at least 740 and an undergraduate GPA of at least 3.87?
(Multiple Choice)
4.8/5 (40)
An MBA admissions officer wishes to predict an MBA applicant's grade point average (GPA) for the MBA program on the basis of the applicant's score on the Graduate Management Admission Test (GMAT) and their undergraduate GPA (UGPA). The admissions officer used a random sample of previously admitted applicants to build a regression tree that can be used to predict the MBA GPAs of future MBA students. Below is the final regression tree.  The school awards an MBA Scholarship to admitted applicants who it predicts will earn a GPA of 3.7 or higher in the MBA program. An MBA applicant has an undergraduate GPA of 3.87. Based on this regression tree, which of the following GMAT scores is the lowest this applicant can earn to qualify for the Dean's Scholarship?
(Multiple Choice)
4.8/5 (37)
Unlike a classification tree, a regression tree enables us to predict the value of a ________ response variable.
(Multiple Choice)
4.8/5 (30)
Naive Bayes' Theorem assumes that the events that the predictor variables take on the values x1, x2, …, xk are highly correlated for observations that fall into the particular category and statistically independent for observations that do not fall into the particular category.
(True/False)
4.9/5 (34)
An MBA admissions officer wishes to predict an MBA applicant's grade point average (GPA) for the MBA program on the basis of the applicant's score on the Graduate Management Admission Test (GMAT) and their undergraduate GPA (UGPA). The admissions officer used a random sample of previously admitted applicants to build a regression tree that can be used to predict the MBA GPAs of future MBA students. Below is the final regression tree.  An MBA applicant has a GMAT score of 630 and an undergraduate GPA of 3.51. Based on this regression tree, which of the following is the best estimate of this applicant's MBA GPA if they are admitted into the program?
(Multiple Choice)
4.8/5 (36)
An MBA admissions officer wishes to predict an MBA applicant's grade point average (GPA) for the MBA program on the basis of the applicant's score on the Graduate Management Admission Test (GMAT) and their undergraduate GPA (UGPA). The admissions officer used a random sample of previously admitted applicants to build a regression tree that can be used to predict the MBA GPAs of future MBA students. Below is the final regression tree.  An MBA applicant has a GMAT score of 800 and an undergraduate GPA of 4.00. Based on this regression tree, which of the following is the best estimate of this applicant's MBA GPA if they are admitted into the program?
(Multiple Choice)
4.8/5 (24)
Classification involves identifying common traits in items in order to develop broad classes into which the items may be grouped based on those traits.
(True/False)
4.9/5 (32)
Filters
- Essay(0)
- Multiple Choice(0)
- Short Answer(0)
- True False(0)
- Matching(0)