Deck 5: Using Supply and Demand
Full screen (f)
Question
Question
Question
Question
Question
Question
Question
Question
Question
Question
Question
Question
Question
Question
Question
Question
Question
Question
Question
Question
Question
Question
Question
Question
Question
Question
Many state governments support higher education through subsidies. (A subsidy is like a negative excise tax). Consider the following supply and demand for college education at State U, which shows the equilibrium that would prevail without subsidies: annual tuition is $20,000 with Q0 enrolled students. Suppose the state provides a $10,000 per year subsidy paid to State U for each student enrolled. What impact will this subsidy have on the equilibrium tuition level and number of enrolled students? Explain. 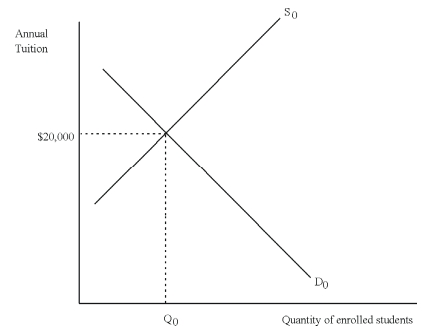
Question

Unlock Deck
Sign up to unlock the cards in this deck!
Unlock Deck
Unlock Deck
1/27
Play
Full screen (f)
Deck 5: Using Supply and Demand
1
Define an excise tax and give three examples. Explain the relationship between a tariff and an excise tax. Use supply and demand analysis to explain why the equilibrium price of apples will rise and the equilibrium quantity will fall if an excise tax is levied on apples. Explain why the price of apples will not rise by the full amount of the tax.
Excise taxes are taxes levied on a specific good. Examples include the tax on cigarettes, the tax on alcohol, and the tax on gasoline. A tariff is an excise tax on an imported good.
If an excise tax were levied on apples, the supply curve of apples would shift upward by the amount of the excise tax. The new supply curve of apples would lie parallel to the old one and would lie above it by an amount equal to the excise tax. The new supply curve would intersect the demand curve at a higher price and at a lower quantity. (Apples would cost more, but fewer apples would be sold.) The equilibrium price would rise by less than the full amount of the tax because, at a lower quantity, the cost of production per additional apple would be lower. We would move down along the supply curve thus partially offsetting the effect of the upward shift in the supply curve that was caused by the newly imposed excise tax.
If an excise tax were levied on apples, the supply curve of apples would shift upward by the amount of the excise tax. The new supply curve of apples would lie parallel to the old one and would lie above it by an amount equal to the excise tax. The new supply curve would intersect the demand curve at a higher price and at a lower quantity. (Apples would cost more, but fewer apples would be sold.) The equilibrium price would rise by less than the full amount of the tax because, at a lower quantity, the cost of production per additional apple would be lower. We would move down along the supply curve thus partially offsetting the effect of the upward shift in the supply curve that was caused by the newly imposed excise tax.
2
What is a price ceiling? What happens to the relationship between quantity demanded and supplied with an effective price ceiling?
A price ceiling is a government-imposed limit on how high a price can be charged. With an effective price ceiling, quantity demanded exceeds quantity supplied.
3
Demonstrate graphically and explain verbally the impact on supply and demand equilibrium of an effective price ceiling.
The imposition of an effective price ceiling (PC) will result in a price that is lower than the market equilibrium price (PC < PE) and will also cause a shortage (QD > QS).
The diagram: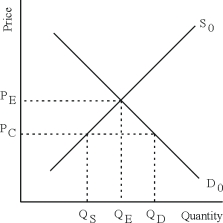
The diagram:
4
Demonstrate graphically and explain verbally the impact on supply and demand equilibrium of an effective price floor.
Unlock Deck
Unlock for access to all 27 flashcards in this deck.
Unlock Deck
k this deck
5
What is a third-party payer market? Give an example.
Unlock Deck
Unlock for access to all 27 flashcards in this deck.
Unlock Deck
k this deck
6
What is a living wage? Why did many states find it necessary to establish a living wage?
Unlock Deck
Unlock for access to all 27 flashcards in this deck.
Unlock Deck
k this deck
7
Use a supply/demand diagram to explain the effects of a government-imposed price ceiling that is above the equilibrium price. What will be the effective quantity and price in this situation?
Unlock Deck
Unlock for access to all 27 flashcards in this deck.
Unlock Deck
k this deck
8
Explain the shifts in demand and/or supply that can result in the following observations: (Assume the demand curve is downward sloping and the supply curve is upward sloping.)
(a) Both price and quantity rise.
(b) Price rises, quantity falls.
(c) Price rises, quantity doesn't change.
(d) Quantity rises, price doesn't change.
(a) Both price and quantity rise.
(b) Price rises, quantity falls.
(c) Price rises, quantity doesn't change.
(d) Quantity rises, price doesn't change.
Unlock Deck
Unlock for access to all 27 flashcards in this deck.
Unlock Deck
k this deck
9
Americans over the age of 65 are covered by Medicare. For them, the medical market is a third-payer market. What is a third-party payer market? How does total quantity of medical services provided in a third-payer market, such as Medicare, compare to a market in which the purchaser of medical services pays the full cost? How does price of medical services provided in a third-part payer market, such as Medicare, compare to the price in a market in which the purchaser of medical services pays the full cost? If third-payer markets, such as Medicare, benefit buyers by providing a greater quantity of services and sellers by yielding a higher price, who is hurt by such a payments system?
Unlock Deck
Unlock for access to all 27 flashcards in this deck.
Unlock Deck
k this deck
10
How does total size of expenditures in a third-part payer market compare to the total size of expenditures in a market with no third-party payer?
Unlock Deck
Unlock for access to all 27 flashcards in this deck.
Unlock Deck
k this deck
11
A musical group called "The Grateful Dead" sold out concert after concert and typically provided a good living for scalpers (who buy tickets and resell them). Explain (using a supply and demand diagram) how The Grateful Dead's ticket pricing policy set an effective ceiling on the price of concert tickets. If there were a fixed number of seats at their concerts, what was the shape of the supply curve for these seats?
Unlock Deck
Unlock for access to all 27 flashcards in this deck.
Unlock Deck
k this deck
12
Start by drawing a supply and demand equilibrium situation. Using your diagram, demonstrate graphically and explain verbally the impact of a decrease in demand and an increase in supply on equilibrium price and quantity.
Unlock Deck
Unlock for access to all 27 flashcards in this deck.
Unlock Deck
k this deck
13
What is a price floor? What happens to the relationship between quantity demanded and supplied with an effective price floor?
Unlock Deck
Unlock for access to all 27 flashcards in this deck.
Unlock Deck
k this deck
14
In the 1990s and into the fist decade of the 2000s, the war in Iraq reduced that nation's petroleum production and exports to levels that are well below pre-war levels. At the same time as a result of the rapid growth of the Chinese economy, world demand for petroleum products increased significantly. Both events had significant impacts on world oil prices. How would the simple supply and demand model apply to this case?
Unlock Deck
Unlock for access to all 27 flashcards in this deck.
Unlock Deck
k this deck
15
Start by drawing a supply and demand equilibrium situation. Using your diagram, demonstrate graphically and explain verbally the impact of an increase in demand and an increase in supply on equilibrium price and quantity.
Unlock Deck
Unlock for access to all 27 flashcards in this deck.
Unlock Deck
k this deck
16
Consider the following scenario: Average household incomes have grown leading to an increase in electrical appliance use, boosting demand for electricity faster than capacity is being added. Analyze the impact on quantity demanded and price of electricity using a supply and demand diagram.
Unlock Deck
Unlock for access to all 27 flashcards in this deck.
Unlock Deck
k this deck
17
Analyze the impact of a firm entering an existing market on the equilibrium quantity and price in that market using a supply and demand diagram.
Unlock Deck
Unlock for access to all 27 flashcards in this deck.
Unlock Deck
k this deck
18
Start by drawing a supply and demand equilibrium situation. Using your diagram, demonstrate graphically and explain verbally the impact of a decrease in supply on equilibrium price and quantity. What could cause this shift?
Unlock Deck
Unlock for access to all 27 flashcards in this deck.
Unlock Deck
k this deck
19
What is a price ceiling? What is a price floor? Give a real world example of each. What happens to the relationship between quantity demanded and the quantity supplied with an effective price ceiling? What happens to the relationship between quantity demanded and the quantity supplied with an effective price floor? What is likely to happen if there is a shortage of rent controlled apartments? What is likely to happen if there is a surplus of price supported grain?
Unlock Deck
Unlock for access to all 27 flashcards in this deck.
Unlock Deck
k this deck
20
Start by drawing a supply and demand equilibrium situation. Using your diagram, demonstrate graphically and explain verbally the impact of an increase in demand on equilibrium price and quantity. What could cause this shift?
Unlock Deck
Unlock for access to all 27 flashcards in this deck.
Unlock Deck
k this deck
21
What is an excise tax? Demonstrate the effect of an excise tax paid by suppliers on equilibrium quantity and price.
Unlock Deck
Unlock for access to all 27 flashcards in this deck.
Unlock Deck
k this deck
22
The market for tennis racquets in a small town is represented by the following demand and supply equations:
QD = 200 - P
QS = -50 + P
Calculate the following (treat each point as a separate scenario):
(a) The equilibrium price and quantity.
(b) The equilibrium price and quantity after a $10 tax on the supplier.
(c) The equilibrium price and quantity after a $10 tax on the consumer.
(d) The equilibrium price and quantity after the government sets a price ceiling of $100.
(e) The equilibrium price and quantity after the government sets a price floor of $110.
(f) The equilibrium price and quantity after the government sets a quantity restriction of 75 units and an increase in the demand for racquets by 50.
Unlock Deck
Unlock for access to all 27 flashcards in this deck.
Unlock Deck
k this deck
23
What is a tariff? Demonstrate the effect of a tariff on equilibrium quantity and price. Does the equilibrium price rise by the amount of the tariff? Why or why not?
Unlock Deck
Unlock for access to all 27 flashcards in this deck.
Unlock Deck
k this deck
24
Demonstrate graphically and explain verbally the impact of a third-party payer market on supply and demand equilibrium in this case. Be sure to discuss equilibrium quantity, price received by suppliers, price paid by consumers, and total expenditures.
Unlock Deck
Unlock for access to all 27 flashcards in this deck.
Unlock Deck
k this deck
25
What are quantity restrictions? Use a supply/demand diagram to demonstrate the effect of quantity restrictions on equilibrium price and quantity of a good when there is an increase in demand.
Unlock Deck
Unlock for access to all 27 flashcards in this deck.
Unlock Deck
k this deck
26
Many state governments support higher education through subsidies. (A subsidy is like a negative excise tax). Consider the following supply and demand for college education at State U, which shows the equilibrium that would prevail without subsidies: annual tuition is $20,000 with Q0 enrolled students. Suppose the state provides a $10,000 per year subsidy paid to State U for each student enrolled. What impact will this subsidy have on the equilibrium tuition level and number of enrolled students? Explain.
Unlock Deck
Unlock for access to all 27 flashcards in this deck.
Unlock Deck
k this deck
27
Used newspaper often is recycled into building insulation, packaging materials, and other products. At one time there was a "glut" of used newspaper in the United States. As a result, recycling centers refused to pay for used newspaper anymore, even though the price of used newspaper used to be about $.02 per pound. (Recycling centers continue to take used newspaper, without payment, from environmentally conscious consumers.) The "glut" also caused consumers to throw out large quantities of used newspaper in their trash, where it ended up in landfills. Since these landfills were becoming costly to build and maintain, local governments began seeking ways to encourage recycling and reduce the amount of used newspaper that ended up in landfills. Your task is to analyze this problem in the context of the following numerical example.
Suppose the market for used newspaper can be described by the following equations:
QD = 600 - 10P
QS = 900
Where QD is the quantity of used newspaper demanded by recycling centers. All prices are measured in cents per hundred pounds and all quantities are measured in pounds.
(a) Compute the initial equilibrium price (P1) and quantity (Q1) of used newspaper. Then identify how much used newspaper gets recycled and how much ends up in landfills. Is there a "glut" of used newspaper? Explain your answers briefly.
(b) Suppose the U.S. government required all newspaper publishers to purchase 25 percent of their newsprint from recycled newspaper. Suppose also that this requirement shifted the demand curve for used newspaper to either QD = 400 - 10P or QD = 1200 - 10P. Which demand curve would result from the 25 per cent recycling requirement?
(c) Based on your answer in (b), compute the new equilibrium price (P2) and quantity (Q2) of used newspaper. Now how much used newspaper gets recycled and how much ends up in landfills?
(d) Would the 25 per cent requirement help eliminate the alleged "glut" of used newspaper in the United States? Explain briefly with reference to your answers in (c).
(e) Draw an appropriate graph of your solutions in (a) and (c).
Unlock Deck
Unlock for access to all 27 flashcards in this deck.
Unlock Deck
k this deck
Unlock Deck
Unlock for access to all 27 flashcards in this deck.


