Deck 2: Creating and Using Frequency Distributions
Full screen (f)
Question
Question
Question
What is the most frequently occurring score in the following frequency distribution? 
A)1
B)5
C)11
D)15
A)1
B)5
C)11
D)15
Question
Question
Question
Question
Question
Question
Question
What is wrong in the following table? Score f 
A)The scores and the frequencies must be reversed.
B)The relative frequencies are reported in the f column.
C)Not all possible scores between the highest and lowest observed scores are reported.
D)Nothing is wrong.
A)The scores and the frequencies must be reversed.
B)The relative frequencies are reported in the f column.
C)Not all possible scores between the highest and lowest observed scores are reported.
D)Nothing is wrong.
Question
Question
Question
Question
Question
What are the shaded areas in the following distribution called? 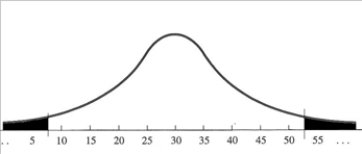
A)Ends
B)Tails
C)Legs
D)Edges
A)Ends
B)Tails
C)Legs
D)Edges
Question
Question
Question
Question
Question
Using the frequency distribution below, what is the total frequency of the scores 6 and 7? 
A)0.33
B)13
C)15
D)17
A)0.33
B)13
C)15
D)17
Question
Question
Question
Question
Question
What is the shape of the following distribution? 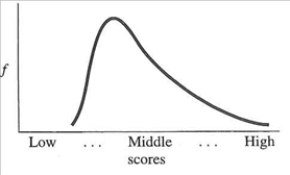
Question
Question
What is the percent for the score "7" in the following distribution? 
A).22
B)5
C)22
D)30
A).22
B)5
C)22
D)30
Question
What is the shape of the following distribution? 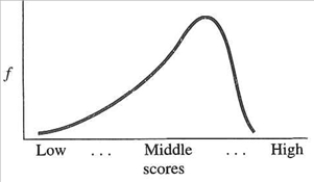
Question
Question
Question
Question
Question
Question
Question
Question
Question
Question
What is the shape of the following distribution? 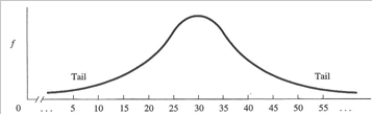
Question
Question
What is the shape of the following distribution? 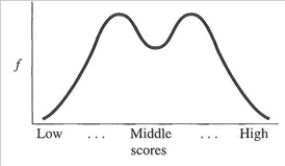
Question
Question
Question
Question
Question
Question
Question
Question
Question
Question
Question
Question
Question
Question
Question

Unlock Deck
Sign up to unlock the cards in this deck!
Unlock Deck
Unlock Deck
1/55
Play
Full screen (f)
Deck 2: Creating and Using Frequency Distributions
1
One benefit to using a frequency distribution table or graph is it makes it easier to
A)see the raw scores.
B)identify the variables.
C)see a relationship hidden in the data.
D)determine the sample size.
A)see the raw scores.
B)identify the variables.
C)see a relationship hidden in the data.
D)determine the sample size.
C
2
The very first step when examining data is to
A)determine if a relationship exists.
B)identify the shape of the distribution.
C)generate a polygon.
D)calculate the relative frequencies.
A)determine if a relationship exists.
B)identify the shape of the distribution.
C)generate a polygon.
D)calculate the relative frequencies.
B
3
What is the most frequently occurring score in the following frequency distribution?
A)1
B)5
C)11
D)15
A)1
B)5
C)11
D)15
C
4
The relative frequency of a score must be
A)a value between 0 and 100.
B)represented using a histogram chart.
C)a value equal to or greater than the score's frequency.
D)a value between 0 and 1.
A)a value between 0 and 100.
B)represented using a histogram chart.
C)a value equal to or greater than the score's frequency.
D)a value between 0 and 1.
Unlock Deck
Unlock for access to all 55 flashcards in this deck.
Unlock Deck
k this deck
5
A graph of a frequency distribution shows the frequencies on the
A)X axis.
B)Y axis.
C)top of the graph.
D)bottom of the graph.
A)X axis.
B)Y axis.
C)top of the graph.
D)bottom of the graph.
Unlock Deck
Unlock for access to all 55 flashcards in this deck.
Unlock Deck
k this deck
6
In statistical notation, N stands for the
A)number of times a given score occurs in a sample.
B)total number of scores in a data set.
C)relative frequency of a particular score.
D)cumulative frequency of a particular score.
A)number of times a given score occurs in a sample.
B)total number of scores in a data set.
C)relative frequency of a particular score.
D)cumulative frequency of a particular score.
Unlock Deck
Unlock for access to all 55 flashcards in this deck.
Unlock Deck
k this deck
7
A grouped frequency distribution is used when
A)there are too many different scores to produce an efficient frequency table or graph.
B)there are too many scores to produce an efficient frequency table or graph.
C)one wants more detailed information about frequencies than one can get from a frequency table.
D)there are about 10 rows in a frequency table.
Unlock Deck
Unlock for access to all 55 flashcards in this deck.
Unlock Deck
k this deck
8
In a normal distribution with a mean of 30, what percentage of the scores would be above the mean?
A)0%
B)25%
C)50%
D)75%
A)0%
B)25%
C)50%
D)75%
Unlock Deck
Unlock for access to all 55 flashcards in this deck.
Unlock Deck
k this deck
9
What is the relative frequency for the score of 14 in the following simple frequency distribution? Score f 15 1
14 2
13 3
12 4
11 5
A)0.10
B)0.11
C)0.13
D)0.16
14 2
13 3
12 4
11 5
A)0.10
B)0.11
C)0.13
D)0.16
Unlock Deck
Unlock for access to all 55 flashcards in this deck.
Unlock Deck
k this deck
10
What is wrong in the following table? Score f
A)The scores and the frequencies must be reversed.
B)The relative frequencies are reported in the f column.
C)Not all possible scores between the highest and lowest observed scores are reported.
D)Nothing is wrong.
A)The scores and the frequencies must be reversed.
B)The relative frequencies are reported in the f column.
C)Not all possible scores between the highest and lowest observed scores are reported.
D)Nothing is wrong.
Unlock Deck
Unlock for access to all 55 flashcards in this deck.
Unlock Deck
k this deck
11
Which graphing techniques are appropriate for interval and ratio data?
A)Histograms and frequency polygons
B)Bar graphs and frequency polygons
C)Bar graphs and histograms
D)Bar graphs, histograms, and frequency polygons
A)Histograms and frequency polygons
B)Bar graphs and frequency polygons
C)Bar graphs and histograms
D)Bar graphs, histograms, and frequency polygons
Unlock Deck
Unlock for access to all 55 flashcards in this deck.
Unlock Deck
k this deck
12
In statistics, a symmetrical, bell-shaped polygon is called a/an
A)histogram.
B)bimodal distribution.
C)percentile.
D)normal curve.
A)histogram.
B)bimodal distribution.
C)percentile.
D)normal curve.
Unlock Deck
Unlock for access to all 55 flashcards in this deck.
Unlock Deck
k this deck
13
Relative frequency is defined as the
A)number of times a given score occurs in a sample.
B)proportion of the total N at a given score value.
C)frequency of all scores at or below a score.
D)total number of scores divided by the frequency of a given score.
A)number of times a given score occurs in a sample.
B)proportion of the total N at a given score value.
C)frequency of all scores at or below a score.
D)total number of scores divided by the frequency of a given score.
Unlock Deck
Unlock for access to all 55 flashcards in this deck.
Unlock Deck
k this deck
14
The distinguishing characteristic of an idealized bimodal distribution is
A)all the scores are the same.
B)all the frequencies are the same.
C)two scores have the same and the highest frequency.
D)it is always symmetrical.
A)all the scores are the same.
B)all the frequencies are the same.
C)two scores have the same and the highest frequency.
D)it is always symmetrical.
Unlock Deck
Unlock for access to all 55 flashcards in this deck.
Unlock Deck
k this deck
15
What are the shaded areas in the following distribution called?
A)Ends
B)Tails
C)Legs
D)Edges
A)Ends
B)Tails
C)Legs
D)Edges
Unlock Deck
Unlock for access to all 55 flashcards in this deck.
Unlock Deck
k this deck
16
In statistical notation, f stands for the
A)number of times a given score occurs in a sample.
B)total number of scores in a data set.
C)relative frequency of a given score.
D)cumulative frequency of a given score.
A)number of times a given score occurs in a sample.
B)total number of scores in a data set.
C)relative frequency of a given score.
D)cumulative frequency of a given score.
Unlock Deck
Unlock for access to all 55 flashcards in this deck.
Unlock Deck
k this deck
17
The distinguishing characteristic of the frequency polygon is
A)the bars are shaded in.
B)the graph is created by connecting the dots with straight lines.
C)the graph does not center the bars over the scores on the X axis.
D)the graph centers the bars over the scores on the X axis.
A)the bars are shaded in.
B)the graph is created by connecting the dots with straight lines.
C)the graph does not center the bars over the scores on the X axis.
D)the graph centers the bars over the scores on the X axis.
Unlock Deck
Unlock for access to all 55 flashcards in this deck.
Unlock Deck
k this deck
18
To obtain the relative frequency, we would
A)count the total number of scores.
B)add the frequencies below a score to the score's frequency.
C)divide the total number of scores by the frequency for a score.
D)divide the frequency for a score by the total number of scores.
A)count the total number of scores.
B)add the frequencies below a score to the score's frequency.
C)divide the total number of scores by the frequency for a score.
D)divide the frequency for a score by the total number of scores.
Unlock Deck
Unlock for access to all 55 flashcards in this deck.
Unlock Deck
k this deck
19
A distribution that is not a perfectly shaped normal distribution should be labeled as a/an
A)imperfect distribution.
B)normal distribution.
C)skewed distribution.
D)model distribution
A)imperfect distribution.
B)normal distribution.
C)skewed distribution.
D)model distribution
Unlock Deck
Unlock for access to all 55 flashcards in this deck.
Unlock Deck
k this deck
20
Using the frequency distribution below, what is the total frequency of the scores 6 and 7?
A)0.33
B)13
C)15
D)17
A)0.33
B)13
C)15
D)17
Unlock Deck
Unlock for access to all 55 flashcards in this deck.
Unlock Deck
k this deck
21
For the following data set, draw the appropriate type of graph.8, 8, 7, 7, 6, 6, 6, 6, 6, 6, 5, 5, 5, 5, 5, 4, 4, 4, 3, 3, 2
Unlock Deck
Unlock for access to all 55 flashcards in this deck.
Unlock Deck
k this deck
22
In a normal curve, the proportion of the area under the curve between two scores represents
A)the frequency of the lower score.
B)the relative frequency of the lower score.
C)the relative frequency of all scores between the two scores.
D)the relative frequency of all scores below the upper score.
A)the frequency of the lower score.
B)the relative frequency of the lower score.
C)the relative frequency of all scores between the two scores.
D)the relative frequency of all scores below the upper score.
Unlock Deck
Unlock for access to all 55 flashcards in this deck.
Unlock Deck
k this deck
23
Draw a bar graph for the following frequency distribution.
Score f Red 2
Blue 5
Green 4
Orange 3
Score f Red 2
Blue 5
Green 4
Orange 3
Unlock Deck
Unlock for access to all 55 flashcards in this deck.
Unlock Deck
k this deck
24
If a score appears 20 times in a sample of 80 scores, what is its relative frequency?
A).25
B)4
C)20
D).20
A).25
B)4
C)20
D).20
Unlock Deck
Unlock for access to all 55 flashcards in this deck.
Unlock Deck
k this deck
25
What is the shape of the following distribution?
Unlock Deck
Unlock for access to all 55 flashcards in this deck.
Unlock Deck
k this deck
26
For the following data set, draw a frequency polygon.
10, 10, 9, 9, 9, 8, 8, 8, 7, 7, 6, 6, 6, 6, 6, 6, 5, 5, 5, 5, 5, 3, 3, 2, 2, 2, 2, 1, 1, 1
10, 10, 9, 9, 9, 8, 8, 8, 7, 7, 6, 6, 6, 6, 6, 6, 5, 5, 5, 5, 5, 3, 3, 2, 2, 2, 2, 1, 1, 1
Unlock Deck
Unlock for access to all 55 flashcards in this deck.
Unlock Deck
k this deck
27
What is the percent for the score "7" in the following distribution?
A).22
B)5
C)22
D)30
A).22
B)5
C)22
D)30
Unlock Deck
Unlock for access to all 55 flashcards in this deck.
Unlock Deck
k this deck
28
What is the shape of the following distribution?
Unlock Deck
Unlock for access to all 55 flashcards in this deck.
Unlock Deck
k this deck
29
What is the relative frequency for the score of 14 in the following simple frequency distribution?
Score f 15 1
14 2
13 3
12 4
11 5
Score f 15 1
14 2
13 3
12 4
11 5
Unlock Deck
Unlock for access to all 55 flashcards in this deck.
Unlock Deck
k this deck
30
Another term for a "dot" placed on any graph is called a
A)data point.
B)scattergram.
C)histogram.
D)distribution.
A)data point.
B)scattergram.
C)histogram.
D)distribution.
Unlock Deck
Unlock for access to all 55 flashcards in this deck.
Unlock Deck
k this deck
31
For the following frequencies, what are the correct relative frequencies?
Score f 9 5
8 3
7 9
6 4
5 3
4 6
Score f 9 5
8 3
7 9
6 4
5 3
4 6
Unlock Deck
Unlock for access to all 55 flashcards in this deck.
Unlock Deck
k this deck
32
distributions contain low-frequency, extreme low scores without low-frequency extreme high scores.
A)Negatively skewed
B)Positively skewed
C)Bimodal
D)Normal
A)Negatively skewed
B)Positively skewed
C)Bimodal
D)Normal
Unlock Deck
Unlock for access to all 55 flashcards in this deck.
Unlock Deck
k this deck
33
Which of the following statements about bar graphs is false?
A)Adjacent bars touch.
B)It can be used with nominal scores.
C)It can be used with ordinal scores.
D)It has a vertical bar centered over each X score.
A)Adjacent bars touch.
B)It can be used with nominal scores.
C)It can be used with ordinal scores.
D)It has a vertical bar centered over each X score.
Unlock Deck
Unlock for access to all 55 flashcards in this deck.
Unlock Deck
k this deck
34
For the following data set, identify the shape of the distribution.
8, 8, 7, 7, 6, 6, 6, 6, 6, 6, 6, 6, 5, 5, 5, 4, 4, 4, 3, 3, 2
8, 8, 7, 7, 6, 6, 6, 6, 6, 6, 6, 6, 5, 5, 5, 4, 4, 4, 3, 3, 2
Unlock Deck
Unlock for access to all 55 flashcards in this deck.
Unlock Deck
k this deck
35
distributions contain low-frequency, extreme high scores without low-frequency extreme low scores.
A)Positively skewed
B)Negatively skewed
C)Bimodal
D)Normal
A)Positively skewed
B)Negatively skewed
C)Bimodal
D)Normal
Unlock Deck
Unlock for access to all 55 flashcards in this deck.
Unlock Deck
k this deck
36
What is the relative frequency for the score of 12 in the following frequency distribution?
Score f 16 1
15 0
14 2
13 3
12 10
11 4
Score f 16 1
15 0
14 2
13 3
12 10
11 4
Unlock Deck
Unlock for access to all 55 flashcards in this deck.
Unlock Deck
k this deck
37
In which type of distribution will the lowest scores be found on the lower left-hand side of the X axis?
A)In any distribution
B)Only in a normal distribution
C)Only in a positively skewed distribution
D)Only in a negatively skewed distribution
A)In any distribution
B)Only in a normal distribution
C)Only in a positively skewed distribution
D)Only in a negatively skewed distribution
Unlock Deck
Unlock for access to all 55 flashcards in this deck.
Unlock Deck
k this deck
38
What is the shape of the following distribution?
Unlock Deck
Unlock for access to all 55 flashcards in this deck.
Unlock Deck
k this deck
39
If a score's relative frequency is .6 when N is 50, what is the score's frequency?
A)30
B)3
C)20
D)It cannot be determined from this information.
A)30
B)3
C)20
D)It cannot be determined from this information.
Unlock Deck
Unlock for access to all 55 flashcards in this deck.
Unlock Deck
k this deck
40
What is the shape of the following distribution?
Unlock Deck
Unlock for access to all 55 flashcards in this deck.
Unlock Deck
k this deck
41
In a data set with 25 scores, if the value 16 occurs 12 times, what is its relative frequency?
Unlock Deck
Unlock for access to all 55 flashcards in this deck.
Unlock Deck
k this deck
42
Suppose the scores between 20 and 40 have a relatively frequency of .30.What area under the normal curve do these scores constitute?
Unlock Deck
Unlock for access to all 55 flashcards in this deck.
Unlock Deck
k this deck
43
Suppose you scored a 72 on a given test as did 11 other individuals.While no one scored below you, 23 other people scored above you.What is the cumulative frequency for your score?
Unlock Deck
Unlock for access to all 55 flashcards in this deck.
Unlock Deck
k this deck
44
Suppose in a normal distribution, where the mean is 50, you have a score of 4.Where in the distribution would this score fall?
Unlock Deck
Unlock for access to all 55 flashcards in this deck.
Unlock Deck
k this deck
45
If the number of hot lunches sold at school this week was 1,350 and the relative frequency on Friday was 0.22, how many lunches were sold on Friday?
Unlock Deck
Unlock for access to all 55 flashcards in this deck.
Unlock Deck
k this deck
46
Use the following data set to construct a frequency distribution table showing a) frequency, b) relative frequency, and c) percent.
21, 21, 20, 20, 19, 17, 17, 16, 16, 16, 16, 14
21, 21, 20, 20, 19, 17, 17, 16, 16, 16, 16, 14
Unlock Deck
Unlock for access to all 55 flashcards in this deck.
Unlock Deck
k this deck
47
For a given set of data, would it be possible to have the following relative frequencies: .45, .33, .22., .18, .29? Why or why not?
Unlock Deck
Unlock for access to all 55 flashcards in this deck.
Unlock Deck
k this deck
48
Suppose you've noted that your score is to the left of your friend's when placed on a normal distribution.What should you infer from this fact?
Unlock Deck
Unlock for access to all 55 flashcards in this deck.
Unlock Deck
k this deck
49
For the following data set, generate the frequency distribution table.Provide columns for frequency, relative frequency, and percent.
8, 8, 7, 7, 6, 6, 6, 6, 6, 6, 5, 5, 5, 5, 5, 4, 4, 4, 3, 3, 2
8, 8, 7, 7, 6, 6, 6, 6, 6, 6, 5, 5, 5, 5, 5, 4, 4, 4, 3, 3, 2
Unlock Deck
Unlock for access to all 55 flashcards in this deck.
Unlock Deck
k this deck
50
If a score's relative frequency is 0.27, what is its percent?
Unlock Deck
Unlock for access to all 55 flashcards in this deck.
Unlock Deck
k this deck
51
What frequency distribution would you expect this data to have?
Unlock Deck
Unlock for access to all 55 flashcards in this deck.
Unlock Deck
k this deck
52
If in a grouped distribution, the frequency for the "5-10" group was 7, what should the frequency of a score of "5" be?
Unlock Deck
Unlock for access to all 55 flashcards in this deck.
Unlock Deck
k this deck
53
Suppose you scored on the 63rd percentile on a standardized test.What percent of the population would have scored higher than you?
Unlock Deck
Unlock for access to all 55 flashcards in this deck.
Unlock Deck
k this deck
54
In the following frequency distribution, the score of 5 would have a percent of .
Score f 7 1
6 2
5 4
4 5
3 4
2 0
1 2
0 1
Score f 7 1
6 2
5 4
4 5
3 4
2 0
1 2
0 1
Unlock Deck
Unlock for access to all 55 flashcards in this deck.
Unlock Deck
k this deck
55
In a normal distribution, if 5% of the scores are greater than 80, what percentage of the scores are between the mean and 80?
Unlock Deck
Unlock for access to all 55 flashcards in this deck.
Unlock Deck
k this deck
Unlock Deck
Unlock for access to all 55 flashcards in this deck.


