Exam 2: Creating and Using Frequency Distributions
Exam 1: Introduction to Statistics and Research50 Questions
Exam 2: Creating and Using Frequency Distributions55 Questions
Exam 3: Summarizing Scores With Measures of Central Tendency60 Questions
Exam 4: Summarizing Scores With Measures of Variability58 Questions
Exam 5: Describing Data With Z-Scores and the Normal Curve53 Questions
Exam 6: Using Probability to Make Decisions About Data54 Questions
Exam 7: Overview of Statistical Hypothesis Testing: the Z-Test49 Questions
Exam 8: Hypothesis Testing Using the One-Sample T-Test44 Questions
Exam 9: Hypothesis Testing Using the Two-Sample T-Test49 Questions
Exam 10: Describing Relationships Using Correlation and Regression40 Questions
Exam 11: Hypothesis Testing Using the One-Way Analysis of Variance34 Questions
Exam 12: Understanding the Two-Way Analysis of Variance34 Questions
Exam 13: Chi Square and Nonparametric Procedures35 Questions
Select questions type
Suppose you scored on the 63rd percentile on a standardized test.What percent of the population would have scored higher than you?
Free
(Essay)
4.9/5  (40)
(40)
Correct Answer: Verified
100% - 63% = 37%.Thus, 37% scored above you.
A graph of a frequency distribution shows the frequencies on the
Free
(Multiple Choice)
4.7/5 (34)
Correct Answer:Verified
B
If a score's relative frequency is .6 when N is 50, what is the score's frequency?
Free
(Multiple Choice)
4.8/5 (32)
Correct Answer:Verified
A
Suppose you've noted that your score is to the left of your friend's when placed on a normal distribution.What should you infer from this fact?
(Essay)
4.8/5 (47)
What are the shaded areas in the following distribution called? 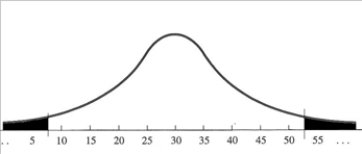
(Multiple Choice)
4.8/5 (35)
In which type of distribution will the lowest scores be found on the lower left-hand side of the X axis?
(Multiple Choice)
4.9/5 (38)
In statistics, a symmetrical, bell-shaped polygon is called a/an
(Multiple Choice)
4.7/5 (45)
________distributions contain low-frequency, extreme high scores without low-frequency extreme low scores.
(Multiple Choice)
4.9/5 (39)
Which of the following statements about bar graphs is false?
(Multiple Choice)
4.9/5 (29)
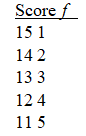
What is the relative frequency for the score of 14 in the following simple frequency distribution?
(Short Answer)
4.8/5 (34)
What is the relative frequency for the score of 14 in the following simple frequency distribution?

(Multiple Choice)
4.8/5 (37)
For the following data set, draw a frequency polygon.
10, 10, 9, 9, 9, 8, 8, 8, 7, 7, 6, 6, 6, 6, 6, 6, 5, 5, 5, 5, 5, 3, 3, 2, 2, 2, 2, 1, 1, 1
(Essay)
4.9/5 (40)
For the following data set, draw the appropriate type of graph.
8, 8, 7, 7, 6, 6, 6, 6, 6, 6, 5, 5, 5, 5, 5, 4, 4, 4, 3, 3, 2
(Essay)
4.8/5 (35)
Filters
- Essay(0)
- Multiple Choice(0)
- Short Answer(0)
- True False(0)
- Matching(0)