Deck 22: Business Statistics
Full screen (f)
Question
Question
Question
Question
Question
Question
Question
Question
Question
Question
Question
Question
Question
Question
Question
Question
Question
Question
Question
Question
Question
Question
Question
Question
Question
Question
Question
Question
Question
Question
Question
Question
Phil's Barbeque sold the following dinners in one hour: 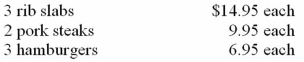 What was the average dollar mean?
A)$10.70
B)12.97
C)$6.35
D)$10.00
What was the average dollar mean?A)$10.70
B)12.97
C)$6.35
D)$10.00
Question
Question
Alvin's Bakery produced the following number of oat bran muffins each week: 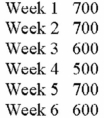 In a frequency distribution, which would have the lowest tally?
A)600
B)700
C)500
D)650
E)None of these
In a frequency distribution, which would have the lowest tally?A)600
B)700
C)500
D)650
E)None of these
Question
Question
Question
Question
Question
Question
Question
Question
Jim's Donut Shop reported the following sales for the first 20 days: 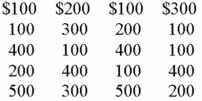 Complete a frequency distribution.
Complete a frequency distribution. Question
Given the following sales of Roe Co., prepare a line graph (run sales to $50,000 in increments of $10,000): 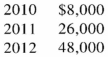
Question
Question
Paula's Printing Company produced the following number of bound books during the first five weeks of last year: 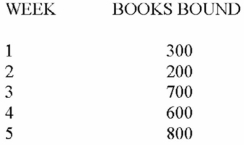 Prepare a bar graph.
Prepare a bar graph. Question
Question
At the college bookstore, the following sales were rung up. Based on this, prepare a frequency distribution. Use intervals of 0-$5.99, $6.00-$11.99, $12.00-$17.99, and $18.00-$23.99. 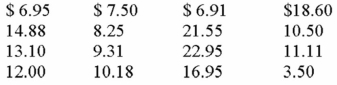
Question
Art's Hardware reported the following sales for the first 20 days of October: 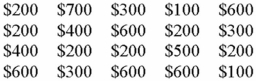 Prepare a frequency distribution for Art.
Prepare a frequency distribution for Art. Question
How many degrees on a pie chart would each be given from the following? 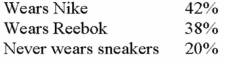
Question
Question
Question
At the college bookstore, the following sales were rung up. Based on this, prepare a bar graph. Use intervals of 0-$5.99, $6.00-$11.99, $12.00-$17.99, and $18.00-$23.99. 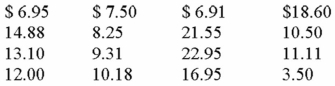

Unlock Deck
Sign up to unlock the cards in this deck!
Unlock Deck
Unlock Deck
1/52
Play
Full screen (f)
Deck 22: Business Statistics
1
Bar charts are nonvisual presentations of data.
False
2
The median is the middle value for an even number of values.
False
3
Calculating one's grade point average is an example of using the median.
False
4
If all values are different, there is no mode.
Unlock Deck
Unlock for access to all 52 flashcards in this deck.
Unlock Deck
k this deck
5
Frequency of occurrence is used in finding the weighted mean.
Unlock Deck
Unlock for access to all 52 flashcards in this deck.
Unlock Deck
k this deck
6
A consumer price index is an example of a price relative.
Unlock Deck
Unlock for access to all 52 flashcards in this deck.
Unlock Deck
k this deck
7
A line graph may be used to discover trends.
Unlock Deck
Unlock for access to all 52 flashcards in this deck.
Unlock Deck
k this deck
8
A median will distort an average that has one or more extreme values.
Unlock Deck
Unlock for access to all 52 flashcards in this deck.
Unlock Deck
k this deck
9
In a normal distribution, data is spread asymmetrically about the median.
Unlock Deck
Unlock for access to all 52 flashcards in this deck.
Unlock Deck
k this deck
10
In finding the mode, you must arrange values from smallest to largest.
Unlock Deck
Unlock for access to all 52 flashcards in this deck.
Unlock Deck
k this deck
11
A frequency distribution tries to avoid organizing numbers to show what patterns exist.
Unlock Deck
Unlock for access to all 52 flashcards in this deck.
Unlock Deck
k this deck
12
To draw a circle graph, each part should be converted.
Unlock Deck
Unlock for access to all 52 flashcards in this deck.
Unlock Deck
k this deck
13
The height of a bar chart represents the frequency.
Unlock Deck
Unlock for access to all 52 flashcards in this deck.
Unlock Deck
k this deck
14
Intervals can be used with bar graphs.
Unlock Deck
Unlock for access to all 52 flashcards in this deck.
Unlock Deck
k this deck
15
Intervals should be of unequal size.
Unlock Deck
Unlock for access to all 52 flashcards in this deck.
Unlock Deck
k this deck
16
The median is a better indicator than the mean.
Unlock Deck
Unlock for access to all 52 flashcards in this deck.
Unlock Deck
k this deck
17
The sum of products divided by the sum of frequencies equals the weighted mean.
Unlock Deck
Unlock for access to all 52 flashcards in this deck.
Unlock Deck
k this deck
18
Value times frequency equals product.
Unlock Deck
Unlock for access to all 52 flashcards in this deck.
Unlock Deck
k this deck
19
The range is the difference between the highest and lowest values in a series or group of values.
Unlock Deck
Unlock for access to all 52 flashcards in this deck.
Unlock Deck
k this deck
20
All means should be rounded to the nearest tenth.
Unlock Deck
Unlock for access to all 52 flashcards in this deck.
Unlock Deck
k this deck
21
Which is incorrect?
A)The mode is a measurement that records value
B)A bar graph is the same as a line graph
C)A mean may cause distortions
D)A circle graph is based on 360°
E)None of these
A)The mode is a measurement that records value
B)A bar graph is the same as a line graph
C)A mean may cause distortions
D)A circle graph is based on 360°
E)None of these
Unlock Deck
Unlock for access to all 52 flashcards in this deck.
Unlock Deck
k this deck
22
Find the mean (do not round): 38 + 18.05 + 25 + 26 + 46
A)21.4
B)23
C)22.
D)30.61
E)None of these
A)21.4
B)23
C)22.
D)30.61
E)None of these
Unlock Deck
Unlock for access to all 52 flashcards in this deck.
Unlock Deck
k this deck
23
To avoid distortion of extreme values, a good indicator would be the:
A)Mean
B)Median
C)Weighted-mean
D)Mode
E)None of these
A)Mean
B)Median
C)Weighted-mean
D)Mode
E)None of these
Unlock Deck
Unlock for access to all 52 flashcards in this deck.
Unlock Deck
k this deck
24
Calculate the weighted mean from the following sales: $400, $700, $300, $600, $300, $400, $700
A)$700
B)$300
C)$400
D)$500
E)None of these
A)$700
B)$300
C)$400
D)$500
E)None of these
Unlock Deck
Unlock for access to all 52 flashcards in this deck.
Unlock Deck
k this deck
25
The range of 35, 22, 43, 18, 22, 27, 48, 39, 31, and 16 is:
A)32
B)30
C)29
D)22
A)32
B)30
C)29
D)22
Unlock Deck
Unlock for access to all 52 flashcards in this deck.
Unlock Deck
k this deck
26
From the following numbers, the median is: 16, 9, 10, 5, 4
A)9
B)4
C)5
D)10
A)9
B)4
C)5
D)10
Unlock Deck
Unlock for access to all 52 flashcards in this deck.
Unlock Deck
k this deck
27
Calculate the mode from the following: 71, 3, 13, 33, 3, 71, 14, 33, 13, 33
A)3
B)13
C)33
D)71
E)None of these
A)3
B)13
C)33
D)71
E)None of these
Unlock Deck
Unlock for access to all 52 flashcards in this deck.
Unlock Deck
k this deck
28
The range of 105, 100, 79, 86, 101, 94, 98, 87, and 83 is:
A)26
B)92
C)96
D)94
A)26
B)92
C)96
D)94
Unlock Deck
Unlock for access to all 52 flashcards in this deck.
Unlock Deck
k this deck
29
Find the mode: 6, 6, 8, 9, 3, 9, 6, 3
A)4
B)3
C)9
D)6
E)None of these
A)4
B)3
C)9
D)6
E)None of these
Unlock Deck
Unlock for access to all 52 flashcards in this deck.
Unlock Deck
k this deck
30
Assume the mean useful life of a particular lightbulb is 2,000 hours and is normally distributed with a standard deviation of 300 hours. Calculate the useful life of lightbulbs within two standard deviations of the mean.
A)Between 1,700 and 2,300 hours
B)Longer than 2,300 hours
C)Longer than 1,700 hours
D)Between 1,400 and 2,600 hours
A)Between 1,700 and 2,300 hours
B)Longer than 2,300 hours
C)Longer than 1,700 hours
D)Between 1,400 and 2,600 hours
Unlock Deck
Unlock for access to all 52 flashcards in this deck.
Unlock Deck
k this deck
31
What is the weighted mean frequency for the following car sales? 2 sold at $25,090, 3 sold at $20,000, 1 sold at $21,475, and 1 sold at $39,638)
A)$24,740
B)$24,000
C)$21,241
D)$24,470
E)None of these
A)$24,740
B)$24,000
C)$21,241
D)$24,470
E)None of these
Unlock Deck
Unlock for access to all 52 flashcards in this deck.
Unlock Deck
k this deck
32
Phil's Barbeque sold the following dinners in one hour: What was the average dollar mean?
A)$10.70
B)12.97
C)$6.35
D)$10.00
What was the average dollar mean?A)$10.70
B)12.97
C)$6.35
D)$10.00
Unlock Deck
Unlock for access to all 52 flashcards in this deck.
Unlock Deck
k this deck
33
The range of 55, 93, 48, 53, 55, 93, 63, 80, 75, and 55 is:
A)45
B)67
C)59
D)55
A)45
B)67
C)59
D)55
Unlock Deck
Unlock for access to all 52 flashcards in this deck.
Unlock Deck
k this deck
34
Alvin's Bakery produced the following number of oat bran muffins each week: In a frequency distribution, which would have the lowest tally?
A)600
B)700
C)500
D)650
E)None of these
In a frequency distribution, which would have the lowest tally?A)600
B)700
C)500
D)650
E)None of these
Unlock Deck
Unlock for access to all 52 flashcards in this deck.
Unlock Deck
k this deck
35
Hector Rameriz received three A's and one B in his college courses. What is his grade point average? Assume each course is three credits. A = 4, B = 3, C = 2, D = 1.
A)3.0
B)3.25
C)3.75
D)3.80
E)None of these
A)3.0
B)3.25
C)3.75
D)3.80
E)None of these
Unlock Deck
Unlock for access to all 52 flashcards in this deck.
Unlock Deck
k this deck
36
The mean of the following is: 14, 8, 3, 8, 5
A)7.2
B)7.1
C)7.4
D)7.5
E)None of these
A)7.2
B)7.1
C)7.4
D)7.5
E)None of these
Unlock Deck
Unlock for access to all 52 flashcards in this deck.
Unlock Deck
k this deck
37
Find the median from the following numbers: 15, 8, 7, 5, 4, 1, 9, 16
A)7.5
B)7.0
C)8.0
D)8.5
E)None of these
A)7.5
B)7.0
C)8.0
D)8.5
E)None of these
Unlock Deck
Unlock for access to all 52 flashcards in this deck.
Unlock Deck
k this deck
38
Professor Bowdidge taught four business statistics classes during the fall semester with the following grade averages for each class. Calculate the mean (round to the nearest hundredth): 82%, 86%, 91%, and 74%
A)83.25%
B)83.12%
C)83.00%
D)85.00%
A)83.25%
B)83.12%
C)83.00%
D)85.00%
Unlock Deck
Unlock for access to all 52 flashcards in this deck.
Unlock Deck
k this deck
39
What is the range of 22, 22, 27, 29, 30, 34, and 38?
A)22
B)29
C)16
D)27
A)22
B)29
C)16
D)27
Unlock Deck
Unlock for access to all 52 flashcards in this deck.
Unlock Deck
k this deck
40
Today the price of a Jeep is $25,000. In 1970 the price was $5,000. What is the price relative?
A)600
B)166
C)300
D)400
E)None of these
A)600
B)166
C)300
D)400
E)None of these
Unlock Deck
Unlock for access to all 52 flashcards in this deck.
Unlock Deck
k this deck
41
The range of 105, 108, 117, 122, 129, and 129 is:
A)129
B)117
C)122
D)24
A)129
B)117
C)122
D)24
Unlock Deck
Unlock for access to all 52 flashcards in this deck.
Unlock Deck
k this deck
42
Jim's Donut Shop reported the following sales for the first 20 days: Complete a frequency distribution.
Complete a frequency distribution. Unlock Deck
Unlock for access to all 52 flashcards in this deck.
Unlock Deck
k this deck
43
Given the following sales of Roe Co., prepare a line graph (run sales to $50,000 in increments of $10,000):
Unlock Deck
Unlock for access to all 52 flashcards in this deck.
Unlock Deck
k this deck
44
Russell Co. reported sales of $400,000 in 2012. This compared to sales of $180,000 in 2011 and $100,000 in 2010. Construct a line graph for Russell Co.
Unlock Deck
Unlock for access to all 52 flashcards in this deck.
Unlock Deck
k this deck
45
Paula's Printing Company produced the following number of bound books during the first five weeks of last year: Prepare a bar graph.
Prepare a bar graph. Unlock Deck
Unlock for access to all 52 flashcards in this deck.
Unlock Deck
k this deck
46
The range of 17, 24, 24, 27, 29, 31, and 36 is:
A)17
B)26
C)24
D)19
A)17
B)26
C)24
D)19
Unlock Deck
Unlock for access to all 52 flashcards in this deck.
Unlock Deck
k this deck
47
At the college bookstore, the following sales were rung up. Based on this, prepare a frequency distribution. Use intervals of 0-$5.99, $6.00-$11.99, $12.00-$17.99, and $18.00-$23.99.
Unlock Deck
Unlock for access to all 52 flashcards in this deck.
Unlock Deck
k this deck
48
Art's Hardware reported the following sales for the first 20 days of October: Prepare a frequency distribution for Art.
Prepare a frequency distribution for Art. Unlock Deck
Unlock for access to all 52 flashcards in this deck.
Unlock Deck
k this deck
49
How many degrees on a pie chart would each be given from the following?
Unlock Deck
Unlock for access to all 52 flashcards in this deck.
Unlock Deck
k this deck
50
Angie Corporation reported profits of 18%. It stated in the report that cost of sales was 42% with expenses of 40%. Prepare a circle graph for Angie.
Unlock Deck
Unlock for access to all 52 flashcards in this deck.
Unlock Deck
k this deck
51
Calculate the standard deviation (to the nearest hundredth) for the following sample set of data (round mean to nearest hundredth):
82.5, 91.3, 57.4, 41.7, 76.9, 68.5
82.5, 91.3, 57.4, 41.7, 76.9, 68.5
Unlock Deck
Unlock for access to all 52 flashcards in this deck.
Unlock Deck
k this deck
52
At the college bookstore, the following sales were rung up. Based on this, prepare a bar graph. Use intervals of 0-$5.99, $6.00-$11.99, $12.00-$17.99, and $18.00-$23.99.
Unlock Deck
Unlock for access to all 52 flashcards in this deck.
Unlock Deck
k this deck
Unlock Deck
Unlock for access to all 52 flashcards in this deck.


