Exam 22: Business Statistics
Exam 1: Whole Number: How to Dissect and Solve Word Problems55 Questions
Exam 2: Fractions71 Questions
Exam 3: Decimals62 Questions
Exam 4: Banking67 Questions
Exam 5: Solving for the Unknown: a How to Approach to Solving Equations65 Questions
Exam 6: Percents and Their Applications48 Questions
Exam 7: Discounts: Trade and Cash68 Questions
Exam 8: Markups and Markdowns: Perishables and Breakeven Analysis62 Questions
Exam 9: Payroll62 Questions
Exam 10: Simple Interest49 Questions
Exam 11: Promissory Notes, Simple Discount Notes and the Discount Process56 Questions
Exam 12: Compound Interest and Present Value56 Questions
Exam 13: Annuities and Sinking Funds45 Questions
Exam 14: Installment Buying38 Questions
Exam 15: The Cost of Home Ownership49 Questions
Exam 16: How to Read, Analyze, and Interpret Financial Reports74 Questions
Exam 17: Appreciation53 Questions
Exam 18: Inventory and Overhead56 Questions
Exam 19: Sales Excise and Property Taxes55 Questions
Exam 20: Life, Fire and Auto Insurance57 Questions
Exam 21: Stocks, Bonds and Mutual Funds61 Questions
Exam 22: Business Statistics52 Questions
Select questions type
If all values are different, there is no mode.
Free
(True/False)
4.8/5  (41)
(41)
Correct Answer: Verified
True
Calculating one's grade point average is an example of using the median.
Free
(True/False)
4.8/5 (39)
Correct Answer:Verified
False
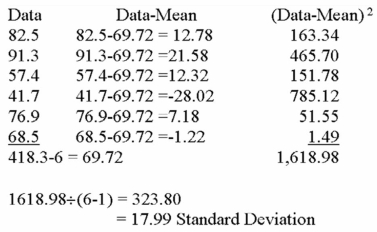
Calculate the standard deviation (to the nearest hundredth) for the following sample set of data (round mean to nearest hundredth):
82.5, 91.3, 57.4, 41.7, 76.9, 68.5
Free
(Essay)
4.7/5 (33)
Correct Answer:Verified
Given the following sales of Roe Co., prepare a line graph (run sales to $50,000 in increments of $10,000): 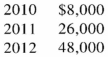
(Essay)
4.8/5 (29)
Jim's Donut Shop reported the following sales for the first 20 days: 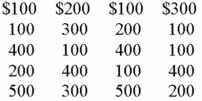 Complete a frequency distribution.
(Essay)
4.8/5 (30)
Alvin's Bakery produced the following number of oat bran muffins each week: 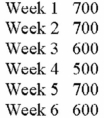 In a frequency distribution, which would have the lowest tally?
(Multiple Choice)
4.8/5 (28)
A frequency distribution tries to avoid organizing numbers to show what patterns exist.
(True/False)
4.7/5 (34)
How many degrees on a pie chart would each be given from the following? 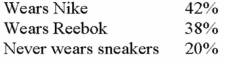
(Essay)
4.8/5 (36)
Russell Co. reported sales of $400,000 in 2012. This compared to sales of $180,000 in 2011 and $100,000 in 2010. Construct a line graph for Russell Co.
(Essay)
4.8/5 (42)
Professor Bowdidge taught four business statistics classes during the fall semester with the following grade averages for each class. Calculate the mean (round to the nearest hundredth): 82%, 86%, 91%, and 74%
(Multiple Choice)
4.9/5 (39)
Paula's Printing Company produced the following number of bound books during the first five weeks of last year: 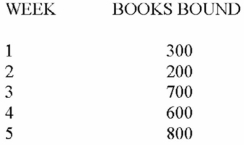 Prepare a bar graph.
(Essay)
4.7/5 (29)
To avoid distortion of extreme values, a good indicator would be the:
(Multiple Choice)
4.9/5 (35)
Assume the mean useful life of a particular lightbulb is 2,000 hours and is normally distributed with a standard deviation of 300 hours. Calculate the useful life of lightbulbs within two standard deviations of the mean.
(Multiple Choice)
4.8/5 (38)
Calculate the weighted mean from the following sales: $400, $700, $300, $600, $300, $400, $700
(Multiple Choice)
4.9/5 (37)
Angie Corporation reported profits of 18%. It stated in the report that cost of sales was 42% with expenses of 40%. Prepare a circle graph for Angie.
(Essay)
4.8/5 (36)
Filters
- Essay(0)
- Multiple Choice(0)
- Short Answer(0)
- True False(0)
- Matching(0)