Deck 7: Offer Curves and the Terms of Trade
Full screen (f)
Question
Question
Question
Question
Question
Question
Question
Question
Question
Question
Question
Question
In the following offer curve diagram,
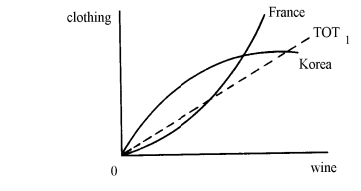
At TOT1, there is excess demand for __________, and the movement to equilibrium will result in better terms of trade for __________.
A) wine; France
B) wine; Korea
C) clothing; France
D) clothing; Korea
At TOT1, there is excess demand for __________, and the movement to equilibrium will result in better terms of trade for __________.
A) wine; France
B) wine; Korea
C) clothing; France
D) clothing; Korea
Question
Question
Question
Question
Question
Question
Question
Question
Question
Question
Question
Question
Question
Question
In the following offer curve diagram, showing one normally-shaped offer curve and one straight-line offer curve,
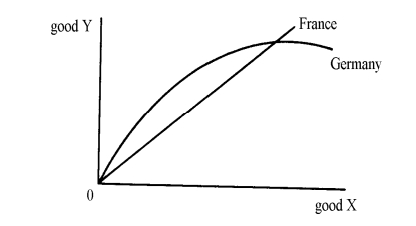
Germany is exporting good __________, and __________ is a "small country" in this Particular situation.
A) X; France
B) X; Germany
C) Y; France
D) Y; Germany
Germany is exporting good __________, and __________ is a "small country" in this Particular situation.
A) X; France
B) X; Germany
C) Y; France
D) Y; Germany
Question
In the following offer curve diagram,
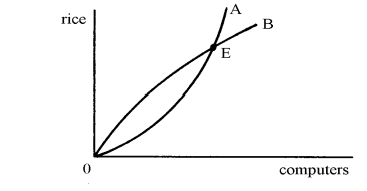
If, starting from the initial equilibrium point E, countries A and B both increase their Demand for computers, then country A's terms of trade will __________ and the volume of A's exports will __________.
A) improve; fall
B) improve; rise, fall, or stay the same (cannot be determined without more Information)
C) deteriorate; rise
D) improve, deteriorate, or stay the same (cannot be determined without more Information); rise
Question

Unlock Deck
Sign up to unlock the cards in this deck!
Unlock Deck
Unlock Deck
1/28
Play
Full screen (f)
Deck 7: Offer Curves and the Terms of Trade
1
When Spain and Portugal joined the European Community (EC) in 1986, the United States feared that a result of this change might be a shift in demand for agricultural products by Spain and Portugal away from the United States and toward other Community members. In response, the United States threatened to impose stiff tariffs on a variety of exports of the rest of the EC to the United States. Using offer curve diagrams for (a) the United States and Spain/ Portugal, (b) Spain/Portugal and the rest of the EC, and (c) the United States and the rest of the EC, illustrate and explain the effects of these potential events on the terms of trade and volume of trade for the various economic units.
not answered
2
(a) Define the concept of a country's (call it country A's) offer curve. Will this curve always be upward-sloping? Briefly, why or why not?
(b) Put country A's offer curve together with the offer curve of a trading partner country (call it country B) and indicate the equilibrium position. Then suppose that, from this equilibrium position, country A's consumers now change their tastes toward wanting relatively more of A's export good at the same time that country B reduces its tariff on A's export good. Explain the impact of each event separately on the volume of trade of each good and on the terms of trade. Then indicate whether it is possible to assess, when the new equilibrium position is attained, the net results of the two shifts together on the volume of trade of each good and on the terms of trade (in comparison with the initial equilibrium). (Assume that the offer curves are "elastic" throughout.)
(b) Put country A's offer curve together with the offer curve of a trading partner country (call it country B) and indicate the equilibrium position. Then suppose that, from this equilibrium position, country A's consumers now change their tastes toward wanting relatively more of A's export good at the same time that country B reduces its tariff on A's export good. Explain the impact of each event separately on the volume of trade of each good and on the terms of trade. Then indicate whether it is possible to assess, when the new equilibrium position is attained, the net results of the two shifts together on the volume of trade of each good and on the terms of trade (in comparison with the initial equilibrium). (Assume that the offer curves are "elastic" throughout.)
not answered
3
"If we observe that a home country's volume and terms of trade are both movingin the same direction (i.e., either both increasing or both decreasing), then we can surmise that the home country's offer curve is shifting. However, if we observe that the home country's volume and terms of trade are moving in opposite directions (i.e., one is increasing and the other is decreasing), then we can surmise that the foreign offer curve is shifting." Is this statement correct or incorrect? Illustrate and explain your answer. (Assume "elastic" offer curves throughout.)
not answered
4
The "income terms of trade" index would be calculated by which one of the following formulas (where PX = price index of exports, PM = price index of imports, QX = quantity index of exports, and QM = quantity index of imports)?
A) (PX/PM).100
B) (QM/QX).100
C) (PX.QX)/PM
D) (PX.QX)/(PM.QM ).100
A) (PX/PM).100
B) (QM/QX).100
C) (PX.QX)/PM
D) (PX.QX)/(PM.QM ).100
Unlock Deck
Unlock for access to all 28 flashcards in this deck.
Unlock Deck
k this deck
5
(a) Define the theoretical concept of a country's "offer curve" (or "reciprocal demand curve"). Then, using a numerical example, construct three points on a country's offer curve, assuming that the country (call it "country A") exports wheat and imports clothing.
(b) Put the offer curve of country A [you do not need to use your specific numbers from part (a) of this question in this part (b)] together with the offer curve of trading partner country B. Explain how the equilibrium position is attained if the countries initially are in a situation that is not a position of equilibrium. (You can assume that the countries are always operating in the "elastic" portions of their offer curves.)
(c) Finally, suppose that country B's consumers change their tastes so that they now have greater preference for country A's export good than they did previously. Illustrate and carefully explain the movement from the old equilibrium position to the new equilibrium position because of this change in tastes, assuming other things equal. Be sure to include an indication of the impact on country A's terms of trade and volume of trade.
Unlock Deck
Unlock for access to all 28 flashcards in this deck.
Unlock Deck
k this deck
6
Given the following table showing possible terms of trade for country I and country I's corresponding demand for imports of good Y at each terms of trade:
A)
B)
C)
D)
Calculate the supply of exports of good X by country I at each terms of trade and plot the resulting offer curve. What is the nature of the elasticity of demand for imports between [i] points (a) and (b); [ii] points (b) and (c); and [iii] points (c) and (d)? How do you know? What might account for these respective elasticities?
Unlock Deck
Unlock for access to all 28 flashcards in this deck.
Unlock Deck
k this deck
7
In the following partially-completed table showing country I's demand for import good Y and supply of export good X at various terms of trade,
A) v = 40Y; w = 600X
B) v = 360Y; w = 150X
C) v = 350Y; w = 140X
D) v = 360Y; w = 140X
A) v = 40Y; w = 600X
B) v = 360Y; w = 150X
C) v = 350Y; w = 140X
D) v = 360Y; w = 140X
Unlock Deck
Unlock for access to all 28 flashcards in this deck.
Unlock Deck
k this deck
8
Suppose that country I is importing good Y and exporting good X. At a terms of trade of 1X:4Y, country I is willing to import 60 units of Y and to export 15 units of X in exchange; at a terms of trade of 1X:5Y, country I is willing to import 70 units of Y and to export 14 units of X in exchange. Considering just these two offer curve points, country I's demand for imports between the two points is __________.
A) elastic
B) unit-elastic
C) inelastic
D) elastic, unit-elastic, or inelastic - cannot be determined without more information
A) elastic
B) unit-elastic
C) inelastic
D) elastic, unit-elastic, or inelastic - cannot be determined without more information
Unlock Deck
Unlock for access to all 28 flashcards in this deck.
Unlock Deck
k this deck
9
In the graph in Question #19 above, suppose that, when trade is taking place at the equilibrium position, consumers in France now change tastes and shift their demand more toward clothing and away from wine. This change in tastes would
A) cause France's offer curve to shift or pivot downward and to the right.
B) cause France's offer curve to shift or pivot upward and to the left.
C) cause Korea's offer curve to shift or pivot upward and to the left.
D) cause Korea's offer curve to shift or pivot downward and to the right.
A) cause France's offer curve to shift or pivot downward and to the right.
B) cause France's offer curve to shift or pivot upward and to the left.
C) cause Korea's offer curve to shift or pivot upward and to the left.
D) cause Korea's offer curve to shift or pivot downward and to the right.
Unlock Deck
Unlock for access to all 28 flashcards in this deck.
Unlock Deck
k this deck
10
In an offer curve graph with country A's exports on the horizontal axis and country B's exports on the vertical axis, which one of the following events will shift or pivot country A's offer curve to the right?
A) the imposition of a tariff by country B
B) a decrease in demand by A for B's products
C) a tariff reduction by A on B's products
D) an increase in demand by B for A's products
A) the imposition of a tariff by country B
B) a decrease in demand by A for B's products
C) a tariff reduction by A on B's products
D) an increase in demand by B for A's products
Unlock Deck
Unlock for access to all 28 flashcards in this deck.
Unlock Deck
k this deck
11
Suppose that a home country is contemplating the imposition of a tariff in order to improve its terms of trade by a given amount. How would the decision as to the size of the tariff to impose depend on the elasticity of the foreign country's offer curve? Explain.
Unlock Deck
Unlock for access to all 28 flashcards in this deck.
Unlock Deck
k this deck
12
In the following offer curve diagram,
At TOT1, there is excess demand for __________, and the movement to equilibrium will result in better terms of trade for __________.
A) wine; France
B) wine; Korea
C) clothing; France
D) clothing; Korea
At TOT1, there is excess demand for __________, and the movement to equilibrium will result in better terms of trade for __________.
A) wine; France
B) wine; Korea
C) clothing; France
D) clothing; Korea
Unlock Deck
Unlock for access to all 28 flashcards in this deck.
Unlock Deck
k this deck
13
Suppose that, from an initial equilibrium position in the offer curve diagram, country I imposes a tariff on country II's export good at the same time that consumers in country II change their tastes toward wanting more of II's export good. Illustrate and explain the impact of these two simultaneous events on country I's volume and terms of trade. (Assume that both countries' offer curves are "elastic" throughout.)
Unlock Deck
Unlock for access to all 28 flashcards in this deck.
Unlock Deck
k this deck
14
In deriving an offer curve for a country, if a higher price of exports/price of imports leads to a reduction in the quantity of exports which the country is willing to supply, then, in this range of the offer curve, the offer curve is said to be __________.
A) inelastic
B) unit-elastic
C) elastic
D) inelastic, unit-elastic, or elastic - cannot be determined without more information
A) inelastic
B) unit-elastic
C) elastic
D) inelastic, unit-elastic, or elastic - cannot be determined without more information
Unlock Deck
Unlock for access to all 28 flashcards in this deck.
Unlock Deck
k this deck
15
In an offer curve graph with country A's exports on the horizontal axis and country B's exports on the vertical axis, which one of the following events will shift or pivot country B's offer curve downward (or to the right)?
A) decreased demand by A for B-goods
B) technological improvement in B's industries
C) imposition of a tariff by A
D) imposition of a tariff by B
A) decreased demand by A for B-goods
B) technological improvement in B's industries
C) imposition of a tariff by A
D) imposition of a tariff by B
Unlock Deck
Unlock for access to all 28 flashcards in this deck.
Unlock Deck
k this deck
16
Suppose that country I is importing good Y and exporting good X. At a terms of trade of 1X:4Y, country I is willing to import 60 units of Y and to export 15 units of X in exchange; at a terms of trade of 1X:5Y, country I is willing to import 75 units of Y and to export 15 units of X in exchange. Considering just these two offer curve points, country I's demand for imports between the two points is __________.
A) elastic
B) unit-elastic
C) inelastic
D) elastic, unit-elastic, or inelastic - cannot be determined without more
Information
A) elastic
B) unit-elastic
C) inelastic
D) elastic, unit-elastic, or inelastic - cannot be determined without more
Information
Unlock Deck
Unlock for access to all 28 flashcards in this deck.
Unlock Deck
k this deck
17
In an offer curve diagram with country A's export good (country B's import good) on the horizontal axis and country B's export good (country A's import good) on the vertical axis, which one of the following events will shift or pivot country B's offer curve upward (or to the left)?
A) increased demand by A for B's export good
B) technological improvement in A's export industry
C) imposition of a tariff by B
D) a change in tastes by B's consumers toward wanting more of A's export good And less of B's export good
A) increased demand by A for B's export good
B) technological improvement in A's export industry
C) imposition of a tariff by B
D) a change in tastes by B's consumers toward wanting more of A's export good And less of B's export good
Unlock Deck
Unlock for access to all 28 flashcards in this deck.
Unlock Deck
k this deck
18
Given the following indexes for country I in 2012, with 2005 = 100:
(a) Calculate country I's net barter or commodity terms of trade for 2012 (round to nearest one decimal place if necessary)..
(b) Calculate country I's income terms of trade for 2012 (round to nearest one decimal place if necessary)..
(c) Explain your differing results for (a) and (b) and briefly explain the significance of each terms-of-trade movement for country I.
Unlock Deck
Unlock for access to all 28 flashcards in this deck.
Unlock Deck
k this deck
19
If country I is trading in the inelastic range of country II's offer curve, then the imposition of a tariff by country I, which still leaves country I in the inelastic range of country II's curve, will (assuming no retaliation) lead to __________ in country I's terms of trade and to __________ in the volume of imports of country I.
A) a deterioration; a decrease
B) a deterioration; an increase
C) an improvement; a decrease
D) an improvement; an increase
A) a deterioration; a decrease
B) a deterioration; an increase
C) an improvement; a decrease
D) an improvement; an increase
Unlock Deck
Unlock for access to all 28 flashcards in this deck.
Unlock Deck
k this deck
20
(a) Define the "offer curve" (or "reciprocal demand curve") of a country. If an offer curve is drawn as an upward-sloping curve, what is being assumed about the value of thecountry's elasticity of demand for imports and why does this assumption yield the upward-sloping curve?
(b) Using the usual two-good, two-country offer-curve diagram, identify the equilibrium position and state why the position is one of equilibrium. Then suppose that, from this initial equilibrium position, one country now experiences an increase in productivity in its export industry at the same time that the other country imposes an import tariff. Illustrate and explain the combined or overall impact of these two events on the equilibrium terms of trade and on the quantity traded of each of the two goods. If a combined impact is uncertain, briefly indicate why it is uncertain.
(b) Using the usual two-good, two-country offer-curve diagram, identify the equilibrium position and state why the position is one of equilibrium. Then suppose that, from this initial equilibrium position, one country now experiences an increase in productivity in its export industry at the same time that the other country imposes an import tariff. Illustrate and explain the combined or overall impact of these two events on the equilibrium terms of trade and on the quantity traded of each of the two goods. If a combined impact is uncertain, briefly indicate why it is uncertain.
Unlock Deck
Unlock for access to all 28 flashcards in this deck.
Unlock Deck
k this deck
21
In a two-commodity, two-country trading world (as in the offer curve diagrams), if, at a Given terms of trade (price of good X ÷ price of good Y), there is an excess demand for Good X, then there must __________ and the price of good X relative to the price of good Y will therefore __________.
A) also be an excess demand for good Y; rise
B) also be an excess demand for good Y; rise, fall, or not change - cannot be determined Without more information
C) be an excess supply of good Y; rise
D) be an excess supply of good Y; fall
A) also be an excess demand for good Y; rise
B) also be an excess demand for good Y; rise, fall, or not change - cannot be determined Without more information
C) be an excess supply of good Y; rise
D) be an excess supply of good Y; fall
Unlock Deck
Unlock for access to all 28 flashcards in this deck.
Unlock Deck
k this deck
22
International Monetary Fund data indicate that, with 2005 = 100.0, Sweden's export price Index in 2011 was 129.7, its import price index in 2011 was 133.3, its export quantity Index in 2011 was 115.9, and its import quantity index in 2011 was 129.0. Given this Information, a calculation of Sweden's "income" terms of trade for 2011 would give a Result of __________.
A) 87.4
B) 112.8
C) 119.1
D) 132.6
A) 87.4
B) 112.8
C) 119.1
D) 132.6
Unlock Deck
Unlock for access to all 28 flashcards in this deck.
Unlock Deck
k this deck
23
Suppose that a country is exporting good X and importing good Y. Suppose also that, in a particular range of the country's offer curve, a rise in the relative price of X causes the country to export less of X and to import more of Y. Then, in this range,
A) with respect to good Y, the "income effect" of a rise in the terms of trade outweighs The "substitution effect" and the "production effect."
B) with respect to good X, the "substitution effect" of a rise in the terms of trade Outweighs the "income effect" and the "production effect."
C) with respect to good X, the "production effect" of a rise in the terms of trade Outweighs the "substitution effect" and the "income effect."
D) with respect to good X, the "income effect" of a rise in the terms of trade outweighs The "substitution effect" and the "production effect."
Unlock Deck
Unlock for access to all 28 flashcards in this deck.
Unlock Deck
k this deck
24
Suppose that country I is importing good Y and exporting good X. At a terms of trade of 1X:3Y, country I is willing to import 90 units of Y and to export 30 units of X in exchange; at a terms of trade of 1X:4Y, country I is willing to import 128 units of Y and to export 32 units of X in exchange. Considering just these two offer curve points, country I's demand for imports over the range between these two points is __________.
A) inelastic
B) unit elastic
C) elastic
D) inelastic, unit elastic, or elastic - cannot be determined without more
Information
A) inelastic
B) unit elastic
C) elastic
D) inelastic, unit elastic, or elastic - cannot be determined without more
Information
Unlock Deck
Unlock for access to all 28 flashcards in this deck.
Unlock Deck
k this deck
25
A "small" country in international trade is defined as
A) a country that can influence its volume of trade.
B) a country that can influence its terms of trade.
C) a country that cannot influence its volume of trade.
D) a country that cannot influence its terms of trade.
A) a country that can influence its volume of trade.
B) a country that can influence its terms of trade.
C) a country that cannot influence its volume of trade.
D) a country that cannot influence its terms of trade.
Unlock Deck
Unlock for access to all 28 flashcards in this deck.
Unlock Deck
k this deck
26
In the following offer curve diagram, showing one normally-shaped offer curve and one straight-line offer curve,
Germany is exporting good __________, and __________ is a "small country" in this Particular situation.
A) X; France
B) X; Germany
C) Y; France
D) Y; Germany
Germany is exporting good __________, and __________ is a "small country" in this Particular situation.
A) X; France
B) X; Germany
C) Y; France
D) Y; Germany
Unlock Deck
Unlock for access to all 28 flashcards in this deck.
Unlock Deck
k this deck
27
In the following offer curve diagram,
If, starting from the initial equilibrium point E, countries A and B both increase their Demand for computers, then country A's terms of trade will __________ and the volume of A's exports will __________.
A) improve; fall
B) improve; rise, fall, or stay the same (cannot be determined without more Information)
C) deteriorate; rise
D) improve, deteriorate, or stay the same (cannot be determined without more Information); rise
Unlock Deck
Unlock for access to all 28 flashcards in this deck.
Unlock Deck
k this deck
28
International Monetary Fund data indicate that, with 2005 = 100.0, Thailand's export price index for 2011 was 104.7 and Thailand's import price index for 2011 was 111.1. Further, with 2005 = 100.0, the export price index for 2011 for the United Kingdom was 118.5 and the import price index for 2011 for the United Kingdom was 121.0. With this information, an economist would say that, from 2005 to 2011, Thailand experienced __________ in its commodity terms of trade and the United Kingdom __________ in its commodity terms of trade.
A) a deterioration; also experienced a deterioration
B) a deterioration; experienced an improvement
C) an improvement; experienced a deterioration
D) an improvement; also experienced an improvement
A) a deterioration; also experienced a deterioration
B) a deterioration; experienced an improvement
C) an improvement; experienced a deterioration
D) an improvement; also experienced an improvement
Unlock Deck
Unlock for access to all 28 flashcards in this deck.
Unlock Deck
k this deck
Unlock Deck
Unlock for access to all 28 flashcards in this deck.


