Exam 7: Offer Curves and the Terms of Trade
Exam 2: Early Trade Theories: Mercantilism and the Transition to the Classical World of David Ricardo25 Questions
Exam 3: The Classical World of David Ricardo and Comparative Advantage28 Questions
Exam 4: Extensions and Tests of the Classical Model of Trade32 Questions
Exam 5: Introduction to Neoclassical Trade Theory: Tools to Be Employed26 Questions
Exam 6: Gains From Trade in Neoclassical Theory28 Questions
Exam 7: Offer Curves and the Terms of Trade28 Questions
Exam 8: The Basis for Trade: Factor Endowments and the Heckscher-Ohlin Model31 Questions
Exam 9: Empirical Tests of the Factor Endowments Approach25 Questions
Exam 10: Post Heckscher-Ohlin Theories of Trade and Intra-Industry Trade30 Questions
Exam 11: Economic Growth and International Trade34 Questions
Exam 12: International Factor Movements30 Questions
Exam 13: The Instruments of Trade Policy27 Questions
Exam 14: The Impact of Trade Policies36 Questions
Exam 15: Arguments for Interventionist Trade Policies37 Questions
Exam 16: Political Economy and Us Trade Policy25 Questions
Exam 17: Economic Integration28 Questions
Exam 18: International Trade and the Developing Countries24 Questions
Exam 19: The Balance-Of-Payments Accounts29 Questions
Exam 20: The Foreign Exchange Market33 Questions
Exam 21: International Financial Markets and Instruments: an Introduction24 Questions
Exam 22: The Monetary and Portfolio Balance Approaches to External Balance24 Questions
Exam 23: Price Adjustments and Balance-Of-Payments Disequilibrium24 Questions
Exam 24: National Income and the Current Account26 Questions
Exam 25: Economic Policy in the Open Economy Under Fixed Exchange Rates28 Questions
Exam 26: Economic Policy in the Open Economy Under Flexible Exchange Rates27 Questions
Exam 27: Prices and Output in the Open Economy: Aggregate Supply and Demand28 Questions
Exam 28: Fixed or Flexible Exchange Rates25 Questions
Exam 29: The International Monetary System: Past, Present, and Future28 Questions
Select questions type
Suppose that a country is exporting good X and importing good Y. Suppose also that, in a particular range of the country's offer curve, a rise in the relative price of X causes the country to export less of X and to import more of Y. Then, in this range,
Free
(Multiple Choice)
4.8/5  (31)
(31)
Correct Answer: Verified
D
In an offer curve graph with country A's exports on the horizontal axis and country B's exports on the vertical axis, which one of the following events will shift or pivot country B's offer curve downward (or to the right)?
Free
(Multiple Choice)
4.7/5 (40)
Correct Answer:Verified
D
In deriving an offer curve for a country, if a higher price of exports/price of imports leads to a reduction in the quantity of exports which the country is willing to supply, then, in this range of the offer curve, the offer curve is said to be __________.
Free
(Multiple Choice)
4.7/5 (39)
Correct Answer:Verified
A
Suppose that country I is importing good Y and exporting good X. At a terms of trade of 1X:4Y, country I is willing to import 60 units of Y and to export 15 units of X in exchange; at a terms of trade of 1X:5Y, country I is willing to import 75 units of Y and to export 15 units of X in exchange. Considering just these two offer curve points, country I's demand for imports between the two points is __________.
(Multiple Choice)
4.8/5 (33)
Given the following indexes for country I in 2012, with 2005 = 100:
price of exports =112 quantity of exports =94 price of imports =108 quantity of imports =102
(a) Calculate country I's net barter or commodity terms of trade for 2012 (round to nearest one decimal place if necessary)..
(b) Calculate country I's income terms of trade for 2012 (round to nearest one decimal place if necessary)..
(c) Explain your differing results for (a) and (b) and briefly explain the significance of each terms-of-trade movement for country I.
(Essay)
4.8/5 (31)
In the following offer curve diagram,
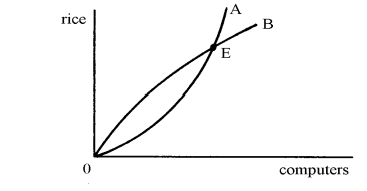 If, starting from the initial equilibrium point E, countries A and B both increase their Demand for computers, then country A's terms of trade will __________ and the volume of A's exports will __________.
(Multiple Choice)
4.8/5 (37)
Suppose that a home country is contemplating the imposition of a tariff in order to improve its terms of trade by a given amount. How would the decision as to the size of the tariff to impose depend on the elasticity of the foreign country's offer curve? Explain.
(Essay)
4.9/5 (43)
International Monetary Fund data indicate that, with 2005 = 100.0, Thailand's export price index for 2011 was 104.7 and Thailand's import price index for 2011 was 111.1. Further, with 2005 = 100.0, the export price index for 2011 for the United Kingdom was 118.5 and the import price index for 2011 for the United Kingdom was 121.0. With this information, an economist would say that, from 2005 to 2011, Thailand experienced __________ in its commodity terms of trade and the United Kingdom __________ in its commodity terms of trade.
(Multiple Choice)
4.9/5 (26)
Suppose that country I is importing good Y and exporting good X. At a terms of trade of 1X:3Y, country I is willing to import 90 units of Y and to export 30 units of X in exchange; at a terms of trade of 1X:4Y, country I is willing to import 128 units of Y and to export 32 units of X in exchange. Considering just these two offer curve points, country I's demand for imports over the range between these two points is __________.
(Multiple Choice)
4.8/5 (30)
The "income terms of trade" index would be calculated by which one of the following formulas (where PX = price index of exports, PM = price index of imports, QX = quantity index of exports, and QM = quantity index of imports)?
(Multiple Choice)
4.8/5 (33)
In a two-commodity, two-country trading world (as in the offer curve diagrams), if, at a Given terms of trade (price of good X ÷ price of good Y), there is an excess demand for Good X, then there must __________ and the price of good X relative to the price of good Y will therefore __________.
(Multiple Choice)
4.9/5 (32)
(a) Define the concept of a country's (call it country A's) offer curve. Will this curve always be upward-sloping? Briefly, why or why not?
(b) Put country A's offer curve together with the offer curve of a trading partner country (call it country B) and indicate the equilibrium position. Then suppose that, from this equilibrium position, country A's consumers now change their tastes toward wanting relatively more of A's export good at the same time that country B reduces its tariff on A's export good. Explain the impact of each event separately on the volume of trade of each good and on the terms of trade. Then indicate whether it is possible to assess, when the new equilibrium position is attained, the net results of the two shifts together on the volume of trade of each good and on the terms of trade (in comparison with the initial equilibrium). (Assume that the offer curves are "elastic" throughout.)
(Essay)
4.8/5 (37)
In the following offer curve diagram, showing one normally-shaped offer curve and one straight-line offer curve,
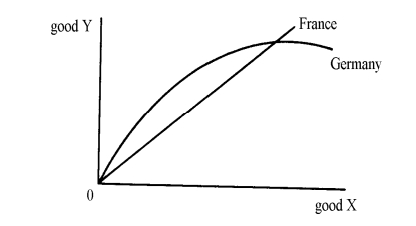 Germany is exporting good __________, and __________ is a "small country" in this Particular situation.
(Multiple Choice)
4.8/5 (41)
In the graph in Question #19 above, suppose that, when trade is taking place at the equilibrium position, consumers in France now change tastes and shift their demand more toward clothing and away from wine. This change in tastes would
(Multiple Choice)
5.0/5 (37)
International Monetary Fund data indicate that, with 2005 = 100.0, Sweden's export price Index in 2011 was 129.7, its import price index in 2011 was 133.3, its export quantity Index in 2011 was 115.9, and its import quantity index in 2011 was 129.0. Given this Information, a calculation of Sweden's "income" terms of trade for 2011 would give a Result of __________.
(Multiple Choice)
4.8/5 (34)
In an offer curve diagram with country A's export good (country B's import good) on the horizontal axis and country B's export good (country A's import good) on the vertical axis, which one of the following events will shift or pivot country B's offer curve upward (or to the left)?
(Multiple Choice)
4.7/5 (35)
Given the following table showing possible terms of trade for country I and country I's corresponding demand for imports of good Y at each terms of trade:
possible terms of trade I's quantity demanded of imports of Y
A)
B)
C)
D)
Calculate the supply of exports of good X by country I at each terms of trade and plot the resulting offer curve. What is the nature of the elasticity of demand for imports between [i] points (a) and (b); [ii] points (b) and (c); and [iii] points (c) and (d)? How do you know? What might account for these respective elasticities?
(Short Answer)
4.7/5 (37)
When Spain and Portugal joined the European Community (EC) in 1986, the United States feared that a result of this change might be a shift in demand for agricultural products by Spain and Portugal away from the United States and toward other Community members. In response, the United States threatened to impose stiff tariffs on a variety of exports of the rest of the EC to the United States. Using offer curve diagrams for (a) the United States and Spain/ Portugal, (b) Spain/Portugal and the rest of the EC, and (c) the United States and the rest of the EC, illustrate and explain the effects of these potential events on the terms of trade and volume of trade for the various economic units.
(Essay)
4.9/5 (32)
Suppose that, from an initial equilibrium position in the offer curve diagram, country I imposes a tariff on country II's export good at the same time that consumers in country II change their tastes toward wanting more of II's export good. Illustrate and explain the impact of these two simultaneous events on country I's volume and terms of trade. (Assume that both countries' offer curves are "elastic" throughout.)
(Essay)
4.9/5 (40)
Filters
- Essay(0)
- Multiple Choice(0)
- Short Answer(0)
- True False(0)
- Matching(0)