Deck 2: Frequency Distributions
Full screen (f)
Question
Question
Question
Question
Use the following to answer questions
This table and figure depict the average SAT scores for entering freshmen in the year 1995 at 36 North Carolina colleges.
Figure: Histogram of SAT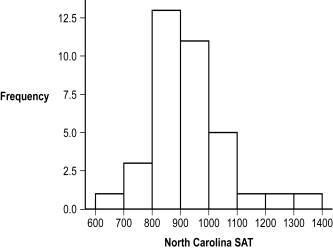
-(Figure: Histogram of SAT) Based on the frequency distribution, approximately how many participants scored 1000 or above?
A) 3
B) 5
C) 8
D) 11
This table and figure depict the average SAT scores for entering freshmen in the year 1995 at 36 North Carolina colleges.
Figure: Histogram of SAT
-(Figure: Histogram of SAT) Based on the frequency distribution, approximately how many participants scored 1000 or above?
A) 3
B) 5
C) 8
D) 11
Question
Question
Use the following to answer questions
This histogram represents the distribution of the number of years of education completed by twins who attended the 16th Annual Twins Day Festival in Twinsburg, Ohio, in August of 1991.
Figure: Years of Education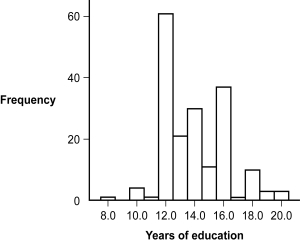
(Figure: Years of Education) Based on the distribution, what is the number of years of education that was completed by most twins?
A) 12.0
B) 13.0
C) 14.0
D) 16.0
Question
Question
Question
Question
Use the following to answer questions
This histogram represents the distribution of the number of years of education completed by twins who attended the 16th Annual Twins Day Festival in Twinsburg, Ohio, in August of 1991.
Figure: Years of Education
(Figure: Years of Education) What seems to be the shape of this distribution?
A) negatively skewed
B) positively skewed
C) rectangle
D) symmetrical
Question
Question
Question
Question
Question
Question
Question
Use the following to answer questions
This histogram represents the distribution of the number of years of education completed by twins who attended the 16th Annual Twins Day Festival in Twinsburg, Ohio, in August of 1991.
Figure: Years of Education
(Figure: Years of Education) Based on the distribution, how many twins completed 13 years of education?
A) 11
B) 12
C) 20
D) 65
Question
Question
Question
Question
Question
Question
Question
Use the following to answer questions
This polygon represents a fictional distribution of scores.
Figure: Frequency Polygon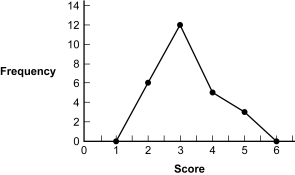
(Figure: Frequency Polygon) Based on the frequency distribution, how many participants scored a 4 or above?
A) 4
B) 5
C) 8
D) 10
This polygon represents a fictional distribution of scores.
Figure: Frequency Polygon
(Figure: Frequency Polygon) Based on the frequency distribution, how many participants scored a 4 or above?
A) 4
B) 5
C) 8
D) 10
Question
Question
Use the following to answer questions
This table and figure depict the average SAT scores for entering freshmen in the year 1995 at 36 North Carolina colleges.
Figure: Histogram of SAT
-(Figure: Histogram of SAT) Based on the frequency distribution, what was the interval with the most common score?
A) 700-799
B) 800-899
C) 900-999
D) 1000-1099
Question
Question
Use the following to answer questions
This polygon represents a fictional distribution of scores.
Figure: Frequency Polygon
(Figure: Frequency Polygon) Based on the frequency distribution, how many participants scored a 6?
A) 0
B) 1
C) 6
D) 18
This polygon represents a fictional distribution of scores.
Figure: Frequency Polygon
(Figure: Frequency Polygon) Based on the frequency distribution, how many participants scored a 6?
A) 0
B) 1
C) 6
D) 18
Question
Question
Question
Use the following to answer questions
This polygon represents a fictional distribution of scores.
Figure: Frequency Polygon
(Figure: Frequency Polygon) Based on the frequency distribution, how many participants scored between 1 and 3?
A) 2
B) 3
C) 3.5
D) 18
This polygon represents a fictional distribution of scores.
Figure: Frequency Polygon
(Figure: Frequency Polygon) Based on the frequency distribution, how many participants scored between 1 and 3?
A) 2
B) 3
C) 3.5
D) 18
Question
Question
Use the following to answer questions
This polygon represents a fictional distribution of scores.
Figure: Frequency Polygon
(Figure: Frequency Polygon) Based on the distribution, how many participants scored 3?
A) 5
B) 11.5
C) 12
D) 18
This polygon represents a fictional distribution of scores.
Figure: Frequency Polygon
(Figure: Frequency Polygon) Based on the distribution, how many participants scored 3?
A) 5
B) 11.5
C) 12
D) 18
Question
Question
Use the following to answer questions
This table and figure depict the average SAT scores for entering freshmen in the year 1995 at 36 North Carolina colleges.
Figure: Histogram of SAT
-(Figure: Histogram of SAT) What seems to be the shape of the distribution represented in this histogram?
A) symmetrical
B) positively skewed
C) rectangle
D) negatively skewed
Question
Question
Question
Question
Use the following to answer question
This histogram represents the frequency of graduation rates for all U.S.colleges (data collected by U.S.News & World Report, 1995).
Figure: Graduation Rates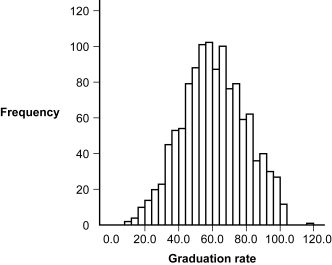
(Figure: Graduation Rates) The shape of the distribution of graduation rates appears to be:
A) normal.
B) rectangular.
C) positively skewed.
D) negatively skewed.
Question
Use the following to answer questions
This polygon represents a fictional distribution of scores.
Figure: Frequency Polygon
(Figure: Frequency Polygon) What seems to be the shape of the distribution represented in this frequency polygon?
A) symmetrical
B) positively skewed
C) rectangle
D) negatively skewed
This polygon represents a fictional distribution of scores.
Figure: Frequency Polygon
(Figure: Frequency Polygon) What seems to be the shape of the distribution represented in this frequency polygon?
A) symmetrical
B) positively skewed
C) rectangle
D) negatively skewed
Question
Question
Question
Question
Question
Question
Question
Question
Question
Question
Question
Question
Question
Question
Question
Question
Question
Question
Question
Question
Question
Question
Question
Question
Question
Question
Question
Question
Question
Question
Question
Question
Question
Question
Question
Question
Question
Question
Question
Question

Unlock Deck
Sign up to unlock the cards in this deck!
Unlock Deck
Unlock Deck
1/89
Play
Full screen (f)
Deck 2: Frequency Distributions
1
Which of these is NOT displayed in a frequency table?
A) the frequency of observations at each variable value
B) values outside of the variable's range of observed values
C) all observed variable values
D) outlier data that is unexpected
A) the frequency of observations at each variable value
B) values outside of the variable's range of observed values
C) all observed variable values
D) outlier data that is unexpected
values outside of the variable's range of observed values
2
A grouped frequency table is most useful when the:
A) scores in the data set vary over a small range of discrete values.
B) data are ordinal.
C) data are measured on an interval scale and vary over a large range of continuous values.
D) data are nominal.
A) scores in the data set vary over a small range of discrete values.
B) data are ordinal.
C) data are measured on an interval scale and vary over a large range of continuous values.
D) data are nominal.
data are measured on an interval scale and vary over a large range of continuous values.
3
Imagine that 18 out of every 33 homes have a dog in the household.What percentage of homes has a dog?
A) 1.83
B) 18.00
C) 54.55
D) 63.67
A) 1.83
B) 18.00
C) 54.55
D) 63.67
54.55
4
Use the following to answer questions
This table and figure depict the average SAT scores for entering freshmen in the year 1995 at 36 North Carolina colleges.
Figure: Histogram of SAT
-(Figure: Histogram of SAT) Based on the frequency distribution, approximately how many participants scored 1000 or above?
A) 3
B) 5
C) 8
D) 11
This table and figure depict the average SAT scores for entering freshmen in the year 1995 at 36 North Carolina colleges.
Figure: Histogram of SAT
-(Figure: Histogram of SAT) Based on the frequency distribution, approximately how many participants scored 1000 or above?
A) 3
B) 5
C) 8
D) 11
Unlock Deck
Unlock for access to all 89 flashcards in this deck.
Unlock Deck
k this deck
5
Bar graphs typically provide scores for _____ data.
A) nominal
B) ordinal
C) interval
D) ratio
A) nominal
B) ordinal
C) interval
D) ratio
Unlock Deck
Unlock for access to all 89 flashcards in this deck.
Unlock Deck
k this deck
6
Use the following to answer questions
This histogram represents the distribution of the number of years of education completed by twins who attended the 16th Annual Twins Day Festival in Twinsburg, Ohio, in August of 1991.
Figure: Years of Education
(Figure: Years of Education) Based on the distribution, what is the number of years of education that was completed by most twins?
A) 12.0
B) 13.0
C) 14.0
D) 16.0
Unlock Deck
Unlock for access to all 89 flashcards in this deck.
Unlock Deck
k this deck
7
When constructing a frequency table, the final step is to:
A) count the number of scores at each value and write those numbers in the frequency column.
B) create two columns.
C) label one column Name and another column Frequency.
D) determine the highest and the lowest score.
A) count the number of scores at each value and write those numbers in the frequency column.
B) create two columns.
C) label one column Name and another column Frequency.
D) determine the highest and the lowest score.
Unlock Deck
Unlock for access to all 89 flashcards in this deck.
Unlock Deck
k this deck
8
Imagine that 180 people out of a total of 705 people surveyed reported owning a smartphone.What percentage of people surveyed own a smartphone?
A) 12.50
B) 18.94
C) 25.53
D) 31.68
A) 12.50
B) 18.94
C) 25.53
D) 31.68
Unlock Deck
Unlock for access to all 89 flashcards in this deck.
Unlock Deck
k this deck
9
A _____ is a visual depiction of data that shows how often each value occurred.
A) frequency distribution
B) frequency table
C) grouped frequency table
D) frequency polygon
A) frequency distribution
B) frequency table
C) grouped frequency table
D) frequency polygon
Unlock Deck
Unlock for access to all 89 flashcards in this deck.
Unlock Deck
k this deck
10
Use the following to answer questions
This histogram represents the distribution of the number of years of education completed by twins who attended the 16th Annual Twins Day Festival in Twinsburg, Ohio, in August of 1991.
Figure: Years of Education
(Figure: Years of Education) What seems to be the shape of this distribution?
A) negatively skewed
B) positively skewed
C) rectangle
D) symmetrical
Unlock Deck
Unlock for access to all 89 flashcards in this deck.
Unlock Deck
k this deck
11
A _____ visually depicts data based on intervals rather than frequencies for specific values.
A) grouped frequency table
B) frequency table
C) frequency polygon
D) normal distribution
A) grouped frequency table
B) frequency table
C) frequency polygon
D) normal distribution
Unlock Deck
Unlock for access to all 89 flashcards in this deck.
Unlock Deck
k this deck
12
A _____ is a data point that has not yet been transformed or analyzed.
A) frequency table
B) raw score
C) frequency distribution
D) grouped frequency distribution
A) frequency table
B) raw score
C) frequency distribution
D) grouped frequency distribution
Unlock Deck
Unlock for access to all 89 flashcards in this deck.
Unlock Deck
k this deck
13
Histograms are typically used to depict _____, whereas bar graphs are typically used to depict _____.
A) scale data; nominal data
B) nominal data; interval data
C) means; frequencies
D) interval data; scale data
A) scale data; nominal data
B) nominal data; interval data
C) means; frequencies
D) interval data; scale data
Unlock Deck
Unlock for access to all 89 flashcards in this deck.
Unlock Deck
k this deck
14
Histograms typically provide frequencies for _____ data.
A) nominal
B) ordinal
C) scale
D) discrete
A) nominal
B) ordinal
C) scale
D) discrete
Unlock Deck
Unlock for access to all 89 flashcards in this deck.
Unlock Deck
k this deck
15
Raw data are observations or data points that:
A) are in their original form.
B) have been manipulated in some way.
C) have been plotted on a graph.
D) are discarded because they appear in error.
A) are in their original form.
B) have been manipulated in some way.
C) have been plotted on a graph.
D) are discarded because they appear in error.
Unlock Deck
Unlock for access to all 89 flashcards in this deck.
Unlock Deck
k this deck
16
If 2 out of 3 dentists recommend a certain kind of gum, what percentage of dentists recommend that gum, rounded to the nearest whole number?
A) 23
B) 33
C) 67
D) 80
A) 23
B) 33
C) 67
D) 80
Unlock Deck
Unlock for access to all 89 flashcards in this deck.
Unlock Deck
k this deck
17
Use the following to answer questions
This histogram represents the distribution of the number of years of education completed by twins who attended the 16th Annual Twins Day Festival in Twinsburg, Ohio, in August of 1991.
Figure: Years of Education
(Figure: Years of Education) Based on the distribution, how many twins completed 13 years of education?
A) 11
B) 12
C) 20
D) 65
Unlock Deck
Unlock for access to all 89 flashcards in this deck.
Unlock Deck
k this deck
18
When constructing a frequency table, the first step is to:
A) Divide the total number of participants by the total number of participants in a group and then multiply by 100.
B) Divide the total number of participants in a group by the total number of participants and then multiply by 100.
C) Subtract the total number of participants in a group from the total number of participants and then multiply by 100.
D) Add the total number of participants in all groups and divide by 100.
Unlock Deck
Unlock for access to all 89 flashcards in this deck.
Unlock Deck
k this deck
19
For which situation is a grouped frequency table appropriate?
A) data set on the weights of 50 adolescents, age 12 to 18
B) data set on the political affiliation of the students in your statistics class
C) data set on the number of siblings of 50 adolescents, age 12 to 18
D) data set on the letter grades of the students in your statistics class
A) data set on the weights of 50 adolescents, age 12 to 18
B) data set on the political affiliation of the students in your statistics class
C) data set on the number of siblings of 50 adolescents, age 12 to 18
D) data set on the letter grades of the students in your statistics class
Unlock Deck
Unlock for access to all 89 flashcards in this deck.
Unlock Deck
k this deck
20
A teacher calculated her students' test scores and found that overall they did very well.She found that out of the 23 students in the class, 19 of them got a 95 on her test.What percentage of students got a 95?
A) 82.61
B) 88.00
C) 90.61
D) 95.00
A) 82.61
B) 88.00
C) 90.61
D) 95.00
Unlock Deck
Unlock for access to all 89 flashcards in this deck.
Unlock Deck
k this deck
21
_____ distributions are those in which one tail of the distribution is pulled away from the center.
A) Normal
B) Nominal
C) Skewed
D) Interval
A) Normal
B) Nominal
C) Skewed
D) Interval
Unlock Deck
Unlock for access to all 89 flashcards in this deck.
Unlock Deck
k this deck
22
A normal distribution is also known as a _____ distribution.
A) nonsymmetrical
B) symmetrical
C) skewed
D) negative
A) nonsymmetrical
B) symmetrical
C) skewed
D) negative
Unlock Deck
Unlock for access to all 89 flashcards in this deck.
Unlock Deck
k this deck
23
In a _____, the tail of the distribution extends to the right.
A) negatively skewed distribution
B) positively skewed distribution
C) ceiling effect
D) normal distribution
A) negatively skewed distribution
B) positively skewed distribution
C) ceiling effect
D) normal distribution
Unlock Deck
Unlock for access to all 89 flashcards in this deck.
Unlock Deck
k this deck
24
Use the following to answer questions
This polygon represents a fictional distribution of scores.
Figure: Frequency Polygon
(Figure: Frequency Polygon) Based on the frequency distribution, how many participants scored a 4 or above?
A) 4
B) 5
C) 8
D) 10
This polygon represents a fictional distribution of scores.
Figure: Frequency Polygon
(Figure: Frequency Polygon) Based on the frequency distribution, how many participants scored a 4 or above?
A) 4
B) 5
C) 8
D) 10
Unlock Deck
Unlock for access to all 89 flashcards in this deck.
Unlock Deck
k this deck
25
In a _____, the tail of the distribution extends to the left.
A) negatively skewed distribution
B) positively skewed distribution
C) normal distribution
D) floor effect
A) negatively skewed distribution
B) positively skewed distribution
C) normal distribution
D) floor effect
Unlock Deck
Unlock for access to all 89 flashcards in this deck.
Unlock Deck
k this deck
26
Use the following to answer questions
This table and figure depict the average SAT scores for entering freshmen in the year 1995 at 36 North Carolina colleges.
Figure: Histogram of SAT
-(Figure: Histogram of SAT) Based on the frequency distribution, what was the interval with the most common score?
A) 700-799
B) 800-899
C) 900-999
D) 1000-1099
Unlock Deck
Unlock for access to all 89 flashcards in this deck.
Unlock Deck
k this deck
27
In a frequency polygon, the y-axis represents the:
A) midpoint for every interval.
B) frequencies.
C) raw scores.
D) total number of participants.
A) midpoint for every interval.
B) frequencies.
C) raw scores.
D) total number of participants.
Unlock Deck
Unlock for access to all 89 flashcards in this deck.
Unlock Deck
k this deck
28
Use the following to answer questions
This polygon represents a fictional distribution of scores.
Figure: Frequency Polygon
(Figure: Frequency Polygon) Based on the frequency distribution, how many participants scored a 6?
A) 0
B) 1
C) 6
D) 18
This polygon represents a fictional distribution of scores.
Figure: Frequency Polygon
(Figure: Frequency Polygon) Based on the frequency distribution, how many participants scored a 6?
A) 0
B) 1
C) 6
D) 18
Unlock Deck
Unlock for access to all 89 flashcards in this deck.
Unlock Deck
k this deck
29
A bell-shaped curve is similar to all EXCEPT which type of distribution?
A) symmetric
B) normal
C) unimodal
D) positively skewed
A) symmetric
B) normal
C) unimodal
D) positively skewed
Unlock Deck
Unlock for access to all 89 flashcards in this deck.
Unlock Deck
k this deck
30
In a frequency polygon, the x-axis represents the:
A) midpoint for every interval.
B) frequencies.
C) raw scores.
D) total number of participants.
A) midpoint for every interval.
B) frequencies.
C) raw scores.
D) total number of participants.
Unlock Deck
Unlock for access to all 89 flashcards in this deck.
Unlock Deck
k this deck
31
Use the following to answer questions
This polygon represents a fictional distribution of scores.
Figure: Frequency Polygon
(Figure: Frequency Polygon) Based on the frequency distribution, how many participants scored between 1 and 3?
A) 2
B) 3
C) 3.5
D) 18
This polygon represents a fictional distribution of scores.
Figure: Frequency Polygon
(Figure: Frequency Polygon) Based on the frequency distribution, how many participants scored between 1 and 3?
A) 2
B) 3
C) 3.5
D) 18
Unlock Deck
Unlock for access to all 89 flashcards in this deck.
Unlock Deck
k this deck
32
Katrina observes and records the number of people who purchase breakfast at a hospital cafeteria.The cafeteria is open from 7:00 a.m.to 11:00 a.m.and employees typically eat breakfast at 9:00 a.m.What type of distribution should Katrina expect to see in her data?
A) normal
B) positively skewed
C) negatively skewed
D) nonsymmetric
A) normal
B) positively skewed
C) negatively skewed
D) nonsymmetric
Unlock Deck
Unlock for access to all 89 flashcards in this deck.
Unlock Deck
k this deck
33
Use the following to answer questions
This polygon represents a fictional distribution of scores.
Figure: Frequency Polygon
(Figure: Frequency Polygon) Based on the distribution, how many participants scored 3?
A) 5
B) 11.5
C) 12
D) 18
This polygon represents a fictional distribution of scores.
Figure: Frequency Polygon
(Figure: Frequency Polygon) Based on the distribution, how many participants scored 3?
A) 5
B) 11.5
C) 12
D) 18
Unlock Deck
Unlock for access to all 89 flashcards in this deck.
Unlock Deck
k this deck
34
A positive skew may have a tail that indicates extreme scores _____ the center of the distribution.
A) around
B) below
C) above
D) on either side of
A) around
B) below
C) above
D) on either side of
Unlock Deck
Unlock for access to all 89 flashcards in this deck.
Unlock Deck
k this deck
35
Use the following to answer questions
This table and figure depict the average SAT scores for entering freshmen in the year 1995 at 36 North Carolina colleges.
Figure: Histogram of SAT
-(Figure: Histogram of SAT) What seems to be the shape of the distribution represented in this histogram?
A) symmetrical
B) positively skewed
C) rectangle
D) negatively skewed
Unlock Deck
Unlock for access to all 89 flashcards in this deck.
Unlock Deck
k this deck
36
A frequency polygon is similar to a histogram EXCEPT that:
A) a frequency polygon can be drawn for a greater range of data values.
B) the polygon is typically used for ordinal rather than interval data.
C) lines are used to connect the midpoint of each interval.
D) in the polygon, frequencies appear on the x-axis.
A) a frequency polygon can be drawn for a greater range of data values.
B) the polygon is typically used for ordinal rather than interval data.
C) lines are used to connect the midpoint of each interval.
D) in the polygon, frequencies appear on the x-axis.
Unlock Deck
Unlock for access to all 89 flashcards in this deck.
Unlock Deck
k this deck
37
A negative skew may have a tail that indicates extreme scores _____ the center of the distribution.
A) around
B) below
C) above
D) on either side of
A) around
B) below
C) above
D) on either side of
Unlock Deck
Unlock for access to all 89 flashcards in this deck.
Unlock Deck
k this deck
38
Professor Kellogg calculates the grades on the first exam for her statistics class.She finds that students did really well, with most students scoring 98 or higher.What type of distribution is Professor Kellogg MOST likely to have?
A) normal
B) positively skewed
C) nominal
D) negatively skewed
A) normal
B) positively skewed
C) nominal
D) negatively skewed
Unlock Deck
Unlock for access to all 89 flashcards in this deck.
Unlock Deck
k this deck
39
Use the following to answer question
This histogram represents the frequency of graduation rates for all U.S.colleges (data collected by U.S.News & World Report, 1995).
Figure: Graduation Rates
(Figure: Graduation Rates) The shape of the distribution of graduation rates appears to be:
A) normal.
B) rectangular.
C) positively skewed.
D) negatively skewed.
This histogram represents the frequency of graduation rates for all U.S.colleges (data collected by U.S.News & World Report, 1995).
Figure: Graduation Rates
(Figure: Graduation Rates) The shape of the distribution of graduation rates appears to be:
A) normal.
B) rectangular.
C) positively skewed.
D) negatively skewed.
Unlock Deck
Unlock for access to all 89 flashcards in this deck.
Unlock Deck
k this deck
40
Use the following to answer questions
This polygon represents a fictional distribution of scores.
Figure: Frequency Polygon
(Figure: Frequency Polygon) What seems to be the shape of the distribution represented in this frequency polygon?
A) symmetrical
B) positively skewed
C) rectangle
D) negatively skewed
This polygon represents a fictional distribution of scores.
Figure: Frequency Polygon
(Figure: Frequency Polygon) What seems to be the shape of the distribution represented in this frequency polygon?
A) symmetrical
B) positively skewed
C) rectangle
D) negatively skewed
Unlock Deck
Unlock for access to all 89 flashcards in this deck.
Unlock Deck
k this deck
41
The line drawn in a frequency polygon should float above the x-axis, never touching the axis.
Unlock Deck
Unlock for access to all 89 flashcards in this deck.
Unlock Deck
k this deck
42
Stem-and-leaf plots offer an advantage over histograms and frequency polygons in that they allow:
A) data to be displayed visually.
B) comparison of two groups of data together.
C) values of the data to be retained for later analyses.
D) comparison of participants across different measures.
A) data to be displayed visually.
B) comparison of two groups of data together.
C) values of the data to be retained for later analyses.
D) comparison of participants across different measures.
Unlock Deck
Unlock for access to all 89 flashcards in this deck.
Unlock Deck
k this deck
43
A histogram is typically used to depict nominal data.
Unlock Deck
Unlock for access to all 89 flashcards in this deck.
Unlock Deck
k this deck
44
It is advisable to use a grouped frequency table when depicting the frequency of interval data that vary over a large range of numbers in table format.
Unlock Deck
Unlock for access to all 89 flashcards in this deck.
Unlock Deck
k this deck
45
A researcher wanted to find the tallest person in a group of 20 women.Although he found that the tallest woman was 6 feet tall, his measurement was compromised by the fact that his scale reached only 6 feet.This example BEST illustrates which concept?
A) floor effect
B) skewed distribution
C) ceiling effect
D) negative skew
A) floor effect
B) skewed distribution
C) ceiling effect
D) negative skew
Unlock Deck
Unlock for access to all 89 flashcards in this deck.
Unlock Deck
k this deck
46
In a frequency polygon, the x-axis represents values or midpoints of intervals.
Unlock Deck
Unlock for access to all 89 flashcards in this deck.
Unlock Deck
k this deck
47
When creating a grouped frequency table, most researchers recommend using between 5 and 10 intervals.
Unlock Deck
Unlock for access to all 89 flashcards in this deck.
Unlock Deck
k this deck
48
In a frequency polygon, the x-axis represents frequencies.
Unlock Deck
Unlock for access to all 89 flashcards in this deck.
Unlock Deck
k this deck
49
Positively skewed distributions often result from:
A) a ceiling effect.
B) a floor effect.
C) unimodal curves.
D) a symmetrical distribution.
A) a ceiling effect.
B) a floor effect.
C) unimodal curves.
D) a symmetrical distribution.
Unlock Deck
Unlock for access to all 89 flashcards in this deck.
Unlock Deck
k this deck
50
Negatively skewed distributions often result from:
A) a ceiling effect.
B) a floor effect.
C) unimodal curves.
D) a symmetrical distribution.
A) a ceiling effect.
B) a floor effect.
C) unimodal curves.
D) a symmetrical distribution.
Unlock Deck
Unlock for access to all 89 flashcards in this deck.
Unlock Deck
k this deck
51
Normal distributions are nonsymmetric and inherently have no skew.
Unlock Deck
Unlock for access to all 89 flashcards in this deck.
Unlock Deck
k this deck
52
Raw scores are data that have not been modified from their original form.
Unlock Deck
Unlock for access to all 89 flashcards in this deck.
Unlock Deck
k this deck
53
In a stem-and-leaf plot for two-digit numbers, the:
A) stem is the first digit.
B) stem is the second digit.
C) leaf is the first digit.
D) leaf consists of both digits.
A) stem is the first digit.
B) stem is the second digit.
C) leaf is the first digit.
D) leaf consists of both digits.
Unlock Deck
Unlock for access to all 89 flashcards in this deck.
Unlock Deck
k this deck
54
In a frequency polygon, the y-axis represents values or midpoints of intervals.
Unlock Deck
Unlock for access to all 89 flashcards in this deck.
Unlock Deck
k this deck
55
Raw data are scores that have been modified from their original form.
Unlock Deck
Unlock for access to all 89 flashcards in this deck.
Unlock Deck
k this deck
56
Professor Kellogg calculates the grades on the first exam for her statistics class.She finds that students did really well, with most students scoring 98 or higher.What type of effect, which often corresponds to a negatively skewed distribution, is MOST likely to be influencing the shape of the distribution of scores?
A) floor
B) ceiling
C) raw score
D) interval score
A) floor
B) ceiling
C) raw score
D) interval score
Unlock Deck
Unlock for access to all 89 flashcards in this deck.
Unlock Deck
k this deck
57
In a frequency polygon, the y-axis represents frequencies.
Unlock Deck
Unlock for access to all 89 flashcards in this deck.
Unlock Deck
k this deck
58
A histogram places frequency on the y-axis and variable values on the x-axis.
Unlock Deck
Unlock for access to all 89 flashcards in this deck.
Unlock Deck
k this deck
59
A histogram is typically used to depict scale data.
Unlock Deck
Unlock for access to all 89 flashcards in this deck.
Unlock Deck
k this deck
60
Normal distributions are symmetric and inherently have no skew.
Unlock Deck
Unlock for access to all 89 flashcards in this deck.
Unlock Deck
k this deck
61
A(n) _____ is often seen in negatively skewed distributions, while a(n) _____ is often seen in positively skewed distributions.
A) ceiling effect; floor effect
B) floor effect; ceiling effect
C) symmetrical distribution; asymmetrical distribution
D) asymmetrical distribution; symmetrical distribution
A) ceiling effect; floor effect
B) floor effect; ceiling effect
C) symmetrical distribution; asymmetrical distribution
D) asymmetrical distribution; symmetrical distribution
Unlock Deck
Unlock for access to all 89 flashcards in this deck.
Unlock Deck
k this deck
62
Of the different types of distributions, which distribution is described by a tail that extends to the left?
A) positively skewed
B) negatively skewed
C) nominal
D) normal
A) positively skewed
B) negatively skewed
C) nominal
D) normal
Unlock Deck
Unlock for access to all 89 flashcards in this deck.
Unlock Deck
k this deck
63
Floor effects can lead to positive skew in a distribution.
Unlock Deck
Unlock for access to all 89 flashcards in this deck.
Unlock Deck
k this deck
64
Dr.Choi is examining the weights of 750 children, 2 to 18 years old, to find out if childhood obesity rates are increasing in his city.With this type of data, is it better to use a frequency table or a grouped frequency table? Why?
A) A frequency table is better because the data are discrete whole numbers.
B) A frequency table is better because the data cover a small range.
C) A grouped frequency table is better because the data are a large set of continuous intervals.
D) A grouped frequency table is better because the data are nominal.
Unlock Deck
Unlock for access to all 89 flashcards in this deck.
Unlock Deck
k this deck
65
Some sports have what is called a "mercy rule," that is, once the difference in scores between two teams gets to a certain level, the game is ended.In soccer, the mercy rule might end a game when one team has 15 more goals than the other team.This limit on how big the difference between points can be is an example of a ceiling effect.
Unlock Deck
Unlock for access to all 89 flashcards in this deck.
Unlock Deck
k this deck
66
Ceiling effects can lead to negative skew in a distribution.
Unlock Deck
Unlock for access to all 89 flashcards in this deck.
Unlock Deck
k this deck
67
When creating histograms and frequency polygons, the x-axis typically represents _____ and the y-axis represents _____.
A) values or intervals; the sum of squares
B) values or intervals; frequencies
C) midpoints; reaction times
D) frequencies; the sum of squares
A) values or intervals; the sum of squares
B) values or intervals; frequencies
C) midpoints; reaction times
D) frequencies; the sum of squares
Unlock Deck
Unlock for access to all 89 flashcards in this deck.
Unlock Deck
k this deck
68
In a negatively skewed distribution, the tail extends to the left.
Unlock Deck
Unlock for access to all 89 flashcards in this deck.
Unlock Deck
k this deck
69
What type of graph displays individual data points of one variable both numerically and visually?
A) histogram
B) frequency polygon
C) stem-and-leaf plot
D) frequency table
A) histogram
B) frequency polygon
C) stem-and-leaf plot
D) frequency table
Unlock Deck
Unlock for access to all 89 flashcards in this deck.
Unlock Deck
k this deck
70
A stem-and-leaf plot offers an advantage over a histogram in that it shows the data both visually and numerically, whereas a histogram displays the data visually only.
Unlock Deck
Unlock for access to all 89 flashcards in this deck.
Unlock Deck
k this deck
71
Ceiling effects can lead to positive skew in a distribution.
Unlock Deck
Unlock for access to all 89 flashcards in this deck.
Unlock Deck
k this deck
72
A _____ is a data point that has not yet been manipulated.
A) frequency distribution
B) raw score
C) normal distribution
D) positively skewed distribution
A) frequency distribution
B) raw score
C) normal distribution
D) positively skewed distribution
Unlock Deck
Unlock for access to all 89 flashcards in this deck.
Unlock Deck
k this deck
73
The EPA noticed a large increase in the output of greenhouse gases from automobile traffic between 1996 and 1998 in California.When the agency looked at the data by city, it noticed that the score for Los Angeles was significantly higher than that for the other major cities in California combined.How was the city skewing the distribution?
A) positively
B) negatively
C) symmetrically
D) unimodally
A) positively
B) negatively
C) symmetrically
D) unimodally
Unlock Deck
Unlock for access to all 89 flashcards in this deck.
Unlock Deck
k this deck
74
People who report "married" as their relationship status are assumed to have no less than one marriage.The fact that the number of marriages cannot vary below one represents a ceiling effect.
Unlock Deck
Unlock for access to all 89 flashcards in this deck.
Unlock Deck
k this deck
75
The numbers of avalanche fatalities in Colorado for the last eight seasons were reported as 1, 1, 5, 5, 5, 5, 8, and 10.Roughly what type of distribution is shown?
A) normal
B) positively skewed
C) negatively skewed
D) nominal
A) normal
B) positively skewed
C) negatively skewed
D) nominal
Unlock Deck
Unlock for access to all 89 flashcards in this deck.
Unlock Deck
k this deck
76
Mark is looking at a histogram depicting students placed in various high schools.In this histogram, the x-axis most likely represents the _____ while the y-axis most likely represents the _____.
A) values of the variable "high school"; frequencies or number of students
B) frequencies or number of students; values of the variable "high school"
C) total number of students; frequencies
D) number of extreme observations; total number of students
A) values of the variable "high school"; frequencies or number of students
B) frequencies or number of students; values of the variable "high school"
C) total number of students; frequencies
D) number of extreme observations; total number of students
Unlock Deck
Unlock for access to all 89 flashcards in this deck.
Unlock Deck
k this deck
77
In a side-by-side stem-and-leaf plot, data from unrelated variables are often presented so that they might be compared.
Unlock Deck
Unlock for access to all 89 flashcards in this deck.
Unlock Deck
k this deck
78
A graduate statistics class is unhappy with the midterm grades.The majority of students scored 45 or below on a 100-point scale, with just several students performing very well.Which type of distribution do the test scores represent?
A) normal
B) positively skewed
C) negatively skewed
D) nominal
A) normal
B) positively skewed
C) negatively skewed
D) nominal
Unlock Deck
Unlock for access to all 89 flashcards in this deck.
Unlock Deck
k this deck
79
The two most common methods for graphing interval data for one variable are the _____ and the _____.
A) grouped frequency table; frequency distribution
B) frequency distribution; frequency polygon
C) grouped frequency table; frequency polygon
D) histogram; frequency polygon
A) grouped frequency table; frequency distribution
B) frequency distribution; frequency polygon
C) grouped frequency table; frequency polygon
D) histogram; frequency polygon
Unlock Deck
Unlock for access to all 89 flashcards in this deck.
Unlock Deck
k this deck
80
Floor effects can lead to negative skew in a distribution.
Unlock Deck
Unlock for access to all 89 flashcards in this deck.
Unlock Deck
k this deck
Unlock Deck
Unlock for access to all 89 flashcards in this deck.


