Exam 2: Frequency Distributions
Exam 1: An Introduction to Statistics and Research Design156 Questions
Exam 2: Frequency Distributions89 Questions
Exam 3: Visual Displays of Data108 Questions
Exam 4: Central Tendency and Variability108 Questions
Exam 5: Sampling and Probability145 Questions
Exam 6: The Normal Curve, Standardization and Z Scores142 Questions
Exam 7: Hypothesis Testing With Z Tests141 Questions
Exam 8: Confidence Intervals, Effect Size, and Statistical Power147 Questions
Exam 9: The Single-Sample T Test124 Questions
Exam 10: The Paired-Samples T Test101 Questions
Exam 11: The Independent-Samples T Test99 Questions
Exam 12: One-Way Between-Groups Anova108 Questions
Exam 13: One-Way Within-Groups Anova102 Questions
Exam 14: Two-Way Between-Groups Anova115 Questions
Exam 15: Correlation139 Questions
Exam 16: Regression113 Questions
Exam 17: Chi-Square Tess120 Questions
Exam 18: Choosing and Reporting Statistics105 Questions
Select questions type
Imagine that 18 out of every 33 homes have a dog in the household.What percentage of homes has a dog?
Free
(Multiple Choice)
4.8/5  (33)
(33)
Correct Answer: Verified
C
A bell-shaped curve is similar to all EXCEPT which type of distribution?
Free
(Multiple Choice)
4.8/5 (42)
Correct Answer:Verified
D
Professor Kellogg calculates the grades on the first exam for her statistics class.She finds that students did really well, with most students scoring 98 or higher.What type of effect, which often corresponds to a negatively skewed distribution, is MOST likely to be influencing the shape of the distribution of scores?
Free
(Multiple Choice)
4.8/5 (43)
Correct Answer:Verified
B
When creating histograms and frequency polygons, the x-axis typically represents _____ and the y-axis represents _____.
(Multiple Choice)
4.8/5 (31)
A graduate statistics class is unhappy with the midterm grades.The majority of students scored 45 or below on a 100-point scale, with just several students performing very well.Which type of distribution do the test scores represent?
(Multiple Choice)
4.8/5 (29)
Stem-and-leaf plots offer an advantage over histograms and frequency polygons in that they allow:
(Multiple Choice)
4.9/5 (36)
A(n) _____ is often seen in negatively skewed distributions, while a(n) _____ is often seen in positively skewed distributions.
(Multiple Choice)
4.8/5 (33)
Katrina observes and records the number of people who purchase breakfast at a hospital cafeteria.The cafeteria is open from 7:00 a.m.to 11:00 a.m.and employees typically eat breakfast at 9:00 a.m.What type of distribution should Katrina expect to see in her data?
(Multiple Choice)
4.8/5 (35)
Use the following to answer questions
This table and figure depict the average SAT scores for entering freshmen in the year 1995 at 36 North Carolina colleges.
Table: North Carolina SAT 825 922 870 1121 990 1230 1302 926 1054 845 826 956 840 923 818 867 600 1030 831 935 890 879 1005 842 780 757 1002 774 915 921 1071 921 915 848 915 813
Figure: Histogram of SAT 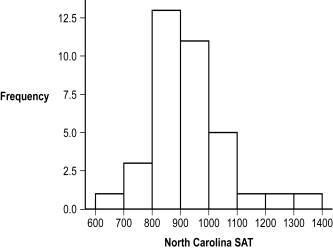 -(Figure: Histogram of SAT) What seems to be the shape of the distribution represented in this histogram?
(Multiple Choice)
4.9/5 (39)
Some sports have what is called a "mercy rule," that is, once the difference in scores between two teams gets to a certain level, the game is ended.In soccer, the mercy rule might end a game when one team has 15 more goals than the other team.This limit on how big the difference between points can be is an example of a ceiling effect.
(True/False)
4.8/5 (35)
The numbers of avalanche fatalities in Colorado for the last eight seasons were reported as 1, 1, 5, 5, 5, 5, 8, and 10.Roughly what type of distribution is shown?
(Multiple Choice)
4.9/5 (36)
Why is it sometimes easier to use a frequency table to interpret data than to examine a distribution of raw scores?
(Multiple Choice)
4.9/5 (35)
It is advisable to use a grouped frequency table when depicting the frequency of interval data that vary over a large range of numbers in table format.
(True/False)
4.8/5 (27)
People who report "married" as their relationship status are assumed to have no less than one marriage.The fact that the number of marriages cannot vary below one represents a ceiling effect.
(True/False)
4.8/5 (28)
What is one important reason for looking at visual descriptions of the data, such as frequency tables and histograms?
(Multiple Choice)
4.8/5 (31)
Filters
- Essay(0)
- Multiple Choice(0)
- Short Answer(0)
- True False(0)
- Matching(0)