Deck 13: Simple Linear Regression Analysis
Full screen (f)
Question
Question
Question
Question
Question
Question
Question
Question
Question
Question
Question
Question
Question
Question
Question
Question
Question
Question
Question
Question
Question
Question
Question
Question
Question
Question
Question
Question
In simple regression analysis,the quantity  is called the __________ sum of squares.
A)Total
B)Explained
C)Unexplained
D)Error
is called the __________ sum of squares.A)Total
B)Explained
C)Unexplained
D)Error
Question
Question
Question
Question
Question
Question
Question
Question
Question
Question
Question
Question
Question
Question
Question
Question
Question
Question
Question
Question
Question
Question
Question
The following results were obtained as part of a simple regression analysis: 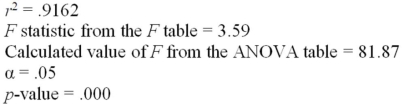 The null hypothesis of no linear relationship between the dependent variable and the independent variable:
A)Is rejected.
B)Cannot be tested with the given information.
C)Is not rejected.
D)Is not an appropriate null hypothesis for this situation.
The null hypothesis of no linear relationship between the dependent variable and the independent variable:A)Is rejected.
B)Cannot be tested with the given information.
C)Is not rejected.
D)Is not an appropriate null hypothesis for this situation.
Question
Question
Question
Question
For the same set of observations on a specified dependent variable,two different independent variables were used to develop two separate simple linear regression models.A portion of the results is presented below. 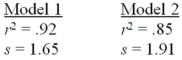 Based on the results given above,we can conclude that:
A)A prediction based on Model 1 is better than a prediction based on Model 2.
B)A prediction based on Model 2 is better than a prediction based on Model 1.
C)There is no difference in the predictive ability between Model 1 and Model 2.
D)There is not sufficient information to determine which of the two models is superior for prediction purposes.
Based on the results given above,we can conclude that:A)A prediction based on Model 1 is better than a prediction based on Model 2.
B)A prediction based on Model 2 is better than a prediction based on Model 1.
C)There is no difference in the predictive ability between Model 1 and Model 2.
D)There is not sufficient information to determine which of the two models is superior for prediction purposes.
Question
Question
Question
Question
Question
Question
An experiment was performed on a certain metal to determine if the strength is a function of heating time.Results based on 10 metal sheets are given below.Use the simple linear regression model. 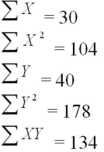 Determine the standard error.
Determine the standard error. Question
Question
Question
Question
An experiment was performed on a certain metal to determine if the strength is a function of heating time.Results based on 10 metal sheets are given below.Use the simple linear regression model.  Calculate the correlation coefficient.
Calculate the correlation coefficient. Question
An experiment was performed on a certain metal to determine if the strength is a function of heating time.Results based on 10 metal sheets are given below.Use the simple linear regression model. 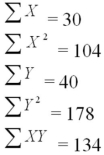 Determine SSE and SS(Total).
Determine SSE and SS(Total). Question
Question
Question
Question
An experiment was performed on a certain metal to determine if the strength is a function of heating time.The simple linear regression equation is  The time is in minutes and the strength is measured in pounds per square inch.The 95 percent confidence interval for the slope is from .564 to 1.436.Can we reject β1 = 0?
The time is in minutes and the strength is measured in pounds per square inch.The 95 percent confidence interval for the slope is from .564 to 1.436.Can we reject β1 = 0? Question
An experiment was performed on a certain metal to determine if the strength is a function of heating time.The sample size consists of 10 metal sheets.The simple linear regression equation is  The time is in minutes and the strength is measured in pounds per square inch.One of the 10 metal sheets was heated for 4 minutes and the resulting strength was 6 lbs.per square inch.Calculate the value of the residual for this observation.
The time is in minutes and the strength is measured in pounds per square inch.One of the 10 metal sheets was heated for 4 minutes and the resulting strength was 6 lbs.per square inch.Calculate the value of the residual for this observation. Question
An experiment was performed on a certain metal to determine if the strength is a function of heating time.Results based on 10 metal sheets are given below. 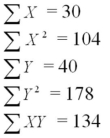 Using the simple linear regression model,find the estimated y-intercept.
Using the simple linear regression model,find the estimated y-intercept. Question
An experiment was performed on a certain metal to determine if the strength is a function of heating time.Results based on 10 metal sheets are given below.  Using the simple linear regression model,find the estimated y-intercept and slope and write the equation of the least squares regression line.
Using the simple linear regression model,find the estimated y-intercept and slope and write the equation of the least squares regression line. Question
An experiment was performed on a certain metal to determine if the strength is a function of heating time.Results based on 10 metal sheets are given below.Use the simple linear regression model. 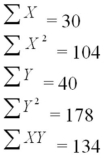 Calculate the coefficient of determination.
Calculate the coefficient of determination. Question
An experiment was performed on a certain metal to determine if the strength is a function of heating time.Results based on 10 metal sheets are given below.Use the simple linear regression model. 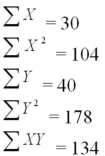 Determine the value of the F statistic.
Determine the value of the F statistic. Question
An experiment was performed on a certain metal to determine if the strength is a function of heating time.Partial results based on a sample of 10 metal sheets are given below.The simple linear regression equation is  The time is in minutes,the strength is measured in pounds per square inch,MSE = 0.5,
 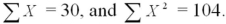 Determine the 95 percent confidence interval for the mean value of metal strength when the average heating time is 4 minutes.
The time is in minutes,the strength is measured in pounds per square inch,MSE = 0.5, Determine the 95 percent confidence interval for the mean value of metal strength when the average heating time is 4 minutes. Question
Use the following results obtained from a simple linear regression analysis with 12 observations.  Test to determine if there is a significant negative relationship between the independent and dependent variables at α = .05.Give the test statistic and the resulting conclusion.
Test to determine if there is a significant negative relationship between the independent and dependent variables at α = .05.Give the test statistic and the resulting conclusion. Question
Question
An experiment was performed on a certain metal to determine if the strength is a function of heating time.Results based on 10 metal sheets are given below.Use the simple linear regression model.  Find the t statistic and test H0: b1 ≤ 0 vs.Ha: b1> 0 at α = .05.
Find the t statistic and test H0: b1 ≤ 0 vs.Ha: b1> 0 at α = .05. Question
An experiment was performed on a certain metal to determine if the strength is a function of heating time.Results based on 10 metal sheets are given below.Use the simple linear regression model. 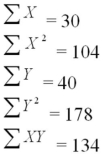 Calculate the 95 percent confidence interval for the slope.
Calculate the 95 percent confidence interval for the slope.
Unlock Deck
Sign up to unlock the cards in this deck!
Unlock Deck
Unlock Deck
1/140
Play
Full screen (f)
Deck 13: Simple Linear Regression Analysis
1
The least squares simple linear regression line minimizes the sum of the vertical deviations between the line and the data points.
False
2
In simple linear regression analysis,we assume that the variance of the independent variable (X)is equal to the variance of the dependent variable (Y).
False
3
In a simple linear regression model,the coefficient of determination not only indicates the strength of the relationship between the independent and dependent variables,but also shows whether the relationship is positive or negative.
False
4
The slope of the simple linear regression equation represents the average change in the value of the dependent variable per unit change in the independent variable (X).
Unlock Deck
Unlock for access to all 140 flashcards in this deck.
Unlock Deck
k this deck
5
The residual is the difference between the observed value of the dependent variable and the predicted value of the dependent variable.
Unlock Deck
Unlock for access to all 140 flashcards in this deck.
Unlock Deck
k this deck
6
A significant positive correlation between X and Y implies that changes in X cause Y to change.
Unlock Deck
Unlock for access to all 140 flashcards in this deck.
Unlock Deck
k this deck
7
The simple coefficient of determination is the proportion of total variation explained by the regression line.
Unlock Deck
Unlock for access to all 140 flashcards in this deck.
Unlock Deck
k this deck
8
The notation Ŷ refers to the average value of the dependent variable Y.
Unlock Deck
Unlock for access to all 140 flashcards in this deck.
Unlock Deck
k this deck
9
When there is positive autocorrelation,over time,negative error terms are followed by positive error terms and positive error terms are followed by negative error terms.
Unlock Deck
Unlock for access to all 140 flashcards in this deck.
Unlock Deck
k this deck
10
In simple regression analysis,r2 is a percentage measure and measures the proportion of the variation explained by the simple linear regression model.
Unlock Deck
Unlock for access to all 140 flashcards in this deck.
Unlock Deck
k this deck
11
When using simple regression analysis,if there is a strong correlation between the independent and dependent variables,then we can conclude that an increase in the value of the independent variable causes an increase in the value of the dependent variable.
Unlock Deck
Unlock for access to all 140 flashcards in this deck.
Unlock Deck
k this deck
12
The error term is the difference between an individual value of the dependent variable and the corresponding mean value of the dependent variable.
Unlock Deck
Unlock for access to all 140 flashcards in this deck.
Unlock Deck
k this deck
13
The standard error of the estimate (standard error)is the estimated standard deviation of the distribution of the independent variable (X)for all values of the dependent variable (Y).
Unlock Deck
Unlock for access to all 140 flashcards in this deck.
Unlock Deck
k this deck
14
The dependent variable is the variable that is being described,predicted,or controlled.
Unlock Deck
Unlock for access to all 140 flashcards in this deck.
Unlock Deck
k this deck
15
The correlation coefficient is the ratio of explained variation to total variation.
Unlock Deck
Unlock for access to all 140 flashcards in this deck.
Unlock Deck
k this deck
16
The estimated simple linear regression equation minimizes the sum of the squared deviations between each value of Y and the line.
Unlock Deck
Unlock for access to all 140 flashcards in this deck.
Unlock Deck
k this deck
17
The experimental region is the range of the previously observed values of the dependent variable.
Unlock Deck
Unlock for access to all 140 flashcards in this deck.
Unlock Deck
k this deck
18
In simple linear regression analysis,if the error terms exhibit a positive or negative autocorrelation over time,then the assumption of constant variance is violated.
Unlock Deck
Unlock for access to all 140 flashcards in this deck.
Unlock Deck
k this deck
19
If r = -1,then we can conclude that there is a perfect relationship between X and Y.
Unlock Deck
Unlock for access to all 140 flashcards in this deck.
Unlock Deck
k this deck
20
A simple linear regression model is an equation that describes the straight-line relationship between a dependent variable and an independent variable.
Unlock Deck
Unlock for access to all 140 flashcards in this deck.
Unlock Deck
k this deck
21
When the assumption of __________ residuals (error terms)is violated,the Durbin-Watson statistic is used to test to determine if there is significant _____________ among the residuals.
A)Normality,probability
B)Independent,probability
C)Independent,autocorrelation
D)Normality,autocorrelation
A)Normality,probability
B)Independent,probability
C)Independent,autocorrelation
D)Normality,autocorrelation
Unlock Deck
Unlock for access to all 140 flashcards in this deck.
Unlock Deck
k this deck
22
The least squares regression line minimizes the sum of the:
A)Differences between actual and predicted Y values.
B)Absolute deviations between actual and predicted Y values.
C)Absolute deviations between actual and predicted X values.
D)Squared differences between actual and predicted Y values.
E)Squared differences between actual and predicted X values.
A)Differences between actual and predicted Y values.
B)Absolute deviations between actual and predicted Y values.
C)Absolute deviations between actual and predicted X values.
D)Squared differences between actual and predicted Y values.
E)Squared differences between actual and predicted X values.
Unlock Deck
Unlock for access to all 140 flashcards in this deck.
Unlock Deck
k this deck
23
The point estimate of the variance in a regression model is:
A)SSE
B)b0
C)MSE
D)b1
A)SSE
B)b0
C)MSE
D)b1
Unlock Deck
Unlock for access to all 140 flashcards in this deck.
Unlock Deck
k this deck
24
All of the following are assumptions of the error terms in the simple linear regression model except:
A)Errors are normally distributed.
B)Error terms have a mean of zero.
C)Error terms have a constant variance.
D)Error terms are dependent on each other.
A)Errors are normally distributed.
B)Error terms have a mean of zero.
C)Error terms have a constant variance.
D)Error terms are dependent on each other.
Unlock Deck
Unlock for access to all 140 flashcards in this deck.
Unlock Deck
k this deck
25
If the Durbin-Watson statistic is less than dL,then we conclude that:
A)There is significant positive autocorrelation.
B)There is significant negative autocorrelation.
C)There is significant autocorrelation,but we cannot identify whether it is positive or negative.
D)The test results are inconclusive.
A)There is significant positive autocorrelation.
B)There is significant negative autocorrelation.
C)There is significant autocorrelation,but we cannot identify whether it is positive or negative.
D)The test results are inconclusive.
Unlock Deck
Unlock for access to all 140 flashcards in this deck.
Unlock Deck
k this deck
26
For the same value of X (independent variable),the confidence interval for the average value of Y (dependent variable)is __________________ the prediction interval for the individual value of Y.
A)Larger than
B)Smaller than
C)The same as
D)Sometimes larger than,sometimes smaller than
A)Larger than
B)Smaller than
C)The same as
D)Sometimes larger than,sometimes smaller than
Unlock Deck
Unlock for access to all 140 flashcards in this deck.
Unlock Deck
k this deck
27
If the Durbin-Watson statistic is greater than (4 - dL),then we conclude that:
A)There is significant positive autocorrelation.
B)There is significant negative autocorrelation.
C)There is significant autocorrelation,but we cannot identify whether it is positive or negative.
D)The test result is inconclusive.
A)There is significant positive autocorrelation.
B)There is significant negative autocorrelation.
C)There is significant autocorrelation,but we cannot identify whether it is positive or negative.
D)The test result is inconclusive.
Unlock Deck
Unlock for access to all 140 flashcards in this deck.
Unlock Deck
k this deck
28
In simple regression analysis,the quantity is called the __________ sum of squares.
A)Total
B)Explained
C)Unexplained
D)Error
is called the __________ sum of squares.A)Total
B)Explained
C)Unexplained
D)Error
Unlock Deck
Unlock for access to all 140 flashcards in this deck.
Unlock Deck
k this deck
29
In simple regression analysis,the standard error is ___________ greater than the standard deviation of y values.
A)Always
B)Sometimes
C)Never
A)Always
B)Sometimes
C)Never
Unlock Deck
Unlock for access to all 140 flashcards in this deck.
Unlock Deck
k this deck
30
If successive values of the residuals are close together,then there is a ___________ autocorrelation,and the value of the Durbin-Watson statistic is _________.
A)Negative,large
B)Positive,small
C)Negative,small
D)Positive,large
A)Negative,large
B)Positive,small
C)Negative,small
D)Positive,large
Unlock Deck
Unlock for access to all 140 flashcards in this deck.
Unlock Deck
k this deck
31
The ___________ ther2,and the __________ thes (standard error),the stronger the relationship between the dependent variable and the independent variable.
A)Higher,lower
B)Lower,higher
C)Lower,lower
D)Higher,higher
A)Higher,lower
B)Lower,higher
C)Lower,lower
D)Higher,higher
Unlock Deck
Unlock for access to all 140 flashcards in this deck.
Unlock Deck
k this deck
32
The Durbin-Watson test statistic ranges from:
A)-4 to 4
B)0 to 4
C)0 to 3
D)-1 to 1
E)0 to 1
A)-4 to 4
B)0 to 4
C)0 to 3
D)-1 to 1
E)0 to 1
Unlock Deck
Unlock for access to all 140 flashcards in this deck.
Unlock Deck
k this deck
33
In a simple linear regression analysis,the correlation coefficient (a)and the slope (b)___________ have the same sign.
A)Always
B)Sometimes
C)Never
A)Always
B)Sometimes
C)Never
Unlock Deck
Unlock for access to all 140 flashcards in this deck.
Unlock Deck
k this deck
34
When using simple linear regression,we would like to use confidence intervals for the ___________ and prediction intervals for the ___________ at a given value of x.
A)individual y-value,mean y-value
B)Mean y-value,individual y-value
C)Slope,mean slope
D)y-intercept,mean y-intercept
A)individual y-value,mean y-value
B)Mean y-value,individual y-value
C)Slope,mean slope
D)y-intercept,mean y-intercept
Unlock Deck
Unlock for access to all 140 flashcards in this deck.
Unlock Deck
k this deck
35
The _____________ measures the strength of the linear relationship between the dependent variable and the independent variable.
A)Correlation coefficient
B)Distance value
C)Y-Intercept
D)Residual
A)Correlation coefficient
B)Distance value
C)Y-Intercept
D)Residual
Unlock Deck
Unlock for access to all 140 flashcards in this deck.
Unlock Deck
k this deck
36
What value of the Durbin-Watson statistic indicates that there is no autocorrelation present in time-ordered data?
A)1
B)-1
C)2
D)-2
E)0
A)1
B)-1
C)2
D)-2
E)0
Unlock Deck
Unlock for access to all 140 flashcards in this deck.
Unlock Deck
k this deck
37
Which of the following is a violation of one of the major assumptions of the simple regression model?
A)The error terms are independent of each other.
B)A histogram of the residuals forms a bell-shaped,symmetrical curve.
C)The error terms show no pattern.
D)As the value of x increases,the value of the error term also increases.
A)The error terms are independent of each other.
B)A histogram of the residuals forms a bell-shaped,symmetrical curve.
C)The error terms show no pattern.
D)As the value of x increases,the value of the error term also increases.
Unlock Deck
Unlock for access to all 140 flashcards in this deck.
Unlock Deck
k this deck
38
The correlation coefficient may assume any value between:
A)0 and 1.
B)-∞ and ∞.
C)0 and 8.
D)-1,and 1.
E)-1,and 0.
A)0 and 1.
B)-∞ and ∞.
C)0 and 8.
D)-1,and 1.
E)-1,and 0.
Unlock Deck
Unlock for access to all 140 flashcards in this deck.
Unlock Deck
k this deck
39
A simple regression analysis with 20 observations would yield ________ degrees of freedom error and _________ degrees of freedom total.
A)1,20
B)18,19
C)19,20
D)1,19
E)18,20
A)1,20
B)18,19
C)19,20
D)1,19
E)18,20
Unlock Deck
Unlock for access to all 140 flashcards in this deck.
Unlock Deck
k this deck
40
In simple regression analysis,the quantity that gives the amount by which Y (dependent variable)changes for a unit change in X (independent variable)is called the:
A)Coefficient of determination.
B)Slope of the regression line.
C)Y-intercept of the regression line.
D)Correlation coefficient.
E)Standard error.
A)Coefficient of determination.
B)Slope of the regression line.
C)Y-intercept of the regression line.
D)Correlation coefficient.
E)Standard error.
Unlock Deck
Unlock for access to all 140 flashcards in this deck.
Unlock Deck
k this deck
41
In a simple linear regression model,the slope term is the change in the mean value of y associated with _____________ in x.
A)a corresponding increase
B)a variable change
C)no change
D)a one-unit increase
A)a corresponding increase
B)a variable change
C)no change
D)a one-unit increase
Unlock Deck
Unlock for access to all 140 flashcards in this deck.
Unlock Deck
k this deck
42
The ___________ of the simple linear regression model is the value of y when the mean value of x is zero.
A)y-intercept
B)slope
C)independent variable
D)response variable
A)y-intercept
B)slope
C)independent variable
D)response variable
Unlock Deck
Unlock for access to all 140 flashcards in this deck.
Unlock Deck
k this deck
43
The ____________ assumption requires that all variation around the regression line should be equal at all possible values (levels)of the independent variable.
A)Normality
B)Control variation
C)Constant variance
D)Independence
A)Normality
B)Control variation
C)Constant variance
D)Independence
Unlock Deck
Unlock for access to all 140 flashcards in this deck.
Unlock Deck
k this deck
44
The _____________ is the range of the previously observed values of x.
A)Population region
B)Experimental region
C)Slope
D)Coefficient of determination
A)Population region
B)Experimental region
C)Slope
D)Coefficient of determination
Unlock Deck
Unlock for access to all 140 flashcards in this deck.
Unlock Deck
k this deck
45
When the constant variance assumption holds,a plot of the residual versus x:
A)Fans out.
B)Funnels in.
C)Fans out,but then funnels in.
D)Forms a horizontal band pattern.
E)Suggests an increasing error variance.
A)Fans out.
B)Funnels in.
C)Fans out,but then funnels in.
D)Forms a horizontal band pattern.
E)Suggests an increasing error variance.
Unlock Deck
Unlock for access to all 140 flashcards in this deck.
Unlock Deck
k this deck
46
The simple linear regression (least squares method)minimizes:
A)The explained variation.
B)SSyy.
C)Total variation.
D)SSxx.
E)SSE.
A)The explained variation.
B)SSyy.
C)Total variation.
D)SSxx.
E)SSE.
Unlock Deck
Unlock for access to all 140 flashcards in this deck.
Unlock Deck
k this deck
47
In a simple linear regression model,the intercept term is the mean value of y when x equals _____.
A)1
B)0
C)-1
D)y
A)1
B)0
C)-1
D)y
Unlock Deck
Unlock for access to all 140 flashcards in this deck.
Unlock Deck
k this deck
48
If there is significant autocorrelation present in a data set,the ________________ assumption is violated.
A)Normality
B)Independence of error terms
C)μ = 0
D)Constant variation
A)Normality
B)Independence of error terms
C)μ = 0
D)Constant variation
Unlock Deck
Unlock for access to all 140 flashcards in this deck.
Unlock Deck
k this deck
49
In simple regression analysis,if the correlation coefficient is a positive value,then:
A)The Y intercept must also be a positive value.
B)The coefficient of determination can be either positive or negative,depending on the value of the slope.
C)The least squares regression equation could either have a positive or a negative slope.
D)The slope of the regression line must also be positive.
E)The standard error of estimate can have either a positive or a negative value.
Unlock Deck
Unlock for access to all 140 flashcards in this deck.
Unlock Deck
k this deck
50
In a simple regression analysis for a given data set,if the null hypothesis β = 0 is rejected,then the null hypothesis ρ = 0 is also rejected.This statement is ___________ true.
A)Always
B)Never
C)Sometimes
A)Always
B)Never
C)Sometimes
Unlock Deck
Unlock for access to all 140 flashcards in this deck.
Unlock Deck
k this deck
51
The following results were obtained as part of a simple regression analysis: The null hypothesis of no linear relationship between the dependent variable and the independent variable:
A)Is rejected.
B)Cannot be tested with the given information.
C)Is not rejected.
D)Is not an appropriate null hypothesis for this situation.
The null hypothesis of no linear relationship between the dependent variable and the independent variable:A)Is rejected.
B)Cannot be tested with the given information.
C)Is not rejected.
D)Is not an appropriate null hypothesis for this situation.
Unlock Deck
Unlock for access to all 140 flashcards in this deck.
Unlock Deck
k this deck
52
Any value of the error term in a regression model _____________ any other value of the error term.
A)Increases with
B)Is dependent on
C)Is independent of
D)Is exactly the same as
A)Increases with
B)Is dependent on
C)Is independent of
D)Is exactly the same as
Unlock Deck
Unlock for access to all 140 flashcards in this deck.
Unlock Deck
k this deck
53
The range for r2 is between 0 and 1,and the range for r is between ____________.
A)0 and 1
B)-1 and 1
C)-1 and 0
D)no limit
A)0 and 1
B)-1 and 1
C)-1 and 0
D)no limit
Unlock Deck
Unlock for access to all 140 flashcards in this deck.
Unlock Deck
k this deck
54
The strength of the relationship between two quantitative variables can be measured by:
A)The slope of a simple linear regression equation.
B)The Y-intercept of the simple linear regression equation.
C)The coefficient of correlation.
D)The coefficient of determination.
E)Both the coefficient of correlation and the coefficient of determination.
A)The slope of a simple linear regression equation.
B)The Y-intercept of the simple linear regression equation.
C)The coefficient of correlation.
D)The coefficient of determination.
E)Both the coefficient of correlation and the coefficient of determination.
Unlock Deck
Unlock for access to all 140 flashcards in this deck.
Unlock Deck
k this deck
55
For the same set of observations on a specified dependent variable,two different independent variables were used to develop two separate simple linear regression models.A portion of the results is presented below. Based on the results given above,we can conclude that:
A)A prediction based on Model 1 is better than a prediction based on Model 2.
B)A prediction based on Model 2 is better than a prediction based on Model 1.
C)There is no difference in the predictive ability between Model 1 and Model 2.
D)There is not sufficient information to determine which of the two models is superior for prediction purposes.
Based on the results given above,we can conclude that:A)A prediction based on Model 1 is better than a prediction based on Model 2.
B)A prediction based on Model 2 is better than a prediction based on Model 1.
C)There is no difference in the predictive ability between Model 1 and Model 2.
D)There is not sufficient information to determine which of the two models is superior for prediction purposes.
Unlock Deck
Unlock for access to all 140 flashcards in this deck.
Unlock Deck
k this deck
56
The coefficient of determination measures the _____________ explained by the simple linear regression model.
A)Correlation
B)Proportion of variation
C)Standard error
D)Mean square error
A)Correlation
B)Proportion of variation
C)Standard error
D)Mean square error
Unlock Deck
Unlock for access to all 140 flashcards in this deck.
Unlock Deck
k this deck
57
Which of the following is a violation of the independence assumption?
A)Negative autocorrelation
B)A pattern of cyclical error terms over time
C)Positive autocorrelation
D)A pattern of alternating error terms over time
E)All of these
A)Negative autocorrelation
B)A pattern of cyclical error terms over time
C)Positive autocorrelation
D)A pattern of alternating error terms over time
E)All of these
Unlock Deck
Unlock for access to all 140 flashcards in this deck.
Unlock Deck
k this deck
58
For a given data set,specific value of X,and confidence level,if all the other factors are constant,the confidence interval for the mean value of Y will ___________ be wider than the corresponding prediction interval for the individual value of Y.
A)Always
B)Sometimes
C)Never
A)Always
B)Sometimes
C)Never
Unlock Deck
Unlock for access to all 140 flashcards in this deck.
Unlock Deck
k this deck
59
After plotting the data points on a scatter diagram,we have observed an inverse relationship between the independent variable (X)and the dependent variable (Y).Therefore,we can expect both the sample ___________ and the sample _____________ to be negative values.
A)Intercept,slope
B)Slope,coefficient of determination
C)Intercept,correlation coefficient
D)Slope,correlation coefficient
E)Slope,standard error of estimate
A)Intercept,slope
B)Slope,coefficient of determination
C)Intercept,correlation coefficient
D)Slope,correlation coefficient
E)Slope,standard error of estimate
Unlock Deck
Unlock for access to all 140 flashcards in this deck.
Unlock Deck
k this deck
60
The least squares point estimates of the simple linear regression model minimize the ____________.
A)SS Error
B)Total variance
C)MS Error
D)Explained variance
A)SS Error
B)Total variance
C)MS Error
D)Explained variance
Unlock Deck
Unlock for access to all 140 flashcards in this deck.
Unlock Deck
k this deck
61
An experiment was performed on a certain metal to determine if the strength is a function of heating time.Results based on 10 metal sheets are given below.Use the simple linear regression model. Determine the standard error.
Determine the standard error. Unlock Deck
Unlock for access to all 140 flashcards in this deck.
Unlock Deck
k this deck
62
The following results were obtained from a simple regression analysis:
Ŷ = 37.2895 - 1.2024X
r2 = .6744 sb = .2934
When X (independent variable)is equal to zero,what is the estimated value of Y (dependent variable)?
Ŷ = 37.2895 - 1.2024X
r2 = .6744 sb = .2934
When X (independent variable)is equal to zero,what is the estimated value of Y (dependent variable)?
Unlock Deck
Unlock for access to all 140 flashcards in this deck.
Unlock Deck
k this deck
63
If one of the assumptions of the regression model is violated,performing data transformations on the ____________ can remedy the situation.
A)independent variable
B)slope
C)predictor variable
D)response variable
A)independent variable
B)slope
C)predictor variable
D)response variable
Unlock Deck
Unlock for access to all 140 flashcards in this deck.
Unlock Deck
k this deck
64
The _____ distribution is used for testing the significance of the slope term.
A)t
B)z
C)r
D)r2
A)t
B)z
C)r
D)r2
Unlock Deck
Unlock for access to all 140 flashcards in this deck.
Unlock Deck
k this deck
65
An experiment was performed on a certain metal to determine if the strength is a function of heating time.Results based on 10 metal sheets are given below.Use the simple linear regression model. Calculate the correlation coefficient.
Calculate the correlation coefficient. Unlock Deck
Unlock for access to all 140 flashcards in this deck.
Unlock Deck
k this deck
66
An experiment was performed on a certain metal to determine if the strength is a function of heating time.Results based on 10 metal sheets are given below.Use the simple linear regression model. Determine SSE and SS(Total).
Determine SSE and SS(Total). Unlock Deck
Unlock for access to all 140 flashcards in this deck.
Unlock Deck
k this deck
67
The following results were obtained from a simple regression analysis:
Ŷ = 37.2895 - (1.2024)X
r2 = .6744sb = .2934
What is the proportion of the variation explained by the simple linear regression model?
Ŷ = 37.2895 - (1.2024)X
r2 = .6744sb = .2934
What is the proportion of the variation explained by the simple linear regression model?
Unlock Deck
Unlock for access to all 140 flashcards in this deck.
Unlock Deck
k this deck
68
The following results were obtained from a simple regression analysis:
Ŷ = 37.2895 - 1.2024X
r2 = .6744 sb = .2934
For each unit change in X (independent variable),what is the estimated change in Y (dependent variable)?
Ŷ = 37.2895 - 1.2024X
r2 = .6744 sb = .2934
For each unit change in X (independent variable),what is the estimated change in Y (dependent variable)?
Unlock Deck
Unlock for access to all 140 flashcards in this deck.
Unlock Deck
k this deck
69
A ______________________ measures the strength of the relationship between a dependent variable (Y)and an independent variable (X).
A)Coefficient of determination
B)Correlation coefficient
C)Slope
D)Standard error
A)Coefficient of determination
B)Correlation coefficient
C)Slope
D)Standard error
Unlock Deck
Unlock for access to all 140 flashcards in this deck.
Unlock Deck
k this deck
70
An experiment was performed on a certain metal to determine if the strength is a function of heating time.The simple linear regression equation is The time is in minutes and the strength is measured in pounds per square inch.The 95 percent confidence interval for the slope is from .564 to 1.436.Can we reject β1 = 0?
The time is in minutes and the strength is measured in pounds per square inch.The 95 percent confidence interval for the slope is from .564 to 1.436.Can we reject β1 = 0? Unlock Deck
Unlock for access to all 140 flashcards in this deck.
Unlock Deck
k this deck
71
An experiment was performed on a certain metal to determine if the strength is a function of heating time.The sample size consists of 10 metal sheets.The simple linear regression equation is The time is in minutes and the strength is measured in pounds per square inch.One of the 10 metal sheets was heated for 4 minutes and the resulting strength was 6 lbs.per square inch.Calculate the value of the residual for this observation.
The time is in minutes and the strength is measured in pounds per square inch.One of the 10 metal sheets was heated for 4 minutes and the resulting strength was 6 lbs.per square inch.Calculate the value of the residual for this observation. Unlock Deck
Unlock for access to all 140 flashcards in this deck.
Unlock Deck
k this deck
72
An experiment was performed on a certain metal to determine if the strength is a function of heating time.Results based on 10 metal sheets are given below. Using the simple linear regression model,find the estimated y-intercept.
Using the simple linear regression model,find the estimated y-intercept. Unlock Deck
Unlock for access to all 140 flashcards in this deck.
Unlock Deck
k this deck
73
An experiment was performed on a certain metal to determine if the strength is a function of heating time.Results based on 10 metal sheets are given below. Using the simple linear regression model,find the estimated y-intercept and slope and write the equation of the least squares regression line.
Using the simple linear regression model,find the estimated y-intercept and slope and write the equation of the least squares regression line. Unlock Deck
Unlock for access to all 140 flashcards in this deck.
Unlock Deck
k this deck
74
An experiment was performed on a certain metal to determine if the strength is a function of heating time.Results based on 10 metal sheets are given below.Use the simple linear regression model. Calculate the coefficient of determination.
Calculate the coefficient of determination. Unlock Deck
Unlock for access to all 140 flashcards in this deck.
Unlock Deck
k this deck
75
An experiment was performed on a certain metal to determine if the strength is a function of heating time.Results based on 10 metal sheets are given below.Use the simple linear regression model. Determine the value of the F statistic.
Determine the value of the F statistic. Unlock Deck
Unlock for access to all 140 flashcards in this deck.
Unlock Deck
k this deck
76
An experiment was performed on a certain metal to determine if the strength is a function of heating time.Partial results based on a sample of 10 metal sheets are given below.The simple linear regression equation is The time is in minutes,the strength is measured in pounds per square inch,MSE = 0.5, Determine the 95 percent confidence interval for the mean value of metal strength when the average heating time is 4 minutes.
The time is in minutes,the strength is measured in pounds per square inch,MSE = 0.5, Determine the 95 percent confidence interval for the mean value of metal strength when the average heating time is 4 minutes. Unlock Deck
Unlock for access to all 140 flashcards in this deck.
Unlock Deck
k this deck
77
Use the following results obtained from a simple linear regression analysis with 12 observations. Test to determine if there is a significant negative relationship between the independent and dependent variables at α = .05.Give the test statistic and the resulting conclusion.
Test to determine if there is a significant negative relationship between the independent and dependent variables at α = .05.Give the test statistic and the resulting conclusion. Unlock Deck
Unlock for access to all 140 flashcards in this deck.
Unlock Deck
k this deck
78
The ____________________ is the proportion of the total variation in the dependent variable explained by the regression model.
A)Coefficient of determination
B)Correlation coefficient
C)Slope
D)Standard error
A)Coefficient of determination
B)Correlation coefficient
C)Slope
D)Standard error
Unlock Deck
Unlock for access to all 140 flashcards in this deck.
Unlock Deck
k this deck
79
An experiment was performed on a certain metal to determine if the strength is a function of heating time.Results based on 10 metal sheets are given below.Use the simple linear regression model. Find the t statistic and test H0: b1 ≤ 0 vs.Ha: b1> 0 at α = .05.
Find the t statistic and test H0: b1 ≤ 0 vs.Ha: b1> 0 at α = .05. Unlock Deck
Unlock for access to all 140 flashcards in this deck.
Unlock Deck
k this deck
80
An experiment was performed on a certain metal to determine if the strength is a function of heating time.Results based on 10 metal sheets are given below.Use the simple linear regression model. Calculate the 95 percent confidence interval for the slope.
Calculate the 95 percent confidence interval for the slope. Unlock Deck
Unlock for access to all 140 flashcards in this deck.
Unlock Deck
k this deck
Unlock Deck
Unlock for access to all 140 flashcards in this deck.


