Exam 13: Simple Linear Regression Analysis
Exam 1: An Introduction to Business Statistics63 Questions
Exam 2: Descriptive Statistics: Tabular and Graphical Methods100 Questions
Exam 3: Descriptive Statistics: Numerical Methods141 Questions
Exam 4: Probability127 Questions
Exam 5: Discrete Random Variables150 Questions
Exam 6: Continuous Random Variables145 Questions
Exam 7: Sampling and Sampling Distributions131 Questions
Exam 8: Confidence Intervals149 Questions
Exam 9: Hypothesis Testing150 Questions
Exam 10: Statistical Inferences Based on Two Samples139 Questions
Exam 11: Experimental Design and Analysis of Variance98 Questions
Exam 12: Chi-Square Tests112 Questions
Exam 13: Simple Linear Regression Analysis140 Questions
Exam 14: Multiple Regression and Model Building150 Questions
Exam 15: Process Improvement Using Control Charts117 Questions
Select questions type
If the Durbin-Watson statistic is greater than (4 - dL),then we conclude that:
Free
(Multiple Choice)
4.8/5  (38)
(38)
Correct Answer: Verified
B
Which of the following is a violation of the independence assumption?
Free
(Multiple Choice)
4.9/5 (36)
Correct Answer:Verified
E
Based on 30 time-ordered observations from a simple regression,we have determined the Durbin-Watson statistic,d = 2.71.At α = .05,test to determine if there is any evidence of negative autocorrelation.State your conclusions.
Free
(Essay)
4.9/5 (30)
Correct Answer:Verified
Yes,there is evidence of negative autocorrelation,because 2.71 > 2.65.
A simple regression analysis with 20 observations would yield ________ degrees of freedom error and _________ degrees of freedom total.
(Multiple Choice)
5.0/5 (41)
Consider the following partial computer output from a simple linear regression analysis. 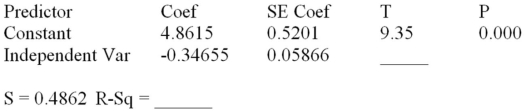 Analysis of Variance
 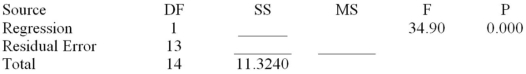 What is the unexplained variance?
(Short Answer)
4.9/5 (35)
The dependent variable is the variable that is being described,predicted,or controlled.
(True/False)
4.8/5 (43)
A local tire dealer wants to predict the number of tires sold each month.He believes that the number of tires sold is a linear function of the amount of money invested in advertising.He randomly selects 6 months of data consisting of monthly tire sales (in thousands of tires)and monthly advertising expenditures (in thousands of dollars).Residuals are calculated for all of the randomly selected six months and ordered from smallest to largest.Determine the normal score for the smallest residual.
(Short Answer)
4.8/5 (34)
Which of the following is a violation of one of the major assumptions of the simple regression model?
(Multiple Choice)
4.8/5 (31)
Consider the following partial computer output from a simple linear regression analysis.  Analysis of Variance
 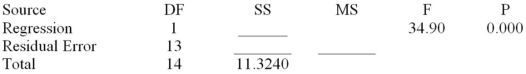 Test H0: β1 = 0 versus Ha: β1 ≠ 0 by setting α = .001.What do you conclude about the relationship between y and x?
(Essay)
4.8/5 (42)
Consider the following partial computer output from a simple linear regression analysis.  Analysis of Variance
  Determine the 95 percent confidence interval for the mean value of y when x = 9.00.Givens: ∑x = 129.03 and ∑x2 = 1178.547
(Short Answer)
4.7/5 (39)
An experiment was performed on a certain metal to determine if the strength is a function of heating time.Results based on 10 metal sheets are given below. 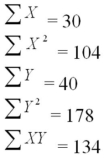 Using the simple linear regression model,find the estimated y-intercept and slope and write the equation of the least squares regression line.
(Short Answer)
4.9/5 (38)
If the Durbin-Watson statistic is less than dL,then we conclude that:
(Multiple Choice)
4.7/5 (42)
All of the following are assumptions of the error terms in the simple linear regression model except:
(Multiple Choice)
4.7/5 (35)
Consider the following partial computer output from a simple linear regression analysis. 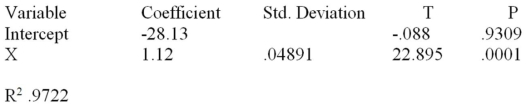 What is the estimated slope?
(Short Answer)
4.7/5 (25)
The range for r2 is between 0 and 1,and the range for r is between ____________.
(Multiple Choice)
4.8/5 (42)
Consider the following partial computer output from a simple linear regression analysis. 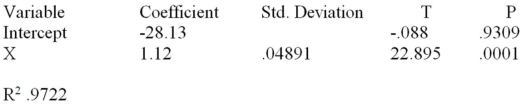 What is the predicted value of y when x = 1,000?
(Short Answer)
4.9/5 (37)
Consider the following partial computer output from a simple linear regression analysis.  Analysis of Variance
  Determine the 95 percent prediction interval for the mean value of y when x = 9.00.Givens: ∑x = 129.03,∑x2 = 1178.547
(Short Answer)
4.9/5 (36)
The following results were obtained from a simple regression analysis:
Ŷ = 37.2895 - 1.2024X
r2 = .6744 sb = .2934
When X (independent variable)is equal to zero,what is the estimated value of Y (dependent variable)?
(Short Answer)
4.8/5 (31)
Complete the following partial ANOVA table from a simple linear regression analysis with a sample size of 16 observations.Find the F statistic to test the significance of the model. 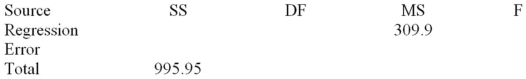
(Essay)
4.9/5 (29)
A simple linear regression model is an equation that describes the straight-line relationship between a dependent variable and an independent variable.
(True/False)
4.8/5 (34)
Filters
- Essay(0)
- Multiple Choice(0)
- Short Answer(0)
- True False(0)
- Matching(0)