Deck 12: Comparing Multiple Proportions, Test of Independence and Goodness of Fit
Full screen (f)
Question
Exhibit 12-2
Last school year, the student body of a local university consisted of 30% freshmen, 24% sophomores, 26% juniors, and 20% seniors. A sample of 300 students taken from this year's student body showed the following number of students in each classification. We are interested in determining whether or not there has been a significant change in the classifications between the last school year and this school year.
Refer to Exhibit 12-2. The expected number of freshmen is
A)83
B)90
C)30
D)10
Last school year, the student body of a local university consisted of 30% freshmen, 24% sophomores, 26% juniors, and 20% seniors. A sample of 300 students taken from this year's student body showed the following number of students in each classification.
We are interested in determining whether or not there has been a significant change in the classifications between the last school year and this school year.Refer to Exhibit 12-2. The expected number of freshmen is
A)83
B)90
C)30
D)10
Question
Question
Question
Question
Exhibit 12-1
When individuals in a sample of 150 were asked whether or not they supported capital punishment, the following information was obtained. We are interested in determining whether or not the opinions of the individuals (as to Yes, No, and No Opinion) are uniformly distributed.
Refer to Exhibit 12-1. The p-value is
A)larger than 0.1
B)less than 0.1
C)less than 0.05
D)larger than 0.9
When individuals in a sample of 150 were asked whether or not they supported capital punishment, the following information was obtained.
We are interested in determining whether or not the opinions of the individuals (as to Yes, No, and No Opinion) are uniformly distributed.Refer to Exhibit 12-1. The p-value is
A)larger than 0.1
B)less than 0.1
C)less than 0.05
D)larger than 0.9
Question
Exhibit 12-2
Last school year, the student body of a local university consisted of 30% freshmen, 24% sophomores, 26% juniors, and 20% seniors. A sample of 300 students taken from this year's student body showed the following number of students in each classification. We are interested in determining whether or not there has been a significant change in the classifications between the last school year and this school year.
Refer to Exhibit 12-2. The expected frequency of seniors is
A)60
B)20%
C)68
D)64
Last school year, the student body of a local university consisted of 30% freshmen, 24% sophomores, 26% juniors, and 20% seniors. A sample of 300 students taken from this year's student body showed the following number of students in each classification.
We are interested in determining whether or not there has been a significant change in the classifications between the last school year and this school year.Refer to Exhibit 12-2. The expected frequency of seniors is
A)60
B)20%
C)68
D)64
Question
Question
Question
Exhibit 12-1
When individuals in a sample of 150 were asked whether or not they supported capital punishment, the following information was obtained. We are interested in determining whether or not the opinions of the individuals (as to Yes, No, and No Opinion) are uniformly distributed.
Refer to Exhibit 12-1. The number of degrees of freedom associated with this problem is
A)150
B)149
C)2
D)3
When individuals in a sample of 150 were asked whether or not they supported capital punishment, the following information was obtained.
We are interested in determining whether or not the opinions of the individuals (as to Yes, No, and No Opinion) are uniformly distributed.Refer to Exhibit 12-1. The number of degrees of freedom associated with this problem is
A)150
B)149
C)2
D)3
Question
Question
Question
Question
Question
Question
Exhibit 12-1
When individuals in a sample of 150 were asked whether or not they supported capital punishment, the following information was obtained. We are interested in determining whether or not the opinions of the individuals (as to Yes, No, and No Opinion) are uniformly distributed.
Refer to Exhibit 12-1. The calculated value for the test statistic equals
A)2
B)-2
C)20
D)4
When individuals in a sample of 150 were asked whether or not they supported capital punishment, the following information was obtained.
We are interested in determining whether or not the opinions of the individuals (as to Yes, No, and No Opinion) are uniformly distributed.Refer to Exhibit 12-1. The calculated value for the test statistic equals
A)2
B)-2
C)20
D)4
Question
Question
Question
Exhibit 12-1
When individuals in a sample of 150 were asked whether or not they supported capital punishment, the following information was obtained. We are interested in determining whether or not the opinions of the individuals (as to Yes, No, and No Opinion) are uniformly distributed.
Refer to Exhibit 12-1. The conclusion of the test (at 95% confidence) is that the
A)distribution is uniform
B)distribution is not uniform
C)test is inconclusive
D)None of these alternatives is correct.
When individuals in a sample of 150 were asked whether or not they supported capital punishment, the following information was obtained.
We are interested in determining whether or not the opinions of the individuals (as to Yes, No, and No Opinion) are uniformly distributed.Refer to Exhibit 12-1. The conclusion of the test (at 95% confidence) is that the
A)distribution is uniform
B)distribution is not uniform
C)test is inconclusive
D)None of these alternatives is correct.
Question
Question
Exhibit 12-1
When individuals in a sample of 150 were asked whether or not they supported capital punishment, the following information was obtained. We are interested in determining whether or not the opinions of the individuals (as to Yes, No, and No Opinion) are uniformly distributed.
Refer to Exhibit 12-1. The expected frequency for each group is
A)0.333
B)0.50
C)1/3
D)50
When individuals in a sample of 150 were asked whether or not they supported capital punishment, the following information was obtained.
We are interested in determining whether or not the opinions of the individuals (as to Yes, No, and No Opinion) are uniformly distributed.Refer to Exhibit 12-1. The expected frequency for each group is
A)0.333
B)0.50
C)1/3
D)50
Question
Question
Exhibit 12-2
Last school year, the student body of a local university consisted of 30% freshmen, 24% sophomores, 26% juniors, and 20% seniors. A sample of 300 students taken from this year's student body showed the following number of students in each classification. We are interested in determining whether or not there has been a significant change in the classifications between the last school year and this school year.
Refer to Exhibit 12-2. The p-value is
A)less than .005
B)between .025 and 0.05
C)between .05 and 0.1
D)greater than 0.1
Last school year, the student body of a local university consisted of 30% freshmen, 24% sophomores, 26% juniors, and 20% seniors. A sample of 300 students taken from this year's student body showed the following number of students in each classification.
We are interested in determining whether or not there has been a significant change in the classifications between the last school year and this school year.Refer to Exhibit 12-2. The p-value is
A)less than .005
B)between .025 and 0.05
C)between .05 and 0.1
D)greater than 0.1
Question
Exhibit 12-3
In order to determine whether or not a particular medication was effective in curing the common cold, one group of patients was given the medication, while another group received sugar pills. The results of the study are shown below. We are interested in determining whether or not the medication was effective in curing the common cold.
Refer to Exhibit 12-3. The hypothesis is to be tested at the 5% level of significance. The critical value from the table equals
A)3.84
B)7.81
C)5.99
D)9.34
In order to determine whether or not a particular medication was effective in curing the common cold, one group of patients was given the medication, while another group received sugar pills. The results of the study are shown below.
We are interested in determining whether or not the medication was effective in curing the common cold.Refer to Exhibit 12-3. The hypothesis is to be tested at the 5% level of significance. The critical value from the table equals
A)3.84
B)7.81
C)5.99
D)9.34
Question
Question
Question
Exhibit 12-6
The owner of a car wash wants to see if the arrival rate of cars follows a Poisson distribution. In order to test the assumption of a Poisson distribution, a random sample of 150 ten-minute intervals was taken. You are given the following observed frequencies: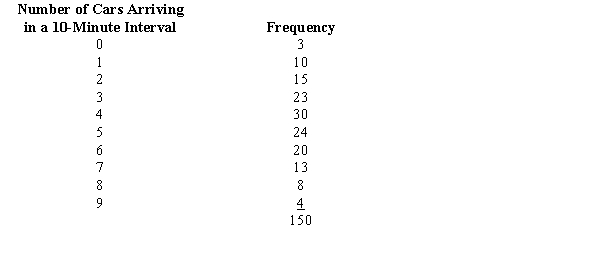
Refer to Exhibit 12-6. The calculated value for the test statistic equals
A)-0.18
B)0.18
C)1.72
D)2.89
Question
Exhibit 12-3
In order to determine whether or not a particular medication was effective in curing the common cold, one group of patients was given the medication, while another group received sugar pills. The results of the study are shown below. We are interested in determining whether or not the medication was effective in curing the common cold.
Refer to Exhibit 12-3. The expected frequency of those who received medication and were cured is
A)70
B)150
C)28
D)48
In order to determine whether or not a particular medication was effective in curing the common cold, one group of patients was given the medication, while another group received sugar pills. The results of the study are shown below.
We are interested in determining whether or not the medication was effective in curing the common cold.Refer to Exhibit 12-3. The expected frequency of those who received medication and were cured is
A)70
B)150
C)28
D)48
Question
Exhibit 12-3
In order to determine whether or not a particular medication was effective in curing the common cold, one group of patients was given the medication, while another group received sugar pills. The results of the study are shown below. We are interested in determining whether or not the medication was effective in curing the common cold.
Refer to Exhibit 12-3. The number of degrees of freedom associated with this problem is
A)4
B)149
C)1
D)3
In order to determine whether or not a particular medication was effective in curing the common cold, one group of patients was given the medication, while another group received sugar pills. The results of the study are shown below.
We are interested in determining whether or not the medication was effective in curing the common cold.Refer to Exhibit 12-3. The number of degrees of freedom associated with this problem is
A)4
B)149
C)1
D)3
Question
Exhibit 12-5
The table below gives beverage preferences for random samples of teens and adults.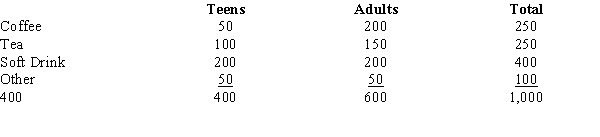 We are asked to test for independence between age (i.e., adult and teen) and drink preferences.
Refer to Exhibit 12-5. The test statistic for this test of independence is
A)0
B)8.4
C)62.5
D)82.5
The table below gives beverage preferences for random samples of teens and adults.
We are asked to test for independence between age (i.e., adult and teen) and drink preferences.Refer to Exhibit 12-5. The test statistic for this test of independence is
A)0
B)8.4
C)62.5
D)82.5
Question
Question
Exhibit 12-3
In order to determine whether or not a particular medication was effective in curing the common cold, one group of patients was given the medication, while another group received sugar pills. The results of the study are shown below. We are interested in determining whether or not the medication was effective in curing the common cold.
Refer to Exhibit 12-3. The test statistic is
A)10.08
B)54.02
C)1.96
D)1.645
In order to determine whether or not a particular medication was effective in curing the common cold, one group of patients was given the medication, while another group received sugar pills. The results of the study are shown below.
We are interested in determining whether or not the medication was effective in curing the common cold.Refer to Exhibit 12-3. The test statistic is
A)10.08
B)54.02
C)1.96
D)1.645
Question
Exhibit 12-6
The owner of a car wash wants to see if the arrival rate of cars follows a Poisson distribution. In order to test the assumption of a Poisson distribution, a random sample of 150 ten-minute intervals was taken. You are given the following observed frequencies:
Refer to Exhibit 12-6. The expected frequency of exactly 3 cars arriving in a 10-minute interval is
A)0.1533
B)0.1743
C)23
D)26.145
Question
Exhibit 12-3
In order to determine whether or not a particular medication was effective in curing the common cold, one group of patients was given the medication, while another group received sugar pills. The results of the study are shown below. We are interested in determining whether or not the medication was effective in curing the common cold.
Refer to Exhibit 12-3. The p-value is
A)less than .005
B)between .005 and .01
C)between .01 and .025
D)between .025 and .05
In order to determine whether or not a particular medication was effective in curing the common cold, one group of patients was given the medication, while another group received sugar pills. The results of the study are shown below.
We are interested in determining whether or not the medication was effective in curing the common cold.Refer to Exhibit 12-3. The p-value is
A)less than .005
B)between .005 and .01
C)between .01 and .025
D)between .025 and .05
Question
Exhibit 12-2
Last school year, the student body of a local university consisted of 30% freshmen, 24% sophomores, 26% juniors, and 20% seniors. A sample of 300 students taken from this year's student body showed the following number of students in each classification. We are interested in determining whether or not there has been a significant change in the classifications between the last school year and this school year.
Refer to Exhibit 12-2. The calculated value for the test statistic equals
A)0.5444
B)300
C)1.6615
D)6.6615
Last school year, the student body of a local university consisted of 30% freshmen, 24% sophomores, 26% juniors, and 20% seniors. A sample of 300 students taken from this year's student body showed the following number of students in each classification.
We are interested in determining whether or not there has been a significant change in the classifications between the last school year and this school year.Refer to Exhibit 12-2. The calculated value for the test statistic equals
A)0.5444
B)300
C)1.6615
D)6.6615
Question
Exhibit 12-5
The table below gives beverage preferences for random samples of teens and adults. We are asked to test for independence between age (i.e., adult and teen) and drink preferences.
Refer to Exhibit 12-5. The expected number of adults who prefer coffee is
A)0.25
B)0.33
C)150
D)200
The table below gives beverage preferences for random samples of teens and adults.
We are asked to test for independence between age (i.e., adult and teen) and drink preferences.Refer to Exhibit 12-5. The expected number of adults who prefer coffee is
A)0.25
B)0.33
C)150
D)200
Question
Exhibit 12-5
The table below gives beverage preferences for random samples of teens and adults. We are asked to test for independence between age (i.e., adult and teen) and drink preferences.
Refer to Exhibit 12-5. The p-value is
A)between .1 and .05
B)between .05 and .025
C)between .025 and .01
D)less than 0.005
The table below gives beverage preferences for random samples of teens and adults.
We are asked to test for independence between age (i.e., adult and teen) and drink preferences.Refer to Exhibit 12-5. The p-value is
A)between .1 and .05
B)between .05 and .025
C)between .025 and .01
D)less than 0.005
Question
Exhibit 12-2
Last school year, the student body of a local university consisted of 30% freshmen, 24% sophomores, 26% juniors, and 20% seniors. A sample of 300 students taken from this year's student body showed the following number of students in each classification. We are interested in determining whether or not there has been a significant change in the classifications between the last school year and this school year.
Refer to Exhibit 12-2. At 95% confidence, the null hypothesis
A)should not be rejected
B)should be rejected
C)was designed wrong
D)None of these alternatives is correct.
Last school year, the student body of a local university consisted of 30% freshmen, 24% sophomores, 26% juniors, and 20% seniors. A sample of 300 students taken from this year's student body showed the following number of students in each classification.
We are interested in determining whether or not there has been a significant change in the classifications between the last school year and this school year.Refer to Exhibit 12-2. At 95% confidence, the null hypothesis
A)should not be rejected
B)should be rejected
C)was designed wrong
D)None of these alternatives is correct.
Question
Question
Question
Exhibit 12-5
The table below gives beverage preferences for random samples of teens and adults. We are asked to test for independence between age (i.e., adult and teen) and drink preferences.
Refer to Exhibit 12-5. With a .05 level of significance, the critical value for the test is
A)1.645
B)7.815
C)14.067
D)15.507
The table below gives beverage preferences for random samples of teens and adults.
We are asked to test for independence between age (i.e., adult and teen) and drink preferences.Refer to Exhibit 12-5. With a .05 level of significance, the critical value for the test is
A)1.645
B)7.815
C)14.067
D)15.507
Question
Prior to the start of the season, it was expected that audience proportions for the four major news networks would be CBS 28%, NBC 35%, ABC 22% and BBC 15%. A recent sample of homes yielded the following viewing audience data.  We want to determine whether or not the recent sample supports the expectations of the number of homes of the viewing audience of the four networks.
a.State the null and alternative hypotheses to be tested.
b.Compute the test statistic.
c.The null hypothesis is to be tested at 95% confidence. Determine the critical value for this test.
d.What do you conclude?
We want to determine whether or not the recent sample supports the expectations of the number of homes of the viewing audience of the four networks. a.State the null and alternative hypotheses to be tested.
b.Compute the test statistic.
c.The null hypothesis is to be tested at 95% confidence. Determine the critical value for this test.
d.What do you conclude?
Question
The results of a recent study regarding smoking and three types of illness are shown in the following table. 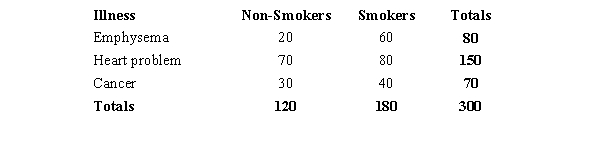 We are interested in determining whether or not illness is independent of smoking.
a.State the null and alternative hypotheses to be tested.
b.Show the contingency table of the expected frequencies.
c.Compute the test statistic.
d.The null hypothesis is to be tested at 95% confidence. Determine the critical value for this test. What do you conclude?
e.Determine the p-value and perform the test.
We are interested in determining whether or not illness is independent of smoking. a.State the null and alternative hypotheses to be tested.
b.Show the contingency table of the expected frequencies.
c.Compute the test statistic.
d.The null hypothesis is to be tested at 95% confidence. Determine the critical value for this test. What do you conclude?
e.Determine the p-value and perform the test.
Question
In the last presidential election, before the candidates started their major campaigns, the percentages of registered voters who favored the various candidates were as follows.  After the major campaigns began, a random sample of 400 voters showed that 172 favored the Republican candidate; 164 were in favor of the Democratic candidate; and 64 favored the Independent candidate. We are interested in determining whether the proportion of voters who favored the various candidates had changed.
a.Compute the test statistic.
b.Using the p-value approach, test to see if the proportions have changed.
c.Using the critical value approach, test the hypotheses.
After the major campaigns began, a random sample of 400 voters showed that 172 favored the Republican candidate; 164 were in favor of the Democratic candidate; and 64 favored the Independent candidate. We are interested in determining whether the proportion of voters who favored the various candidates had changed. a.Compute the test statistic.
b.Using the p-value approach, test to see if the proportions have changed.
c.Using the critical value approach, test the hypotheses.
Question
Exhibit 12-7
You want to test whether or not the following sample of 30 observations follows a normal distribution. The mean of the sample equals 11.83, and the standard deviation equals 4.53.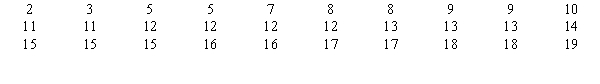
Refer to Exhibit 12-7. The calculated value for the test statistic equals
A)0
B)1.67
C)2
D)6
You want to test whether or not the following sample of 30 observations follows a normal distribution. The mean of the sample equals 11.83, and the standard deviation equals 4.53.
Refer to Exhibit 12-7. The calculated value for the test statistic equals
A)0
B)1.67
C)2
D)6
Question
Shoppers were asked where they do their regular grocery shopping. The table below shows the responses of the sampled shoppers. We are interested in determining if the proportions of females in the three categories are different from each other. 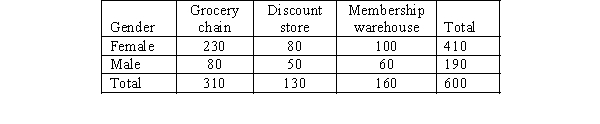
a.Provide the null and the alternative hypotheses.
b.Determine the expected frequencies.
c.Compute the sample proportions.
d.Compute the critical values (CVij).
e.Give your conclusions by providing numerical reasoning.
a.Provide the null and the alternative hypotheses.
b.Determine the expected frequencies.
c.Compute the sample proportions.
d.Compute the critical values (CVij).
e.Give your conclusions by providing numerical reasoning.
Question
Exhibit 12-7
You want to test whether or not the following sample of 30 observations follows a normal distribution. The mean of the sample equals 11.83, and the standard deviation equals 4.53.
Refer to Exhibit 12-7. The p-value is
A)greater than 0.1
B)between .05 and 0.1
C)between .025 and .05
D)between .01 and .025
Question
Exhibit 12-6
The owner of a car wash wants to see if the arrival rate of cars follows a Poisson distribution. In order to test the assumption of a Poisson distribution, a random sample of 150 ten-minute intervals was taken. You are given the following observed frequencies:
Refer to Exhibit 12-6. At 95% confidence, the conclusion of the test is that the
A)arrival of cars follows a Poisson distribution
B)arrival of cars does not follow a Poisson distribution
C)test is inconclusive
D)None of these alternatives is correct.
Question
Exhibit 12-8
The following shows the number of individuals in a sample of 300 who indicated they support the new tax proposal. We are interested in determining whether or not the opinions of the individuals of the three groups are uniformly distributed.
Refer to Exhibit 12-8. The expected frequency for each group is
A)0.333
B)0.50
C)50
D)None of these alternatives is correct.
The following shows the number of individuals in a sample of 300 who indicated they support the new tax proposal.
We are interested in determining whether or not the opinions of the individuals of the three groups are uniformly distributed.Refer to Exhibit 12-8. The expected frequency for each group is
A)0.333
B)0.50
C)50
D)None of these alternatives is correct.
Question
The following table shows the results of a study on smoking and three illnesses. We are interested in determining if the proportions smokers in the three categories are different from each other.
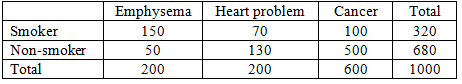
a.Provide the null and the alternative hypotheses.
b.Determine the expected frequencies.
c.Compute the sample proportions.
d.Compute the critical values (CVij).
e.Give your conclusions by providing numerical reasoning.
a.Provide the null and the alternative hypotheses.
b.Determine the expected frequencies.
c.Compute the sample proportions.
d.Compute the critical values (CVij).
e.Give your conclusions by providing numerical reasoning.
Question
From a poll of 800 television viewers, the following data have been accumulated as to their levels of education and their preference of television stations. We are interested in determining if the selection of a TV station is independent of the level of education.
Educational Level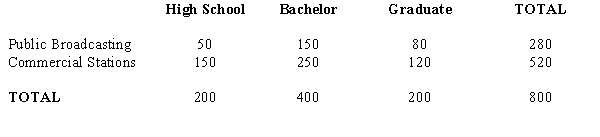
a.State the null and the alternative hypotheses.
b.Show the contingency table of the expected frequencies.
c.Compute the test statistic.
d.The null hypothesis is to be tested at 95% confidence. Determine the critical value for this test.
e.Determine the p-value and perform the test.
Question
Among 1,000 managers with degrees in business administration, the following data have been accumulated as to their fields of concentration. 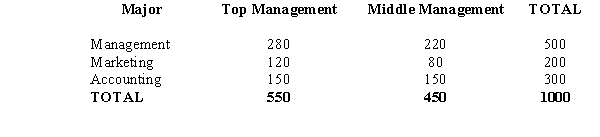 We want to determine if the position in management is independent of field (major) of concentration.
a.Compute the test statistic.
b.Using the p-value approach at 90% confidence, test to determine if management position is independent of major.
c.Using the critical value approach, test the hypotheses. Let = 0.10.
We want to determine if the position in management is independent of field (major) of concentration. a.Compute the test statistic.
b.Using the p-value approach at 90% confidence, test to determine if management position is independent of major.
c.Using the critical value approach, test the hypotheses. Let = 0.10.
Question
Exhibit 12-8
The following shows the number of individuals in a sample of 300 who indicated they support the new tax proposal. We are interested in determining whether or not the opinions of the individuals of the three groups are uniformly distributed.
Refer to Exhibit 12-8. The number of degrees of freedom associated with this problem is
A)2
B)3
C)300
D)299
The following shows the number of individuals in a sample of 300 who indicated they support the new tax proposal.
We are interested in determining whether or not the opinions of the individuals of the three groups are uniformly distributed.Refer to Exhibit 12-8. The number of degrees of freedom associated with this problem is
A)2
B)3
C)300
D)299
Question
Exhibit 12-7
You want to test whether or not the following sample of 30 observations follows a normal distribution. The mean of the sample equals 11.83, and the standard deviation equals 4.53.
Refer to Exhibit 12-7. The expected frequency in the 3rd interval is
A)3
B)4
C)5
D)10
You want to test whether or not the following sample of 30 observations follows a normal distribution. The mean of the sample equals 11.83, and the standard deviation equals 4.53.
Refer to Exhibit 12-7. The expected frequency in the 3rd interval is
A)3
B)4
C)5
D)10
Question
Prior to the start of the season, it was expected that audience proportions for the four major news networks would be CBS 18.6%, NBC 12.5%, ABC 28.9% and BBC 40%. A recent sample of homes yielded the following viewing audience data. 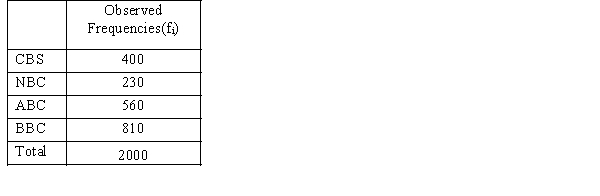 We want to determine whether or not the recent sample supports the expectations of the number of homes of the viewing audience of the four networks.
a.State the null and alternative hypotheses to be tested.
b.Compute the test statistic.
c.The null hypothesis is to be tested at 95% confidence. Determine the critical value for this test.
d.What do you conclude?
We want to determine whether or not the recent sample supports the expectations of the number of homes of the viewing audience of the four networks. a.State the null and alternative hypotheses to be tested.
b.Compute the test statistic.
c.The null hypothesis is to be tested at 95% confidence. Determine the critical value for this test.
d.What do you conclude?
Question
The results of a recent study regarding smoking and three types of illness are shown in the following table. 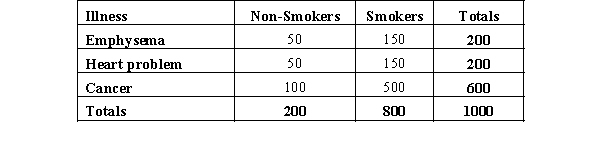 We are interested in determining whether or not illness is independent of smoking.
a.State the null and alternative hypotheses to be tested.
b.Show the contingency table of the expected frequencies and determine the test statistic.
c.The null hypothesis is to be tested at 95% confidence. Determine the critical value for this test.
d.What do you conclude?
We are interested in determining whether or not illness is independent of smoking. a.State the null and alternative hypotheses to be tested.
b.Show the contingency table of the expected frequencies and determine the test statistic.
c.The null hypothesis is to be tested at 95% confidence. Determine the critical value for this test.
d.What do you conclude?
Question
During the first few weeks of the new television season, the evening news audience proportions were recorded as ABC- 31%, CBS- 34%, and NBC- 35%. A sample of 600 homes yielded the following viewing audience data.  We want to determine whether or not there has been a significant change in the number of viewing audience of the three networks.
a.State the null and alternative hypotheses to be tested.
b.Compute the expected frequencies.
c.Compute the test statistic.
d.The null hypothesis is to be tested at 95% confidence. Determine the critical value for this test. What do you conclude?
e.Determine the p-value and perform the test.
We want to determine whether or not there has been a significant change in the number of viewing audience of the three networks. a.State the null and alternative hypotheses to be tested.
b.Compute the expected frequencies.
c.Compute the test statistic.
d.The null hypothesis is to be tested at 95% confidence. Determine the critical value for this test. What do you conclude?
e.Determine the p-value and perform the test.
Question
Exhibit 12-6
The owner of a car wash wants to see if the arrival rate of cars follows a Poisson distribution. In order to test the assumption of a Poisson distribution, a random sample of 150 ten-minute intervals was taken. You are given the following observed frequencies:
Refer to Exhibit 12-6. The p-value is
A)greater than 0.1
B)between 0.05 and 0.1
C)between .025 and .05
D)between .01 and .025
Question
Exhibit 12-7
You want to test whether or not the following sample of 30 observations follows a normal distribution. The mean of the sample equals 11.83, and the standard deviation equals 4.53.
Refer to Exhibit 12-7. The number of intervals or categories used to test the hypothesis for this problem is
A)4
B)5
C)6
D)10
Question
Exhibit 12-8
The following shows the number of individuals in a sample of 300 who indicated they support the new tax proposal. We are interested in determining whether or not the opinions of the individuals of the three groups are uniformly distributed.
Refer to Exhibit 12-8. The calculated value for the test statistic equals
A)300
B)4
C)0
D)8
The following shows the number of individuals in a sample of 300 who indicated they support the new tax proposal.
We are interested in determining whether or not the opinions of the individuals of the three groups are uniformly distributed.Refer to Exhibit 12-8. The calculated value for the test statistic equals
A)300
B)4
C)0
D)8
Question
Exhibit 12-7
You want to test whether or not the following sample of 30 observations follows a normal distribution. The mean of the sample equals 11.83, and the standard deviation equals 4.53.
Refer to Exhibit 12-7. At 95% confidence, the conclusion of the test is that the
A)data follows a normal distribution
B)data does not follow a normal distribution
C)test is inconclusive
D)None of these alternatives is correct.
Question
The personnel department of a large corporation reported sixty resignations during the last year. The following table groups these resignations according to the season in which they occurred:  Test to see if the number of resignations is uniform over the four seasons.
Let = 0.05.
Test to see if the number of resignations is uniform over the four seasons.Let = 0.05.
Question
Dr. Maria Pecora diet pills are supposed to cause significant weight loss. The following table shows the results of a recent study where some individuals took the diet pills and some did not. 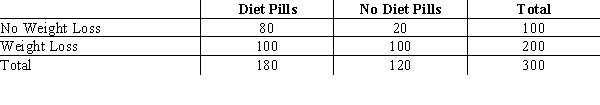 We want to see if losing weight is independent of taking the diet pills.
a.Compute the test statistic.
b.Using the p-value approach at 95% confidence, test to determine if weight loss is independent on taking the pill.
c.Use the critical method approach and test for independence.
We want to see if losing weight is independent of taking the diet pills. a.Compute the test statistic.
b.Using the p-value approach at 95% confidence, test to determine if weight loss is independent on taking the pill.
c.Use the critical method approach and test for independence.
Question
A group of 500 individuals were asked to cast their votes regarding a particular issue of the Equal Rights Amendment. The following contingency table shows the results of the votes: 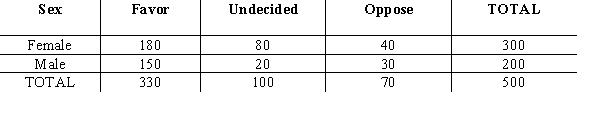 At = .05 using the p-value approach, test to determine if the votes cast were independent of the sex of the individuals.
At = .05 using the p-value approach, test to determine if the votes cast were independent of the sex of the individuals. Question
From a poll of 800 television viewers, the following data have been accumulated as to their levels of education and their preference of television stations. 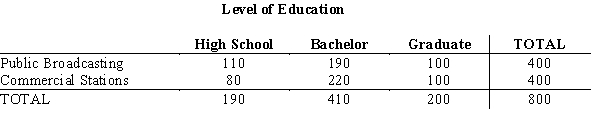 Test at = .05 to determine if the selection of a TV station is dependent upon the level of education. Use the p-value approach.
Test at = .05 to determine if the selection of a TV station is dependent upon the level of education. Use the p-value approach. Question
A group of 2000 individuals from 3 different cities were asked whether they owned a foreign or a domestic car. The following contingency table shows the results of the survey. 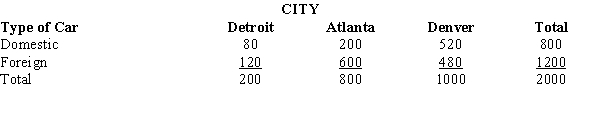 At = 0.05 using the p-value approach, test to determine if the type of car purchased is independent of the city in which the purchasers live.
At = 0.05 using the p-value approach, test to determine if the type of car purchased is independent of the city in which the purchasers live. Question
The following table shows the results of recent study regarding gender of individuals and their selected field of study.  We want to determine if the selected field of study is independent of gender.
a.Compute the test statistic.
b.Using the p-value approach at 90% confidence, test to see if the field of study is independent of gender.
c.Using the critical method approach at 90% confidence, test for the independence of major and gender.
We want to determine if the selected field of study is independent of gender. a.Compute the test statistic.
b.Using the p-value approach at 90% confidence, test to see if the field of study is independent of gender.
c.Using the critical method approach at 90% confidence, test for the independence of major and gender.
Question
A lottery is conducted that involves the random selection of numbers from 0 to 4. To make sure that the lottery is fair, a sample of 250 was taken. The following results were obtained: 
a.State the null and alternative hypotheses to be tested.
b.Compute the test statistic.
c.The null hypothesis is to be tested at the 5% level of significance. Determine the critical value from the table.
d.What do you conclude about the fairness of this lottery?
a.State the null and alternative hypotheses to be tested.
b.Compute the test statistic.
c.The null hypothesis is to be tested at the 5% level of significance. Determine the critical value from the table.
d.What do you conclude about the fairness of this lottery?
Question
A major automobile manufacturer claimed that the frequencies of repairs on all five models of its cars are the same. A sample of 200 repair services showed the following frequencies on the various makes of cars.  At = 0.05, test the manufacturer's claim.
At = 0.05, test the manufacturer's claim. Question
Question
Before the presidential debates, it was expected that the percentages of registered voters in favor of various candidates would be as follows.  After the presidential debates, a random sample of 1200 voters showed that 540 favored the Democratic candidate; 480 were in favor of the Republican candidate; 40 were in favor of the Independent candidate, and 140 were undecided. We want to see if the proportion of voters has changed.
a.Compute the test statistic.
b.Use the p-value approach to test the hypotheses. Let = .05.
c.Using the critical value approach, test the hypotheses. Let = .05.
After the presidential debates, a random sample of 1200 voters showed that 540 favored the Democratic candidate; 480 were in favor of the Republican candidate; 40 were in favor of the Independent candidate, and 140 were undecided. We want to see if the proportion of voters has changed. a.Compute the test statistic.
b.Use the p-value approach to test the hypotheses. Let = .05.
c.Using the critical value approach, test the hypotheses. Let = .05.
Question
Shown below is 3 x 2 contingency table with observed values from a sample of 1,500. At 95% confidence, test for independence of the row and column factors. 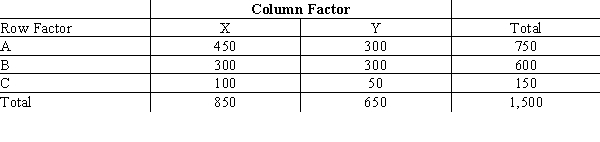
Question
A sample of 150 individuals (males and females) was surveyed, and the individuals were asked to indicate their yearly incomes. Their incomes were categorized as follows.  The results of the survey are shown below.
  We want to determine if yearly income is independent of gender.
a.Compute the test statistic.
b.Using the p-value approach, test to determine if yearly income is independent of gender.
The results of the survey are shown below. We want to determine if yearly income is independent of gender. a.Compute the test statistic.
b.Using the p-value approach, test to determine if yearly income is independent of gender.
Question
Last school year, in the school of Business Administration, 30% were Accounting majors, 24% Management majors, 26% Marketing majors, and 20% Economics majors. A sample of 300 students taken from this year's students of the school showed the following number of students in each major:  We want to see if there has been a significant change in the number of students in each major.
a.Compute the test statistic.
b.Has there been any significant change in the number of students in each major between the last school year and this school year. Use the p-value approach and let = .05.
We want to see if there has been a significant change in the number of students in each major. a.Compute the test statistic.
b.Has there been any significant change in the number of students in each major between the last school year and this school year. Use the p-value approach and let = .05.
Question
Before the start of the Winter Olympics, it was expected that the percentages of medals awarded to the top contenders to be as follows.  Midway through the Olympics, of the 120 medals awarded, the following distribution was observed.
  We want to test to see if there is a significant difference between the expected and actual awards given.
a.Compute the test statistic.
b.Using the p-value approach, test to see if there is a significant difference between the expected and the actual values. Let = .05.
c.At 95% confidence, test for a significant difference using the critical value approach.
Midway through the Olympics, of the 120 medals awarded, the following distribution was observed. We want to test to see if there is a significant difference between the expected and actual awards given. a.Compute the test statistic.
b.Using the p-value approach, test to see if there is a significant difference between the expected and the actual values. Let = .05.
c.At 95% confidence, test for a significant difference using the critical value approach.
Question
Question
Five hundred randomly selected automobile owners were questioned on the main reason they had purchased their current automobile. The results are given below. 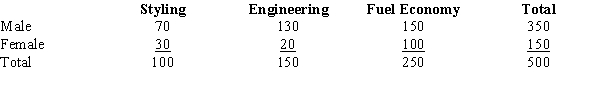
a.State the null and alternative hypotheses for a contingency table test.
b.State the decision rule for the critical value approach. Let = .01.
c.Calculate the 2 test statistic.
d.Give your conclusion for this test.
a.State the null and alternative hypotheses for a contingency table test.
b.State the decision rule for the critical value approach. Let = .01.
c.Calculate the 2 test statistic.
d.Give your conclusion for this test.
Question
A medical journal reported the following frequencies of deaths due to cardiac arrest for each day of the week: 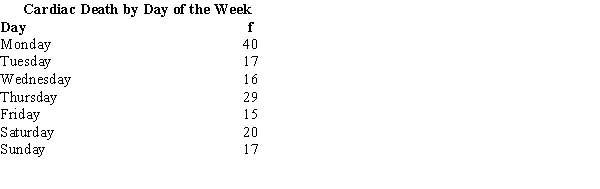 We want to determine whether the number of deaths is uniform over the week.
a.Compute the test statistic.
b.Using the p-value approach at 95% confidence, test for the uniformity of death over the week.
c.Using the critical value approach, perform the test for uniformity.
We want to determine whether the number of deaths is uniform over the week. a.Compute the test statistic.
b.Using the p-value approach at 95% confidence, test for the uniformity of death over the week.
c.Using the critical value approach, perform the test for uniformity.
Question
Two hundred fifty managers with degrees in business administration indicated their fields of concentration as shown below. 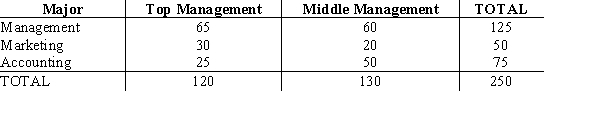 At
At
= .01 using the p-value approach, test to determine if the position in management is independent of the major of concentration.
At = .01 using the p-value approach, test to determine if the position in management is independent of the major of concentration.
Question
Question
Shown below is 2 x 3 contingency table with observed values from a sample of 500. At 95% confidence using the critical value approach, test for independence of the row and column factors. 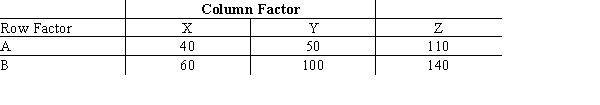

Unlock Deck
Sign up to unlock the cards in this deck!
Unlock Deck
Unlock Deck
1/90
Play
Full screen (f)
Deck 12: Comparing Multiple Proportions, Test of Independence and Goodness of Fit
1
Exhibit 12-2
Last school year, the student body of a local university consisted of 30% freshmen, 24% sophomores, 26% juniors, and 20% seniors. A sample of 300 students taken from this year's student body showed the following number of students in each classification. We are interested in determining whether or not there has been a significant change in the classifications between the last school year and this school year.
Refer to Exhibit 12-2. The expected number of freshmen is
A)83
B)90
C)30
D)10
Last school year, the student body of a local university consisted of 30% freshmen, 24% sophomores, 26% juniors, and 20% seniors. A sample of 300 students taken from this year's student body showed the following number of students in each classification.
We are interested in determining whether or not there has been a significant change in the classifications between the last school year and this school year.Refer to Exhibit 12-2. The expected number of freshmen is
A)83
B)90
C)30
D)10
90
2
A statistical test conducted to determine whether to reject or not reject a hypothesized probability distribution for a population is known as a
A)contingency test
B)probability test
C)goodness of fit test
D)None of these alternatives is correct.
A)contingency test
B)probability test
C)goodness of fit test
D)None of these alternatives is correct.
goodness of fit test
3
The degrees of freedom for a contingency table with 6 rows and 3 columns is
A)18
B)15
C)6
D)10
A)18
B)15
C)6
D)10
10
4
In order not to violate the requirements necessary to use the chi-square distribution, each expected frequency in a goodness of fit test must be
A)at least 5
B)at least 10
C)no more than 5
D)less than 2
A)at least 5
B)at least 10
C)no more than 5
D)less than 2
Unlock Deck
Unlock for access to all 90 flashcards in this deck.
Unlock Deck
k this deck
5
Exhibit 12-1
When individuals in a sample of 150 were asked whether or not they supported capital punishment, the following information was obtained. We are interested in determining whether or not the opinions of the individuals (as to Yes, No, and No Opinion) are uniformly distributed.
Refer to Exhibit 12-1. The p-value is
A)larger than 0.1
B)less than 0.1
C)less than 0.05
D)larger than 0.9
When individuals in a sample of 150 were asked whether or not they supported capital punishment, the following information was obtained.
We are interested in determining whether or not the opinions of the individuals (as to Yes, No, and No Opinion) are uniformly distributed.Refer to Exhibit 12-1. The p-value is
A)larger than 0.1
B)less than 0.1
C)less than 0.05
D)larger than 0.9
Unlock Deck
Unlock for access to all 90 flashcards in this deck.
Unlock Deck
k this deck
6
Exhibit 12-2
Last school year, the student body of a local university consisted of 30% freshmen, 24% sophomores, 26% juniors, and 20% seniors. A sample of 300 students taken from this year's student body showed the following number of students in each classification. We are interested in determining whether or not there has been a significant change in the classifications between the last school year and this school year.
Refer to Exhibit 12-2. The expected frequency of seniors is
A)60
B)20%
C)68
D)64
Last school year, the student body of a local university consisted of 30% freshmen, 24% sophomores, 26% juniors, and 20% seniors. A sample of 300 students taken from this year's student body showed the following number of students in each classification.
We are interested in determining whether or not there has been a significant change in the classifications between the last school year and this school year.Refer to Exhibit 12-2. The expected frequency of seniors is
A)60
B)20%
C)68
D)64
Unlock Deck
Unlock for access to all 90 flashcards in this deck.
Unlock Deck
k this deck
7
The degrees of freedom for a contingency table with 10 rows and 11 columns is
A)100
B)110
C)21
D)90
A)100
B)110
C)21
D)90
Unlock Deck
Unlock for access to all 90 flashcards in this deck.
Unlock Deck
k this deck
8
The degrees of freedom for a contingency table with 12 rows and 12 columns is
A)144
B)121
C)12
D)120
A)144
B)121
C)12
D)120
Unlock Deck
Unlock for access to all 90 flashcards in this deck.
Unlock Deck
k this deck
9
Exhibit 12-1
When individuals in a sample of 150 were asked whether or not they supported capital punishment, the following information was obtained. We are interested in determining whether or not the opinions of the individuals (as to Yes, No, and No Opinion) are uniformly distributed.
Refer to Exhibit 12-1. The number of degrees of freedom associated with this problem is
A)150
B)149
C)2
D)3
When individuals in a sample of 150 were asked whether or not they supported capital punishment, the following information was obtained.
We are interested in determining whether or not the opinions of the individuals (as to Yes, No, and No Opinion) are uniformly distributed.Refer to Exhibit 12-1. The number of degrees of freedom associated with this problem is
A)150
B)149
C)2
D)3
Unlock Deck
Unlock for access to all 90 flashcards in this deck.
Unlock Deck
k this deck
10
The number of degrees of freedom for the appropriate chi-square distribution in a test of independence is
A)n-1
B)K-1
C)number of rows minus 1 times number of columns minus 1
D)a chi-square distribution is not used
A)n-1
B)K-1
C)number of rows minus 1 times number of columns minus 1
D)a chi-square distribution is not used
Unlock Deck
Unlock for access to all 90 flashcards in this deck.
Unlock Deck
k this deck
11
A population where each element of the population is assigned to one and only one of several classes or categories is a
A)multinomial population
B)Poisson population
C)normal population
D)None of these alternatives is correct.
A)multinomial population
B)Poisson population
C)normal population
D)None of these alternatives is correct.
Unlock Deck
Unlock for access to all 90 flashcards in this deck.
Unlock Deck
k this deck
12
Testing the equality of three or more population proportions
A)is not possible, since proportions deal with only two possible outcomes
B)uses a t - test
C)is the same as test of goodness of means
D)uses a chi-square test
A)is not possible, since proportions deal with only two possible outcomes
B)uses a t - test
C)is the same as test of goodness of means
D)uses a chi-square test
Unlock Deck
Unlock for access to all 90 flashcards in this deck.
Unlock Deck
k this deck
13
Marascuillo procedure is used for testing the equality of three or more population
A)proportions
B)means
C)variances
D)standard deviations
A)proportions
B)means
C)variances
D)standard deviations
Unlock Deck
Unlock for access to all 90 flashcards in this deck.
Unlock Deck
k this deck
14
A goodness of fit test is always conducted as a
A)lower-tail test
B)upper-tail test
C)middle test
D)None of these alternatives is correct.
A)lower-tail test
B)upper-tail test
C)middle test
D)None of these alternatives is correct.
Unlock Deck
Unlock for access to all 90 flashcards in this deck.
Unlock Deck
k this deck
15
Exhibit 12-1
When individuals in a sample of 150 were asked whether or not they supported capital punishment, the following information was obtained. We are interested in determining whether or not the opinions of the individuals (as to Yes, No, and No Opinion) are uniformly distributed.
Refer to Exhibit 12-1. The calculated value for the test statistic equals
A)2
B)-2
C)20
D)4
When individuals in a sample of 150 were asked whether or not they supported capital punishment, the following information was obtained.
We are interested in determining whether or not the opinions of the individuals (as to Yes, No, and No Opinion) are uniformly distributed.Refer to Exhibit 12-1. The calculated value for the test statistic equals
A)2
B)-2
C)20
D)4
Unlock Deck
Unlock for access to all 90 flashcards in this deck.
Unlock Deck
k this deck
16
An important application of the chi-square distribution is
A)making inferences about a single population variance
B)testing for goodness of fit
C)testing for the independence of two variables
D)All of these alternatives are correct.
A)making inferences about a single population variance
B)testing for goodness of fit
C)testing for the independence of two variables
D)All of these alternatives are correct.
Unlock Deck
Unlock for access to all 90 flashcards in this deck.
Unlock Deck
k this deck
17
If there are three or more populations, then it is
A)possible to test for equality of the three population proportions
B)impossible to test for equality of the three population proportions, because chi-square deals with only two populations
C)customary to use a t distribution
D)None of these alternatives is correct.
A)possible to test for equality of the three population proportions
B)impossible to test for equality of the three population proportions, because chi-square deals with only two populations
C)customary to use a t distribution
D)None of these alternatives is correct.
Unlock Deck
Unlock for access to all 90 flashcards in this deck.
Unlock Deck
k this deck
18
Exhibit 12-1
When individuals in a sample of 150 were asked whether or not they supported capital punishment, the following information was obtained. We are interested in determining whether or not the opinions of the individuals (as to Yes, No, and No Opinion) are uniformly distributed.
Refer to Exhibit 12-1. The conclusion of the test (at 95% confidence) is that the
A)distribution is uniform
B)distribution is not uniform
C)test is inconclusive
D)None of these alternatives is correct.
When individuals in a sample of 150 were asked whether or not they supported capital punishment, the following information was obtained.
We are interested in determining whether or not the opinions of the individuals (as to Yes, No, and No Opinion) are uniformly distributed.Refer to Exhibit 12-1. The conclusion of the test (at 95% confidence) is that the
A)distribution is uniform
B)distribution is not uniform
C)test is inconclusive
D)None of these alternatives is correct.
Unlock Deck
Unlock for access to all 90 flashcards in this deck.
Unlock Deck
k this deck
19
The sampling distribution for a goodness of fit test is the
A)Poisson distribution
B)t distribution
C)normal distribution
D)chi-square distribution
A)Poisson distribution
B)t distribution
C)normal distribution
D)chi-square distribution
Unlock Deck
Unlock for access to all 90 flashcards in this deck.
Unlock Deck
k this deck
20
Exhibit 12-1
When individuals in a sample of 150 were asked whether or not they supported capital punishment, the following information was obtained. We are interested in determining whether or not the opinions of the individuals (as to Yes, No, and No Opinion) are uniformly distributed.
Refer to Exhibit 12-1. The expected frequency for each group is
A)0.333
B)0.50
C)1/3
D)50
When individuals in a sample of 150 were asked whether or not they supported capital punishment, the following information was obtained.
We are interested in determining whether or not the opinions of the individuals (as to Yes, No, and No Opinion) are uniformly distributed.Refer to Exhibit 12-1. The expected frequency for each group is
A)0.333
B)0.50
C)1/3
D)50
Unlock Deck
Unlock for access to all 90 flashcards in this deck.
Unlock Deck
k this deck
21
Exhibit 12-4
In the past, 35% of the students at ABC University were in the Business College, 35% of the students were in the Liberal Arts College, and 30% of the students were in the Education College. To see whether or not the proportions have changed, a sample of 300 students was taken. Ninety of the sample students are in the Business College, 120 are in the Liberal Arts College, and 90 are in the Education College.
Refer to Exhibit 12-4. This problem is an example of a
A)normally distributed variable
B)test for independence
C)Poisson distributed variable
D)multinomial population
Unlock Deck
Unlock for access to all 90 flashcards in this deck.
Unlock Deck
k this deck
22
Exhibit 12-2
Last school year, the student body of a local university consisted of 30% freshmen, 24% sophomores, 26% juniors, and 20% seniors. A sample of 300 students taken from this year's student body showed the following number of students in each classification. We are interested in determining whether or not there has been a significant change in the classifications between the last school year and this school year.
Refer to Exhibit 12-2. The p-value is
A)less than .005
B)between .025 and 0.05
C)between .05 and 0.1
D)greater than 0.1
Last school year, the student body of a local university consisted of 30% freshmen, 24% sophomores, 26% juniors, and 20% seniors. A sample of 300 students taken from this year's student body showed the following number of students in each classification.
We are interested in determining whether or not there has been a significant change in the classifications between the last school year and this school year.Refer to Exhibit 12-2. The p-value is
A)less than .005
B)between .025 and 0.05
C)between .05 and 0.1
D)greater than 0.1
Unlock Deck
Unlock for access to all 90 flashcards in this deck.
Unlock Deck
k this deck
23
Exhibit 12-3
In order to determine whether or not a particular medication was effective in curing the common cold, one group of patients was given the medication, while another group received sugar pills. The results of the study are shown below. We are interested in determining whether or not the medication was effective in curing the common cold.
Refer to Exhibit 12-3. The hypothesis is to be tested at the 5% level of significance. The critical value from the table equals
A)3.84
B)7.81
C)5.99
D)9.34
In order to determine whether or not a particular medication was effective in curing the common cold, one group of patients was given the medication, while another group received sugar pills. The results of the study are shown below.
We are interested in determining whether or not the medication was effective in curing the common cold.Refer to Exhibit 12-3. The hypothesis is to be tested at the 5% level of significance. The critical value from the table equals
A)3.84
B)7.81
C)5.99
D)9.34
Unlock Deck
Unlock for access to all 90 flashcards in this deck.
Unlock Deck
k this deck
24
Exhibit 12-4
In the past, 35% of the students at ABC University were in the Business College, 35% of the students were in the Liberal Arts College, and 30% of the students were in the Education College. To see whether or not the proportions have changed, a sample of 300 students was taken. Ninety of the sample students are in the Business College, 120 are in the Liberal Arts College, and 90 are in the Education College.
Refer to Exhibit 12-4. The calculated value for the test statistic equals
A)0.01
B)0.75
C)4.29
D)4.38
Unlock Deck
Unlock for access to all 90 flashcards in this deck.
Unlock Deck
k this deck
25
Exhibit 12-4
In the past, 35% of the students at ABC University were in the Business College, 35% of the students were in the Liberal Arts College, and 30% of the students were in the Education College. To see whether or not the proportions have changed, a sample of 300 students was taken. Ninety of the sample students are in the Business College, 120 are in the Liberal Arts College, and 90 are in the Education College.
Refer to Exhibit 12-4. The hypothesis is to be tested at the 5% level of significance. The critical value from the table equals
A)1.645
B)1.96
C)5.991
D)7.815
Unlock Deck
Unlock for access to all 90 flashcards in this deck.
Unlock Deck
k this deck
26
Exhibit 12-6
The owner of a car wash wants to see if the arrival rate of cars follows a Poisson distribution. In order to test the assumption of a Poisson distribution, a random sample of 150 ten-minute intervals was taken. You are given the following observed frequencies:
Refer to Exhibit 12-6. The calculated value for the test statistic equals
A)-0.18
B)0.18
C)1.72
D)2.89
Unlock Deck
Unlock for access to all 90 flashcards in this deck.
Unlock Deck
k this deck
27
Exhibit 12-3
In order to determine whether or not a particular medication was effective in curing the common cold, one group of patients was given the medication, while another group received sugar pills. The results of the study are shown below. We are interested in determining whether or not the medication was effective in curing the common cold.
Refer to Exhibit 12-3. The expected frequency of those who received medication and were cured is
A)70
B)150
C)28
D)48
In order to determine whether or not a particular medication was effective in curing the common cold, one group of patients was given the medication, while another group received sugar pills. The results of the study are shown below.
We are interested in determining whether or not the medication was effective in curing the common cold.Refer to Exhibit 12-3. The expected frequency of those who received medication and were cured is
A)70
B)150
C)28
D)48
Unlock Deck
Unlock for access to all 90 flashcards in this deck.
Unlock Deck
k this deck
28
Exhibit 12-3
In order to determine whether or not a particular medication was effective in curing the common cold, one group of patients was given the medication, while another group received sugar pills. The results of the study are shown below. We are interested in determining whether or not the medication was effective in curing the common cold.
Refer to Exhibit 12-3. The number of degrees of freedom associated with this problem is
A)4
B)149
C)1
D)3
In order to determine whether or not a particular medication was effective in curing the common cold, one group of patients was given the medication, while another group received sugar pills. The results of the study are shown below.
We are interested in determining whether or not the medication was effective in curing the common cold.Refer to Exhibit 12-3. The number of degrees of freedom associated with this problem is
A)4
B)149
C)1
D)3
Unlock Deck
Unlock for access to all 90 flashcards in this deck.
Unlock Deck
k this deck
29
Exhibit 12-5
The table below gives beverage preferences for random samples of teens and adults. We are asked to test for independence between age (i.e., adult and teen) and drink preferences.
Refer to Exhibit 12-5. The test statistic for this test of independence is
A)0
B)8.4
C)62.5
D)82.5
The table below gives beverage preferences for random samples of teens and adults.
We are asked to test for independence between age (i.e., adult and teen) and drink preferences.Refer to Exhibit 12-5. The test statistic for this test of independence is
A)0
B)8.4
C)62.5
D)82.5
Unlock Deck
Unlock for access to all 90 flashcards in this deck.
Unlock Deck
k this deck
30
Exhibit 12-4
In the past, 35% of the students at ABC University were in the Business College, 35% of the students were in the Liberal Arts College, and 30% of the students were in the Education College. To see whether or not the proportions have changed, a sample of 300 students was taken. Ninety of the sample students are in the Business College, 120 are in the Liberal Arts College, and 90 are in the Education College.
Refer to Exhibit 12-4. The expected frequency for the Business College is
A)0.3
B)0.35
C)90
D)105
Unlock Deck
Unlock for access to all 90 flashcards in this deck.
Unlock Deck
k this deck
31
Exhibit 12-3
In order to determine whether or not a particular medication was effective in curing the common cold, one group of patients was given the medication, while another group received sugar pills. The results of the study are shown below. We are interested in determining whether or not the medication was effective in curing the common cold.
Refer to Exhibit 12-3. The test statistic is
A)10.08
B)54.02
C)1.96
D)1.645
In order to determine whether or not a particular medication was effective in curing the common cold, one group of patients was given the medication, while another group received sugar pills. The results of the study are shown below.
We are interested in determining whether or not the medication was effective in curing the common cold.Refer to Exhibit 12-3. The test statistic is
A)10.08
B)54.02
C)1.96
D)1.645
Unlock Deck
Unlock for access to all 90 flashcards in this deck.
Unlock Deck
k this deck
32
Exhibit 12-6
The owner of a car wash wants to see if the arrival rate of cars follows a Poisson distribution. In order to test the assumption of a Poisson distribution, a random sample of 150 ten-minute intervals was taken. You are given the following observed frequencies:
Refer to Exhibit 12-6. The expected frequency of exactly 3 cars arriving in a 10-minute interval is
A)0.1533
B)0.1743
C)23
D)26.145
Unlock Deck
Unlock for access to all 90 flashcards in this deck.
Unlock Deck
k this deck
33
Exhibit 12-3
In order to determine whether or not a particular medication was effective in curing the common cold, one group of patients was given the medication, while another group received sugar pills. The results of the study are shown below. We are interested in determining whether or not the medication was effective in curing the common cold.
Refer to Exhibit 12-3. The p-value is
A)less than .005
B)between .005 and .01
C)between .01 and .025
D)between .025 and .05
In order to determine whether or not a particular medication was effective in curing the common cold, one group of patients was given the medication, while another group received sugar pills. The results of the study are shown below.
We are interested in determining whether or not the medication was effective in curing the common cold.Refer to Exhibit 12-3. The p-value is
A)less than .005
B)between .005 and .01
C)between .01 and .025
D)between .025 and .05
Unlock Deck
Unlock for access to all 90 flashcards in this deck.
Unlock Deck
k this deck
34
Exhibit 12-2
Last school year, the student body of a local university consisted of 30% freshmen, 24% sophomores, 26% juniors, and 20% seniors. A sample of 300 students taken from this year's student body showed the following number of students in each classification. We are interested in determining whether or not there has been a significant change in the classifications between the last school year and this school year.
Refer to Exhibit 12-2. The calculated value for the test statistic equals
A)0.5444
B)300
C)1.6615
D)6.6615
Last school year, the student body of a local university consisted of 30% freshmen, 24% sophomores, 26% juniors, and 20% seniors. A sample of 300 students taken from this year's student body showed the following number of students in each classification.
We are interested in determining whether or not there has been a significant change in the classifications between the last school year and this school year.Refer to Exhibit 12-2. The calculated value for the test statistic equals
A)0.5444
B)300
C)1.6615
D)6.6615
Unlock Deck
Unlock for access to all 90 flashcards in this deck.
Unlock Deck
k this deck
35
Exhibit 12-5
The table below gives beverage preferences for random samples of teens and adults. We are asked to test for independence between age (i.e., adult and teen) and drink preferences.
Refer to Exhibit 12-5. The expected number of adults who prefer coffee is
A)0.25
B)0.33
C)150
D)200
The table below gives beverage preferences for random samples of teens and adults.
We are asked to test for independence between age (i.e., adult and teen) and drink preferences.Refer to Exhibit 12-5. The expected number of adults who prefer coffee is
A)0.25
B)0.33
C)150
D)200
Unlock Deck
Unlock for access to all 90 flashcards in this deck.
Unlock Deck
k this deck
36
Exhibit 12-5
The table below gives beverage preferences for random samples of teens and adults. We are asked to test for independence between age (i.e., adult and teen) and drink preferences.
Refer to Exhibit 12-5. The p-value is
A)between .1 and .05
B)between .05 and .025
C)between .025 and .01
D)less than 0.005
The table below gives beverage preferences for random samples of teens and adults.
We are asked to test for independence between age (i.e., adult and teen) and drink preferences.Refer to Exhibit 12-5. The p-value is
A)between .1 and .05
B)between .05 and .025
C)between .025 and .01
D)less than 0.005
Unlock Deck
Unlock for access to all 90 flashcards in this deck.
Unlock Deck
k this deck
37
Exhibit 12-2
Last school year, the student body of a local university consisted of 30% freshmen, 24% sophomores, 26% juniors, and 20% seniors. A sample of 300 students taken from this year's student body showed the following number of students in each classification. We are interested in determining whether or not there has been a significant change in the classifications between the last school year and this school year.
Refer to Exhibit 12-2. At 95% confidence, the null hypothesis
A)should not be rejected
B)should be rejected
C)was designed wrong
D)None of these alternatives is correct.
Last school year, the student body of a local university consisted of 30% freshmen, 24% sophomores, 26% juniors, and 20% seniors. A sample of 300 students taken from this year's student body showed the following number of students in each classification.
We are interested in determining whether or not there has been a significant change in the classifications between the last school year and this school year.Refer to Exhibit 12-2. At 95% confidence, the null hypothesis
A)should not be rejected
B)should be rejected
C)was designed wrong
D)None of these alternatives is correct.
Unlock Deck
Unlock for access to all 90 flashcards in this deck.
Unlock Deck
k this deck
38
Exhibit 12-4
In the past, 35% of the students at ABC University were in the Business College, 35% of the students were in the Liberal Arts College, and 30% of the students were in the Education College. To see whether or not the proportions have changed, a sample of 300 students was taken. Ninety of the sample students are in the Business College, 120 are in the Liberal Arts College, and 90 are in the Education College.
Refer to Exhibit 12-4. The p-value is
A)greater than 0.1
B)between 0.05 and 0.1
C)between 0.025 and 0.05
D)between 0.01 and .025
Unlock Deck
Unlock for access to all 90 flashcards in this deck.
Unlock Deck
k this deck
39
Exhibit 12-4
In the past, 35% of the students at ABC University were in the Business College, 35% of the students were in the Liberal Arts College, and 30% of the students were in the Education College. To see whether or not the proportions have changed, a sample of 300 students was taken. Ninety of the sample students are in the Business College, 120 are in the Liberal Arts College, and 90 are in the Education College.
Refer to Exhibit 12-4. The conclusion of the test is that the
A)proportions have changed significantly
B)proportions have not changed significantly
C)test is inconclusive
D)None of these alternatives is correct.
Unlock Deck
Unlock for access to all 90 flashcards in this deck.
Unlock Deck
k this deck
40
Exhibit 12-5
The table below gives beverage preferences for random samples of teens and adults. We are asked to test for independence between age (i.e., adult and teen) and drink preferences.
Refer to Exhibit 12-5. With a .05 level of significance, the critical value for the test is
A)1.645
B)7.815
C)14.067
D)15.507
The table below gives beverage preferences for random samples of teens and adults.
We are asked to test for independence between age (i.e., adult and teen) and drink preferences.Refer to Exhibit 12-5. With a .05 level of significance, the critical value for the test is
A)1.645
B)7.815
C)14.067
D)15.507
Unlock Deck
Unlock for access to all 90 flashcards in this deck.
Unlock Deck
k this deck
41
Prior to the start of the season, it was expected that audience proportions for the four major news networks would be CBS 28%, NBC 35%, ABC 22% and BBC 15%. A recent sample of homes yielded the following viewing audience data. We want to determine whether or not the recent sample supports the expectations of the number of homes of the viewing audience of the four networks.
a.State the null and alternative hypotheses to be tested.
b.Compute the test statistic.
c.The null hypothesis is to be tested at 95% confidence. Determine the critical value for this test.
d.What do you conclude?
We want to determine whether or not the recent sample supports the expectations of the number of homes of the viewing audience of the four networks. a.State the null and alternative hypotheses to be tested.
b.Compute the test statistic.
c.The null hypothesis is to be tested at 95% confidence. Determine the critical value for this test.
d.What do you conclude?
Unlock Deck
Unlock for access to all 90 flashcards in this deck.
Unlock Deck
k this deck
42
The results of a recent study regarding smoking and three types of illness are shown in the following table. We are interested in determining whether or not illness is independent of smoking.
a.State the null and alternative hypotheses to be tested.
b.Show the contingency table of the expected frequencies.
c.Compute the test statistic.
d.The null hypothesis is to be tested at 95% confidence. Determine the critical value for this test. What do you conclude?
e.Determine the p-value and perform the test.
We are interested in determining whether or not illness is independent of smoking. a.State the null and alternative hypotheses to be tested.
b.Show the contingency table of the expected frequencies.
c.Compute the test statistic.
d.The null hypothesis is to be tested at 95% confidence. Determine the critical value for this test. What do you conclude?
e.Determine the p-value and perform the test.
Unlock Deck
Unlock for access to all 90 flashcards in this deck.
Unlock Deck
k this deck
43
In the last presidential election, before the candidates started their major campaigns, the percentages of registered voters who favored the various candidates were as follows. After the major campaigns began, a random sample of 400 voters showed that 172 favored the Republican candidate; 164 were in favor of the Democratic candidate; and 64 favored the Independent candidate. We are interested in determining whether the proportion of voters who favored the various candidates had changed.
a.Compute the test statistic.
b.Using the p-value approach, test to see if the proportions have changed.
c.Using the critical value approach, test the hypotheses.
After the major campaigns began, a random sample of 400 voters showed that 172 favored the Republican candidate; 164 were in favor of the Democratic candidate; and 64 favored the Independent candidate. We are interested in determining whether the proportion of voters who favored the various candidates had changed. a.Compute the test statistic.
b.Using the p-value approach, test to see if the proportions have changed.
c.Using the critical value approach, test the hypotheses.
Unlock Deck
Unlock for access to all 90 flashcards in this deck.
Unlock Deck
k this deck
44
Exhibit 12-7
You want to test whether or not the following sample of 30 observations follows a normal distribution. The mean of the sample equals 11.83, and the standard deviation equals 4.53.
Refer to Exhibit 12-7. The calculated value for the test statistic equals
A)0
B)1.67
C)2
D)6
You want to test whether or not the following sample of 30 observations follows a normal distribution. The mean of the sample equals 11.83, and the standard deviation equals 4.53.
Refer to Exhibit 12-7. The calculated value for the test statistic equals
A)0
B)1.67
C)2
D)6
Unlock Deck
Unlock for access to all 90 flashcards in this deck.
Unlock Deck
k this deck
45
Shoppers were asked where they do their regular grocery shopping. The table below shows the responses of the sampled shoppers. We are interested in determining if the proportions of females in the three categories are different from each other.
a.Provide the null and the alternative hypotheses.
b.Determine the expected frequencies.
c.Compute the sample proportions.
d.Compute the critical values (CVij).
e.Give your conclusions by providing numerical reasoning.
a.Provide the null and the alternative hypotheses.
b.Determine the expected frequencies.
c.Compute the sample proportions.
d.Compute the critical values (CVij).
e.Give your conclusions by providing numerical reasoning.
Unlock Deck
Unlock for access to all 90 flashcards in this deck.
Unlock Deck
k this deck
46
Exhibit 12-7
You want to test whether or not the following sample of 30 observations follows a normal distribution. The mean of the sample equals 11.83, and the standard deviation equals 4.53.
Refer to Exhibit 12-7. The p-value is
A)greater than 0.1
B)between .05 and 0.1
C)between .025 and .05
D)between .01 and .025
Unlock Deck
Unlock for access to all 90 flashcards in this deck.
Unlock Deck
k this deck
47
Exhibit 12-6
The owner of a car wash wants to see if the arrival rate of cars follows a Poisson distribution. In order to test the assumption of a Poisson distribution, a random sample of 150 ten-minute intervals was taken. You are given the following observed frequencies:
Refer to Exhibit 12-6. At 95% confidence, the conclusion of the test is that the
A)arrival of cars follows a Poisson distribution
B)arrival of cars does not follow a Poisson distribution
C)test is inconclusive
D)None of these alternatives is correct.
Unlock Deck
Unlock for access to all 90 flashcards in this deck.
Unlock Deck
k this deck
48
Exhibit 12-8
The following shows the number of individuals in a sample of 300 who indicated they support the new tax proposal. We are interested in determining whether or not the opinions of the individuals of the three groups are uniformly distributed.
Refer to Exhibit 12-8. The expected frequency for each group is
A)0.333
B)0.50
C)50
D)None of these alternatives is correct.
The following shows the number of individuals in a sample of 300 who indicated they support the new tax proposal.
We are interested in determining whether or not the opinions of the individuals of the three groups are uniformly distributed.Refer to Exhibit 12-8. The expected frequency for each group is
A)0.333
B)0.50
C)50
D)None of these alternatives is correct.
Unlock Deck
Unlock for access to all 90 flashcards in this deck.
Unlock Deck
k this deck
49
The following table shows the results of a study on smoking and three illnesses. We are interested in determining if the proportions smokers in the three categories are different from each other.
a.Provide the null and the alternative hypotheses.
b.Determine the expected frequencies.
c.Compute the sample proportions.
d.Compute the critical values (CVij).
e.Give your conclusions by providing numerical reasoning.
a.Provide the null and the alternative hypotheses.
b.Determine the expected frequencies.
c.Compute the sample proportions.
d.Compute the critical values (CVij).
e.Give your conclusions by providing numerical reasoning.
Unlock Deck
Unlock for access to all 90 flashcards in this deck.
Unlock Deck
k this deck
50
From a poll of 800 television viewers, the following data have been accumulated as to their levels of education and their preference of television stations. We are interested in determining if the selection of a TV station is independent of the level of education.
Educational Level
a.State the null and the alternative hypotheses.
b.Show the contingency table of the expected frequencies.
c.Compute the test statistic.
d.The null hypothesis is to be tested at 95% confidence. Determine the critical value for this test.
e.Determine the p-value and perform the test.
Educational Level
a.State the null and the alternative hypotheses.
b.Show the contingency table of the expected frequencies.
c.Compute the test statistic.
d.The null hypothesis is to be tested at 95% confidence. Determine the critical value for this test.
e.Determine the p-value and perform the test.
Unlock Deck
Unlock for access to all 90 flashcards in this deck.
Unlock Deck
k this deck
51
Among 1,000 managers with degrees in business administration, the following data have been accumulated as to their fields of concentration. We want to determine if the position in management is independent of field (major) of concentration.
a.Compute the test statistic.
b.Using the p-value approach at 90% confidence, test to determine if management position is independent of major.
c.Using the critical value approach, test the hypotheses. Let = 0.10.
We want to determine if the position in management is independent of field (major) of concentration. a.Compute the test statistic.
b.Using the p-value approach at 90% confidence, test to determine if management position is independent of major.
c.Using the critical value approach, test the hypotheses. Let = 0.10.
Unlock Deck
Unlock for access to all 90 flashcards in this deck.
Unlock Deck
k this deck
52
Exhibit 12-8
The following shows the number of individuals in a sample of 300 who indicated they support the new tax proposal. We are interested in determining whether or not the opinions of the individuals of the three groups are uniformly distributed.
Refer to Exhibit 12-8. The number of degrees of freedom associated with this problem is
A)2
B)3
C)300
D)299
The following shows the number of individuals in a sample of 300 who indicated they support the new tax proposal.
We are interested in determining whether or not the opinions of the individuals of the three groups are uniformly distributed.Refer to Exhibit 12-8. The number of degrees of freedom associated with this problem is
A)2
B)3
C)300
D)299
Unlock Deck
Unlock for access to all 90 flashcards in this deck.
Unlock Deck
k this deck
53
Exhibit 12-7
You want to test whether or not the following sample of 30 observations follows a normal distribution. The mean of the sample equals 11.83, and the standard deviation equals 4.53.
Refer to Exhibit 12-7. The expected frequency in the 3rd interval is
A)3
B)4
C)5
D)10
You want to test whether or not the following sample of 30 observations follows a normal distribution. The mean of the sample equals 11.83, and the standard deviation equals 4.53.
Refer to Exhibit 12-7. The expected frequency in the 3rd interval is
A)3
B)4
C)5
D)10
Unlock Deck
Unlock for access to all 90 flashcards in this deck.
Unlock Deck
k this deck
54
Prior to the start of the season, it was expected that audience proportions for the four major news networks would be CBS 18.6%, NBC 12.5%, ABC 28.9% and BBC 40%. A recent sample of homes yielded the following viewing audience data. We want to determine whether or not the recent sample supports the expectations of the number of homes of the viewing audience of the four networks.
a.State the null and alternative hypotheses to be tested.
b.Compute the test statistic.
c.The null hypothesis is to be tested at 95% confidence. Determine the critical value for this test.
d.What do you conclude?
We want to determine whether or not the recent sample supports the expectations of the number of homes of the viewing audience of the four networks. a.State the null and alternative hypotheses to be tested.
b.Compute the test statistic.
c.The null hypothesis is to be tested at 95% confidence. Determine the critical value for this test.
d.What do you conclude?
Unlock Deck
Unlock for access to all 90 flashcards in this deck.
Unlock Deck
k this deck
55
The results of a recent study regarding smoking and three types of illness are shown in the following table. We are interested in determining whether or not illness is independent of smoking.
a.State the null and alternative hypotheses to be tested.
b.Show the contingency table of the expected frequencies and determine the test statistic.
c.The null hypothesis is to be tested at 95% confidence. Determine the critical value for this test.
d.What do you conclude?
We are interested in determining whether or not illness is independent of smoking. a.State the null and alternative hypotheses to be tested.
b.Show the contingency table of the expected frequencies and determine the test statistic.
c.The null hypothesis is to be tested at 95% confidence. Determine the critical value for this test.
d.What do you conclude?
Unlock Deck
Unlock for access to all 90 flashcards in this deck.
Unlock Deck
k this deck
56
During the first few weeks of the new television season, the evening news audience proportions were recorded as ABC- 31%, CBS- 34%, and NBC- 35%. A sample of 600 homes yielded the following viewing audience data. We want to determine whether or not there has been a significant change in the number of viewing audience of the three networks.
a.State the null and alternative hypotheses to be tested.
b.Compute the expected frequencies.
c.Compute the test statistic.
d.The null hypothesis is to be tested at 95% confidence. Determine the critical value for this test. What do you conclude?
e.Determine the p-value and perform the test.
We want to determine whether or not there has been a significant change in the number of viewing audience of the three networks. a.State the null and alternative hypotheses to be tested.
b.Compute the expected frequencies.
c.Compute the test statistic.
d.The null hypothesis is to be tested at 95% confidence. Determine the critical value for this test. What do you conclude?
e.Determine the p-value and perform the test.
Unlock Deck
Unlock for access to all 90 flashcards in this deck.
Unlock Deck
k this deck
57
Exhibit 12-6
The owner of a car wash wants to see if the arrival rate of cars follows a Poisson distribution. In order to test the assumption of a Poisson distribution, a random sample of 150 ten-minute intervals was taken. You are given the following observed frequencies:
Refer to Exhibit 12-6. The p-value is
A)greater than 0.1
B)between 0.05 and 0.1
C)between .025 and .05
D)between .01 and .025
Unlock Deck
Unlock for access to all 90 flashcards in this deck.
Unlock Deck
k this deck
58
Exhibit 12-7
You want to test whether or not the following sample of 30 observations follows a normal distribution. The mean of the sample equals 11.83, and the standard deviation equals 4.53.
Refer to Exhibit 12-7. The number of intervals or categories used to test the hypothesis for this problem is
A)4
B)5
C)6
D)10
Unlock Deck
Unlock for access to all 90 flashcards in this deck.
Unlock Deck
k this deck
59
Exhibit 12-8
The following shows the number of individuals in a sample of 300 who indicated they support the new tax proposal. We are interested in determining whether or not the opinions of the individuals of the three groups are uniformly distributed.
Refer to Exhibit 12-8. The calculated value for the test statistic equals
A)300
B)4
C)0
D)8
The following shows the number of individuals in a sample of 300 who indicated they support the new tax proposal.
We are interested in determining whether or not the opinions of the individuals of the three groups are uniformly distributed.Refer to Exhibit 12-8. The calculated value for the test statistic equals
A)300
B)4
C)0
D)8
Unlock Deck
Unlock for access to all 90 flashcards in this deck.
Unlock Deck
k this deck
60
Exhibit 12-7
You want to test whether or not the following sample of 30 observations follows a normal distribution. The mean of the sample equals 11.83, and the standard deviation equals 4.53.
Refer to Exhibit 12-7. At 95% confidence, the conclusion of the test is that the
A)data follows a normal distribution
B)data does not follow a normal distribution
C)test is inconclusive
D)None of these alternatives is correct.
Unlock Deck
Unlock for access to all 90 flashcards in this deck.
Unlock Deck
k this deck
61
The personnel department of a large corporation reported sixty resignations during the last year. The following table groups these resignations according to the season in which they occurred: Test to see if the number of resignations is uniform over the four seasons.
Let = 0.05.
Test to see if the number of resignations is uniform over the four seasons.Let = 0.05.
Unlock Deck
Unlock for access to all 90 flashcards in this deck.
Unlock Deck
k this deck
62
Dr. Maria Pecora diet pills are supposed to cause significant weight loss. The following table shows the results of a recent study where some individuals took the diet pills and some did not. We want to see if losing weight is independent of taking the diet pills.
a.Compute the test statistic.
b.Using the p-value approach at 95% confidence, test to determine if weight loss is independent on taking the pill.
c.Use the critical method approach and test for independence.
We want to see if losing weight is independent of taking the diet pills. a.Compute the test statistic.
b.Using the p-value approach at 95% confidence, test to determine if weight loss is independent on taking the pill.
c.Use the critical method approach and test for independence.
Unlock Deck
Unlock for access to all 90 flashcards in this deck.
Unlock Deck
k this deck
63
A group of 500 individuals were asked to cast their votes regarding a particular issue of the Equal Rights Amendment. The following contingency table shows the results of the votes: At = .05 using the p-value approach, test to determine if the votes cast were independent of the sex of the individuals.
At = .05 using the p-value approach, test to determine if the votes cast were independent of the sex of the individuals. Unlock Deck
Unlock for access to all 90 flashcards in this deck.
Unlock Deck
k this deck
64
From a poll of 800 television viewers, the following data have been accumulated as to their levels of education and their preference of television stations. Test at = .05 to determine if the selection of a TV station is dependent upon the level of education. Use the p-value approach.
Test at = .05 to determine if the selection of a TV station is dependent upon the level of education. Use the p-value approach. Unlock Deck
Unlock for access to all 90 flashcards in this deck.
Unlock Deck
k this deck
65
A group of 2000 individuals from 3 different cities were asked whether they owned a foreign or a domestic car. The following contingency table shows the results of the survey. At = 0.05 using the p-value approach, test to determine if the type of car purchased is independent of the city in which the purchasers live.
At = 0.05 using the p-value approach, test to determine if the type of car purchased is independent of the city in which the purchasers live. Unlock Deck
Unlock for access to all 90 flashcards in this deck.
Unlock Deck
k this deck
66
The following table shows the results of recent study regarding gender of individuals and their selected field of study. We want to determine if the selected field of study is independent of gender.
a.Compute the test statistic.
b.Using the p-value approach at 90% confidence, test to see if the field of study is independent of gender.
c.Using the critical method approach at 90% confidence, test for the independence of major and gender.
We want to determine if the selected field of study is independent of gender. a.Compute the test statistic.
b.Using the p-value approach at 90% confidence, test to see if the field of study is independent of gender.
c.Using the critical method approach at 90% confidence, test for the independence of major and gender.
Unlock Deck
Unlock for access to all 90 flashcards in this deck.
Unlock Deck
k this deck
67
A lottery is conducted that involves the random selection of numbers from 0 to 4. To make sure that the lottery is fair, a sample of 250 was taken. The following results were obtained:
a.State the null and alternative hypotheses to be tested.
b.Compute the test statistic.
c.The null hypothesis is to be tested at the 5% level of significance. Determine the critical value from the table.
d.What do you conclude about the fairness of this lottery?
a.State the null and alternative hypotheses to be tested.
b.Compute the test statistic.
c.The null hypothesis is to be tested at the 5% level of significance. Determine the critical value from the table.
d.What do you conclude about the fairness of this lottery?
Unlock Deck
Unlock for access to all 90 flashcards in this deck.
Unlock Deck
k this deck
68
A major automobile manufacturer claimed that the frequencies of repairs on all five models of its cars are the same. A sample of 200 repair services showed the following frequencies on the various makes of cars. At = 0.05, test the manufacturer's claim.
At = 0.05, test the manufacturer's claim. Unlock Deck
Unlock for access to all 90 flashcards in this deck.
Unlock Deck
k this deck
69
Before the rush began for Christmas shopping, a department store had noted that the percentage of its customers who use the store's credit card, the percentage of those who use a major credit card, and the percentage of those who pay cash are the same. During the Christmas rush in a sample of 150 shoppers, 46 used the store's credit card; 43 used a major credit card; and 61 paid cash. With = 0.05, test to see if the methods of payment have changed during the Christmas rush.
Unlock Deck
Unlock for access to all 90 flashcards in this deck.
Unlock Deck
k this deck
70
Before the presidential debates, it was expected that the percentages of registered voters in favor of various candidates would be as follows. After the presidential debates, a random sample of 1200 voters showed that 540 favored the Democratic candidate; 480 were in favor of the Republican candidate; 40 were in favor of the Independent candidate, and 140 were undecided. We want to see if the proportion of voters has changed.
a.Compute the test statistic.
b.Use the p-value approach to test the hypotheses. Let = .05.
c.Using the critical value approach, test the hypotheses. Let = .05.
After the presidential debates, a random sample of 1200 voters showed that 540 favored the Democratic candidate; 480 were in favor of the Republican candidate; 40 were in favor of the Independent candidate, and 140 were undecided. We want to see if the proportion of voters has changed. a.Compute the test statistic.
b.Use the p-value approach to test the hypotheses. Let = .05.
c.Using the critical value approach, test the hypotheses. Let = .05.
Unlock Deck
Unlock for access to all 90 flashcards in this deck.
Unlock Deck
k this deck
71
Shown below is 3 x 2 contingency table with observed values from a sample of 1,500. At 95% confidence, test for independence of the row and column factors.
Unlock Deck
Unlock for access to all 90 flashcards in this deck.
Unlock Deck
k this deck
72
A sample of 150 individuals (males and females) was surveyed, and the individuals were asked to indicate their yearly incomes. Their incomes were categorized as follows. The results of the survey are shown below. We want to determine if yearly income is independent of gender.
a.Compute the test statistic.
b.Using the p-value approach, test to determine if yearly income is independent of gender.
The results of the survey are shown below. We want to determine if yearly income is independent of gender. a.Compute the test statistic.
b.Using the p-value approach, test to determine if yearly income is independent of gender.
Unlock Deck
Unlock for access to all 90 flashcards in this deck.
Unlock Deck
k this deck
73
Last school year, in the school of Business Administration, 30% were Accounting majors, 24% Management majors, 26% Marketing majors, and 20% Economics majors. A sample of 300 students taken from this year's students of the school showed the following number of students in each major: We want to see if there has been a significant change in the number of students in each major.
a.Compute the test statistic.
b.Has there been any significant change in the number of students in each major between the last school year and this school year. Use the p-value approach and let = .05.
We want to see if there has been a significant change in the number of students in each major. a.Compute the test statistic.
b.Has there been any significant change in the number of students in each major between the last school year and this school year. Use the p-value approach and let = .05.
Unlock Deck
Unlock for access to all 90 flashcards in this deck.
Unlock Deck
k this deck
74
Before the start of the Winter Olympics, it was expected that the percentages of medals awarded to the top contenders to be as follows. Midway through the Olympics, of the 120 medals awarded, the following distribution was observed. We want to test to see if there is a significant difference between the expected and actual awards given.
a.Compute the test statistic.
b.Using the p-value approach, test to see if there is a significant difference between the expected and the actual values. Let = .05.
c.At 95% confidence, test for a significant difference using the critical value approach.
Midway through the Olympics, of the 120 medals awarded, the following distribution was observed. We want to test to see if there is a significant difference between the expected and actual awards given. a.Compute the test statistic.
b.Using the p-value approach, test to see if there is a significant difference between the expected and the actual values. Let = .05.
c.At 95% confidence, test for a significant difference using the critical value approach.
Unlock Deck
Unlock for access to all 90 flashcards in this deck.
Unlock Deck
k this deck
75
The makers of Compute-All know that in the past, 40% of their sales were from people under 30 years old, 45% of their sales were from people who are between 30 and 50 years old, and 15% of their sales were from people who are over 50 years old. A sample of 300 customers was taken to see if the market shares had changed. In the sample, 100 of the people were under 30 years old, 150 people were between 30 and 50 years old, and 50 people were over 50 years old.
a.State the null and alternative hypotheses to be tested.
b.Compute the test statistic.
c.The null hypothesis is to be tested at the 1% level of significance. Determine the critical value from the table.
d.What do you conclude?
a.State the null and alternative hypotheses to be tested.
b.Compute the test statistic.
c.The null hypothesis is to be tested at the 1% level of significance. Determine the critical value from the table.
d.What do you conclude?
Unlock Deck
Unlock for access to all 90 flashcards in this deck.
Unlock Deck
k this deck
76
Five hundred randomly selected automobile owners were questioned on the main reason they had purchased their current automobile. The results are given below.
a.State the null and alternative hypotheses for a contingency table test.
b.State the decision rule for the critical value approach. Let = .01.
c.Calculate the 2 test statistic.
d.Give your conclusion for this test.
a.State the null and alternative hypotheses for a contingency table test.
b.State the decision rule for the critical value approach. Let = .01.
c.Calculate the 2 test statistic.
d.Give your conclusion for this test.
Unlock Deck
Unlock for access to all 90 flashcards in this deck.
Unlock Deck
k this deck
77
A medical journal reported the following frequencies of deaths due to cardiac arrest for each day of the week: We want to determine whether the number of deaths is uniform over the week.
a.Compute the test statistic.
b.Using the p-value approach at 95% confidence, test for the uniformity of death over the week.
c.Using the critical value approach, perform the test for uniformity.
We want to determine whether the number of deaths is uniform over the week. a.Compute the test statistic.
b.Using the p-value approach at 95% confidence, test for the uniformity of death over the week.
c.Using the critical value approach, perform the test for uniformity.
Unlock Deck
Unlock for access to all 90 flashcards in this deck.
Unlock Deck
k this deck
78
Two hundred fifty managers with degrees in business administration indicated their fields of concentration as shown below. At
= .01 using the p-value approach, test to determine if the position in management is independent of the major of concentration.
At = .01 using the p-value approach, test to determine if the position in management is independent of the major of concentration.
Unlock Deck
Unlock for access to all 90 flashcards in this deck.
Unlock Deck
k this deck
79
In 2002, forty percent of the students at a major university were Business majors, 35% were Engineering majors and the rest of the students were majoring in other fields. In a sample of 600 students from the same university taken in 2003, two hundred were Business majors, 220 were Engineering majors and the remaining students in the sample were majoring in other fields. At 95% confidence, test to see if there has been a significant change in the proportions between 2002 and 2003.
Unlock Deck
Unlock for access to all 90 flashcards in this deck.
Unlock Deck
k this deck
80
Shown below is 2 x 3 contingency table with observed values from a sample of 500. At 95% confidence using the critical value approach, test for independence of the row and column factors.
Unlock Deck
Unlock for access to all 90 flashcards in this deck.
Unlock Deck
k this deck
Unlock Deck
Unlock for access to all 90 flashcards in this deck.


