Exam 12: Comparing Multiple Proportions, Test of Independence and Goodness of Fit
Exam 1: Data and Statistics98 Questions
Exam 2: Descriptive Statistics: Tabular and Graphical Displays62 Questions
Exam 3: Descriptive Statistics: Numerical Measures173 Questions
Exam 4: Introduction to Probability138 Questions
Exam 5: Discrete Probability Distributions123 Questions
Exam 6: Continuous Probability Distributions174 Questions
Exam 7: Sampling and Sampling Distributions133 Questions
Exam 8: Interval Estimation137 Questions
Exam 9: Hypothesis Tests148 Questions
Exam 10: Inference About Means and Proportions With Two Populations121 Questions
Exam 11: Inferences About Population Variances90 Questions
Exam 12: Comparing Multiple Proportions, Test of Independence and Goodness of Fit90 Questions
Exam 13: Experimental Design and Analysis of Variance115 Questions
Exam 14: Simple Linear Regression146 Questions
Exam 15: Multiple Regression115 Questions
Exam 16: Regression Analysis: Model Building76 Questions
Exam 17: Time Series Analysis and Forecasting68 Questions
Exam 18: Nonparametric Methods81 Questions
Exam 19: Statistical Methods for Quality Control29 Questions
Exam 20: Index Numbers52 Questions
Exam 21: Decision Analysis on Website65 Questions
Exam 22: Sample Survey on Website63 Questions
Select questions type
A medical journal reported the following frequencies of deaths due to cardiac arrest for each day of the week:  We want to determine whether the number of deaths is uniform over the week.
a.Compute the test statistic.
b.Using the p-value approach at 95% confidence, test for the uniformity of death over the week.
c.Using the critical value approach, perform the test for uniformity.
We want to determine whether the number of deaths is uniform over the week.
a.Compute the test statistic.
b.Using the p-value approach at 95% confidence, test for the uniformity of death over the week.
c.Using the critical value approach, perform the test for uniformity.
Free
(Essay)
4.9/5  (32)
(32)
Correct Answer: Verified
a. 2 = 23.25
b.p-value is less than .005; reject H0; the distribution is not uniform
c.critical 2 = 12.592; reject H0
Exhibit 12-4
In the past, 35% of the students at ABC University were in the Business College, 35% of the students were in the Liberal Arts College, and 30% of the students were in the Education College. To see whether or not the proportions have changed, a sample of 300 students was taken. Ninety of the sample students are in the Business College, 120 are in the Liberal Arts College, and 90 are in the Education College.
-Refer to Exhibit 12-4. The p-value is
Free
(Multiple Choice)
4.9/5 (36)
Correct Answer:Verified
A
Exhibit 12-3
In order to determine whether or not a particular medication was effective in curing the common cold, one group of patients was given the medication, while another group received sugar pills. The results of the study are shown below.  We are interested in determining whether or not the medication was effective in curing the common cold.
-Refer to Exhibit 12-3. The expected frequency of those who received medication and were cured is
We are interested in determining whether or not the medication was effective in curing the common cold.
-Refer to Exhibit 12-3. The expected frequency of those who received medication and were cured is
Free
(Multiple Choice)
4.9/5 (37)
Correct Answer:Verified
D
The results of a recent study regarding smoking and three types of illness are shown in the following table. 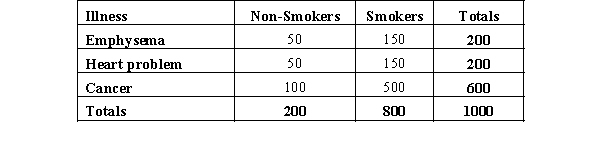 We are interested in determining whether or not illness is independent of smoking.
a.State the null and alternative hypotheses to be tested.
b.Show the contingency table of the expected frequencies and determine the test statistic.
c.The null hypothesis is to be tested at 95% confidence. Determine the critical value for this test.
d.What do you conclude?
We are interested in determining whether or not illness is independent of smoking.
a.State the null and alternative hypotheses to be tested.
b.Show the contingency table of the expected frequencies and determine the test statistic.
c.The null hypothesis is to be tested at 95% confidence. Determine the critical value for this test.
d.What do you conclude?
(Essay)
4.9/5 (37)
The following table shows the results of a study on smoking and three illnesses. We are interested in determining if the proportions smokers in the three categories are different from each other.
 a.Provide the null and the alternative hypotheses.
b.Determine the expected frequencies.
c.Compute the sample proportions.
d.Compute the critical values (CVij).
e.Give your conclusions by providing numerical reasoning.
a.Provide the null and the alternative hypotheses.
b.Determine the expected frequencies.
c.Compute the sample proportions.
d.Compute the critical values (CVij).
e.Give your conclusions by providing numerical reasoning.
(Essay)
4.7/5 (32)
Exhibit 12-8
The following shows the number of individuals in a sample of 300 who indicated they support the new tax proposal.  We are interested in determining whether or not the opinions of the individuals of the three groups are uniformly distributed.
-Refer to Exhibit 12-8. The number of degrees of freedom associated with this problem is
We are interested in determining whether or not the opinions of the individuals of the three groups are uniformly distributed.
-Refer to Exhibit 12-8. The number of degrees of freedom associated with this problem is
(Multiple Choice)
4.8/5 (30)
Prior to the start of the season, it was expected that audience proportions for the four major news networks would be CBS 18.6%, NBC 12.5%, ABC 28.9% and BBC 40%. A recent sample of homes yielded the following viewing audience data. 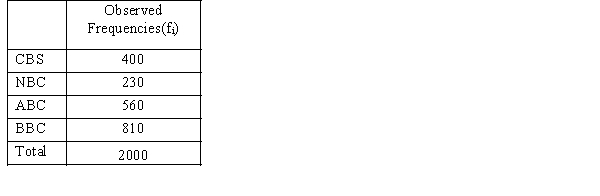 We want to determine whether or not the recent sample supports the expectations of the number of homes of the viewing audience of the four networks.
a.State the null and alternative hypotheses to be tested.
b.Compute the test statistic.
c.The null hypothesis is to be tested at 95% confidence. Determine the critical value for this test.
d.What do you conclude?
We want to determine whether or not the recent sample supports the expectations of the number of homes of the viewing audience of the four networks.
a.State the null and alternative hypotheses to be tested.
b.Compute the test statistic.
c.The null hypothesis is to be tested at 95% confidence. Determine the critical value for this test.
d.What do you conclude?
(Essay)
4.9/5 (34)
Exhibit 12-4
In the past, 35% of the students at ABC University were in the Business College, 35% of the students were in the Liberal Arts College, and 30% of the students were in the Education College. To see whether or not the proportions have changed, a sample of 300 students was taken. Ninety of the sample students are in the Business College, 120 are in the Liberal Arts College, and 90 are in the Education College.
-Refer to Exhibit 12-4. The calculated value for the test statistic equals
(Multiple Choice)
4.7/5 (34)
Exhibit 12-2
Last school year, the student body of a local university consisted of 30% freshmen, 24% sophomores, 26% juniors, and 20% seniors. A sample of 300 students taken from this year's student body showed the following number of students in each classification.  We are interested in determining whether or not there has been a significant change in the classifications between the last school year and this school year.
-Refer to Exhibit 12-2. At 95% confidence, the null hypothesis
We are interested in determining whether or not there has been a significant change in the classifications between the last school year and this school year.
-Refer to Exhibit 12-2. At 95% confidence, the null hypothesis
(Multiple Choice)
4.9/5 (34)
A department store believes that telephone calls come into the switchboard at 10-minute intervals, according to a Poisson distribution. Before ordering new equipment, the store wishes to determine whether the Poisson model is a valid assumption. Records on the number of calls received were kept for a random selection of 150 ten-minute intervals. The results are shown below.  a. What is the average number of calls during these ten-minute intervals?
b. Generate the expected number of calls using a Poisson probability table.c. Give the null and alternative hypotheses for the appropriate test.
d. Determine the number of degrees of freedom for this test.
e. Calculate the value of the test statistic.f. Determine the p-value and state whether or not the Poisson model is a valid model for the phone calls?
a. What is the average number of calls during these ten-minute intervals?
b. Generate the expected number of calls using a Poisson probability table.c. Give the null and alternative hypotheses for the appropriate test.
d. Determine the number of degrees of freedom for this test.
e. Calculate the value of the test statistic.f. Determine the p-value and state whether or not the Poisson model is a valid model for the phone calls?
(Essay)
4.8/5 (43)
Exhibit 12-5
The table below gives beverage preferences for random samples of teens and adults. 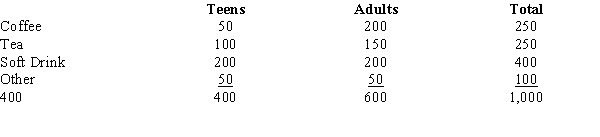 We are asked to test for independence between age (i.e., adult and teen) and drink preferences.
-Refer to Exhibit 12-5. With a .05 level of significance, the critical value for the test is
We are asked to test for independence between age (i.e., adult and teen) and drink preferences.
-Refer to Exhibit 12-5. With a .05 level of significance, the critical value for the test is
(Multiple Choice)
4.8/5 (34)
Exhibit 12-1
When individuals in a sample of 150 were asked whether or not they supported capital punishment, the following information was obtained.  We are interested in determining whether or not the opinions of the individuals (as to Yes, No, and No Opinion) are uniformly distributed.
-Refer to Exhibit 12-1. The expected frequency for each group is
We are interested in determining whether or not the opinions of the individuals (as to Yes, No, and No Opinion) are uniformly distributed.
-Refer to Exhibit 12-1. The expected frequency for each group is
(Multiple Choice)
4.8/5 (36)
Exhibit 12-2
Last school year, the student body of a local university consisted of 30% freshmen, 24% sophomores, 26% juniors, and 20% seniors. A sample of 300 students taken from this year's student body showed the following number of students in each classification. We are interested in determining whether or not there has been a significant change in the classifications between the last school year and this school year.
-Refer to Exhibit 12-2. The p-value is
(Multiple Choice)
4.8/5 (34)
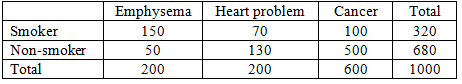
A group of 2000 individuals from 3 different cities were asked whether they owned a foreign or a domestic car. The following contingency table shows the results of the survey.  At = 0.05 using the p-value approach, test to determine if the type of car purchased is independent of the city in which the purchasers live.
(Essay)
4.8/5 (28)
A group of 500 individuals were asked to cast their votes regarding a particular issue of the Equal Rights Amendment. The following contingency table shows the results of the votes: 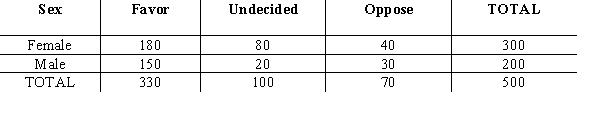 At = .05 using the p-value approach, test to determine if the votes cast were independent of the sex of the individuals.
(Essay)
4.9/5 (35)
We want to determine if the following sample comes from a normal distribution. 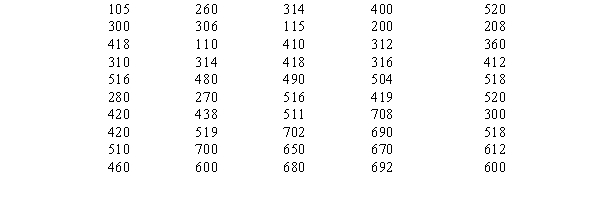 a.Compute the mean and the standard deviation.
b.Compute the test statistic. Hint: divide the distribution into 10 equal intervals.
c.At 95% confidence using the critical value approach, test to determine if the sample comes from a normal population.
d.Compute the p-value.
a.Compute the mean and the standard deviation.
b.Compute the test statistic. Hint: divide the distribution into 10 equal intervals.
c.At 95% confidence using the critical value approach, test to determine if the sample comes from a normal population.
d.Compute the p-value.
(Essay)
4.9/5 (31)
Exhibit 12-3
In order to determine whether or not a particular medication was effective in curing the common cold, one group of patients was given the medication, while another group received sugar pills. The results of the study are shown below. We are interested in determining whether or not the medication was effective in curing the common cold.
-Refer to Exhibit 12-3. The number of degrees of freedom associated with this problem is
(Multiple Choice)
5.0/5 (29)
From a poll of 800 television viewers, the following data have been accumulated as to their levels of education and their preference of television stations. We are interested in determining if the selection of a TV station is independent of the level of education.
Educational Level  a.State the null and the alternative hypotheses.
b.Show the contingency table of the expected frequencies.
c.Compute the test statistic.
d.The null hypothesis is to be tested at 95% confidence. Determine the critical value for this test.
e.Determine the p-value and perform the test.
a.State the null and the alternative hypotheses.
b.Show the contingency table of the expected frequencies.
c.Compute the test statistic.
d.The null hypothesis is to be tested at 95% confidence. Determine the critical value for this test.
e.Determine the p-value and perform the test.
(Essay)
4.8/5 (34)
Exhibit 12-4
In the past, 35% of the students at ABC University were in the Business College, 35% of the students were in the Liberal Arts College, and 30% of the students were in the Education College. To see whether or not the proportions have changed, a sample of 300 students was taken. Ninety of the sample students are in the Business College, 120 are in the Liberal Arts College, and 90 are in the Education College.
-Refer to Exhibit 12-4. This problem is an example of a
(Multiple Choice)
4.8/5 (41)
Filters
- Essay(0)
- Multiple Choice(0)
- Short Answer(0)
- True False(0)
- Matching(0)