Deck 11: Inferences About Population Variances
Full screen (f)
Question
Question
Question
Question
Question
Question
Question
Question
Question
Question
Question
Question
Question
Question
Question
Question
Question
Question
Question
Question
Question
Question
Question
Question
Question
Question
Question
Question
Question
Question
Question
Which of the following has an F distribution?
A)(n - 1)S/
B)S1/S2
C)(n - 1)S1/S2
D)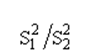
A)(n - 1)S/
B)S1/S2
C)(n - 1)S1/S2
D)
Question
Question
Question
Question
Question
Question
Question
Question
Question
Question
Exhibit 11-6  We want to test the hypothesis that the population variances are equal.
Refer to Exhibit 11-6. The test statistic for this problem equals
A)0.417
B).843
C)2.4
D)1.500
We want to test the hypothesis that the population variances are equal.Refer to Exhibit 11-6. The test statistic for this problem equals
A)0.417
B).843
C)2.4
D)1.500
Question
Question
Exhibit 11-6 We want to test the hypothesis that the population variances are equal.
Refer to Exhibit 11-6. At 95% confidence, the null hypothesis
A)should be rejected
B)should not be rejected
C)should be revised
D)None of these alternatives is correct.
We want to test the hypothesis that the population variances are equal.Refer to Exhibit 11-6. At 95% confidence, the null hypothesis
A)should be rejected
B)should not be rejected
C)should be revised
D)None of these alternatives is correct.
Question
Exhibit 11-5 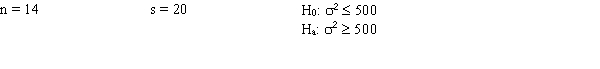
Refer to Exhibit 11-5. The null hypothesis
A)should be rejected
B)should not be rejected
C)should be revised
D)None of these alternatives is correct.
Refer to Exhibit 11-5. The null hypothesis
A)should be rejected
B)should not be rejected
C)should be revised
D)None of these alternatives is correct.
Question
Exhibit 11-4 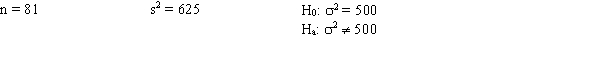
Refer to Exhibit 11-4. At 95% confidence, the null hypothesis
A)should be rejected
B)should not be rejected
C)should be revised
D)None of these alternatives is correct.
Refer to Exhibit 11-4. At 95% confidence, the null hypothesis
A)should be rejected
B)should not be rejected
C)should be revised
D)None of these alternatives is correct.
Question
Question
Exhibit 11-4
Refer to Exhibit 11-4. The p-value is between
A)0.025 and 0.05
B)0.05 and 0.1
C)0.1 and 0.2
D)0.2 and 0.3
Refer to Exhibit 11-4. The p-value is between
A)0.025 and 0.05
B)0.05 and 0.1
C)0.1 and 0.2
D)0.2 and 0.3
Question
Question
Question
Exhibit 11-7  We want to test the hypothesis that population A has a larger variance than population B.
Refer to Exhibit 11-7. The p-value is approximately
A)0.10
B)0.05
C)0.025
D)0.01
We want to test the hypothesis that population A has a larger variance than population B.Refer to Exhibit 11-7. The p-value is approximately
A)0.10
B)0.05
C)0.025
D)0.01
Question
Exhibit 11-5
Refer to Exhibit 11-5. The test statistic for this problem equals
A).63
B)12.68
C)13.33
D)13.66
Refer to Exhibit 11-5. The test statistic for this problem equals
A).63
B)12.68
C)13.33
D)13.66
Question
Question
Exhibit 11-8 
Refer to Exhibit 11-8. The test statistic has a value of
A)20.91
B)24.20
C)24.00
D)20.00
Refer to Exhibit 11-8. The test statistic has a value of
A)20.91
B)24.20
C)24.00
D)20.00
Question
Exhibit 11-6 We want to test the hypothesis that the population variances are equal.
Refer to Exhibit 11-6. The p-value is between
A)0.025 and 0.05
B)0.05 and 0.10
C)0.10 and 0.20
D)0.00 and 0.01
We want to test the hypothesis that the population variances are equal.Refer to Exhibit 11-6. The p-value is between
A)0.025 and 0.05
B)0.05 and 0.10
C)0.10 and 0.20
D)0.00 and 0.01
Question
Exhibit 11-7 We want to test the hypothesis that population A has a larger variance than population B.
Refer to Exhibit 11-7. The test statistic for this problem equals
A)0.4132
B)1.96
C)2.42
D)1.645
We want to test the hypothesis that population A has a larger variance than population B.Refer to Exhibit 11-7. The test statistic for this problem equals
A)0.4132
B)1.96
C)2.42
D)1.645
Question
Exhibit 11-4
Refer to Exhibit 11-4. The test statistic for this problem equals
A)100
B)101.88
C)101.25
D)64
Refer to Exhibit 11-4. The test statistic for this problem equals
A)100
B)101.88
C)101.25
D)64
Question
Question
Question
Exhibit 11-5
Refer to Exhibit 11-5. The null hypothesis is to be tested at the 5% level of significance. The critical value(s) from the table is(are)
A)22.362
B)23.685
C)5.009 and 24.736
D)5.629 and 26.119
Refer to Exhibit 11-5. The null hypothesis is to be tested at the 5% level of significance. The critical value(s) from the table is(are)
A)22.362
B)23.685
C)5.009 and 24.736
D)5.629 and 26.119
Question
Question
Question
It has been suggested that night shift-workers show more variability in their output levels than day workers. Below, you are given the results of two independent random samples. 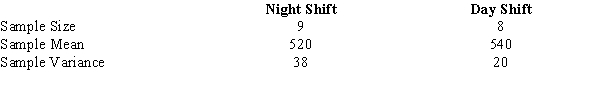
a.State the null and alternative hypotheses to be tested.
b.Compute the test statistic.
c.Determine the p-value.
d.At 95% confidence, what do you conclude?
a.State the null and alternative hypotheses to be tested.
b.Compute the test statistic.
c.Determine the p-value.
d.At 95% confidence, what do you conclude?
Question
Question
A sample of 30 items provided a sample mean of 28 and a sample standard deviation of 6. Test the following hypotheses using = 0.05. What is your conclusion? 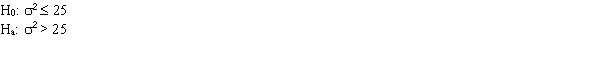
Question
Exhibit 11-8
Refer to Exhibit 11-8. The p-value is
A)less than 0.025
B)less than 0.05
C)less than 0.10
D)greater than 0.10
Refer to Exhibit 11-8. The p-value is
A)less than 0.025
B)less than 0.05
C)less than 0.10
D)greater than 0.10
Question
Question
Question
Exhibit 11-8
Refer to Exhibit 11-8. If the test is to be performed at 95% confidence, the critical value(s) from the table is(are)
A)10.9823 and 36.7897
B)33.9240
C)12.338
D)33.924
Refer to Exhibit 11-8. If the test is to be performed at 95% confidence, the critical value(s) from the table is(are)
A)10.9823 and 36.7897
B)33.9240
C)12.338
D)33.924
Question
Question
A sample of 61 items provided a sample mean of 932, a sample mode of 900, and a sample standard deviation of 11. Test the following hypotheses using = 0.05. What is your conclusion? 
Question
The grades of a sample of 5 students, selected from a large population, are given below. 
a.Determine a point estimate for the variance of the population.
b.Determine a 95% confidence interval for the variance of the population.
c.At 90% confidence, test to determine if the variance of the population is less than or equal to 50.
a.Determine a point estimate for the variance of the population.
b.Determine a 95% confidence interval for the variance of the population.
c.At 90% confidence, test to determine if the variance of the population is less than or equal to 50.
Question
We are interested in determining whether or not the variances of the sales at two small grocery stores are equal. A sample of 16 days of sales at each store indicated the following. 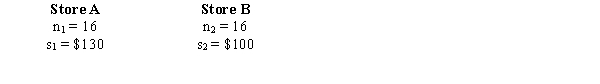 Are the variances of the populations (from which these samples came) equal?
Use = 0.05.
Are the variances of the populations (from which these samples came) equal?Use = 0.05.
Question
At = 0.1, test to see if the population variances from which the following samples were drawn are equal. 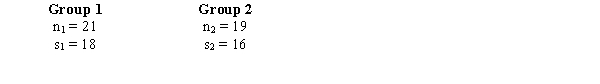
Question
Question
Exhibit 11-8
Refer to Exhibit 11-8. The null hypothesis
A)should be rejected
B)should not be rejected
C)should be revised
D)None of these alternatives is correct.
Refer to Exhibit 11-8. The null hypothesis
A)should be rejected
B)should not be rejected
C)should be revised
D)None of these alternatives is correct.
Question
The president of a bank believes that the variance of the deposits of suburban customers is more than the variance of city customers. Below you are given the results of samples taken from suburban and city customers. 
a.State the null and alternative hypotheses to be tested.
b.Compute the test statistic.
c.Determine the p-value.
d.At 95% confidence, what do you conclude?
a.State the null and alternative hypotheses to be tested.
b.Compute the test statistic.
c.Determine the p-value.
d.At 95% confidence, what do you conclude?
Question
Question
Student advisors are interested in determining if the variances of the grades of day students and night students are the same. The following samples are drawn: 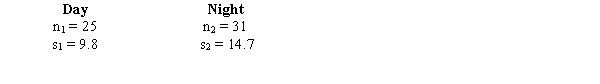 Test the equality of the variances of the populations at 95% confidence.
Test the equality of the variances of the populations at 95% confidence. Question
Question

Unlock Deck
Sign up to unlock the cards in this deck!
Unlock Deck
Unlock Deck
1/90
Play
Full screen (f)
Deck 11: Inferences About Population Variances
1
The random variable for a chi-square distribution may assume
A)any value between -1 to 1
B)any value between - infinity to +infinity
C)any negative value
D)any value greater than zero
A)any value between -1 to 1
B)any value between - infinity to +infinity
C)any negative value
D)any value greater than zero
any value greater than zero
2
A sample of 21 observations yielded a sample variance of 16. If we want to test H0: 2 = 16, the test statistic is
A)20
B)21
C)5
D)50
A)20
B)21
C)5
D)50
20
3
The symbol used for the variance of the population is
A)
B) 2
C)S
D)S2
A)
B) 2
C)S
D)S2
2
4
The chi-square values (for interval estimation) for a sample size of 21 at 95% confidence are
A)9.591 and 34.170
B)2.700 and 19.023
C)8.260 and 37.566
D)-1.96 and 1.96
A)9.591 and 34.170
B)2.700 and 19.023
C)8.260 and 37.566
D)-1.96 and 1.96
Unlock Deck
Unlock for access to all 90 flashcards in this deck.
Unlock Deck
k this deck
5
The symbol used for the variance of the sample is
A)
B) 2
C)S
D)S2
A)
B) 2
C)S
D)S2
Unlock Deck
Unlock for access to all 90 flashcards in this deck.
Unlock Deck
k this deck
6
We are interested in testing whether the variance of a population is significantly less than 1.44. The null hypothesis for this test is
A)Ho: 2 < 1.44
B)Ho: s2 1.44
C)Ho: < 1.20
D)Ho: 2 1.44
A)Ho: 2 < 1.44
B)Ho: s2 1.44
C)Ho: < 1.20
D)Ho: 2 1.44
Unlock Deck
Unlock for access to all 90 flashcards in this deck.
Unlock Deck
k this deck
7
The producer of a certain medicine claims that their bottling equipment is very accurate and that the standard deviation of all their filled bottles is 0.1 ounce or less. A sample of 20 bottles showed a standard deviation of 0.11. The test statistic to test the claim is
A)400
B)22.99
C)4.85
D)20
A)400
B)22.99
C)4.85
D)20
Unlock Deck
Unlock for access to all 90 flashcards in this deck.
Unlock Deck
k this deck
8
To avoid the problem of not having access to Tables of F distribution with values given for the lower tail, the numerator of the test statistic should be the one with
A)the larger sample size
B)the smaller sample size
C)the larger sample variance
D)the smaller sample variance
A)the larger sample size
B)the smaller sample size
C)the larger sample variance
D)the smaller sample variance
Unlock Deck
Unlock for access to all 90 flashcards in this deck.
Unlock Deck
k this deck
9
The manager of the service department of a local car dealership has noted that the service times of a sample of 15 new automobiles has a standard deviation of 4 minutes. A 95% confidence interval estimate for the variance of service times for all their new automobiles is
A)8.576 to 39.796
B)4 to 16
C)4 to 15
D)2.93 to 6.31
A)8.576 to 39.796
B)4 to 16
C)4 to 15
D)2.93 to 6.31
Unlock Deck
Unlock for access to all 90 flashcards in this deck.
Unlock Deck
k this deck
10
A sample of 41 observations yielded a sample standard deviation of 5. If we want to test H0: 2 = 20, the test statistic is
A)100
B)10
C)51.25
D)50
A)100
B)10
C)51.25
D)50
Unlock Deck
Unlock for access to all 90 flashcards in this deck.
Unlock Deck
k this deck
11
A sample of 51 elements is selected to estimate a 95% confidence interval for the variance of the population. The chi-square values to be used for this interval estimation are
A)-1.96 and 1.96
B)32.357 and 71.420
C)34.764 and 67.505
D)12.8786 and 46.9630
A)-1.96 and 1.96
B)32.357 and 71.420
C)34.764 and 67.505
D)12.8786 and 46.9630
Unlock Deck
Unlock for access to all 90 flashcards in this deck.
Unlock Deck
k this deck
12
A random sample of 31 charge sales showed a sample standard deviation of $50. A 90% confidence interval estimate of the population standard deviation is
A)1,715.10 to 4,055.68
B)1,596.45 to 4,466.73
C)39.96 to 66.83
D)41.39 to 63.68
A)1,715.10 to 4,055.68
B)1,596.45 to 4,466.73
C)39.96 to 66.83
D)41.39 to 63.68
Unlock Deck
Unlock for access to all 90 flashcards in this deck.
Unlock Deck
k this deck
13
A sample of n observations is taken from a population. The appropriate chi-square distribution has
A)n degrees of freedom
B)n - 1 degrees of freedom
C)n - 2 degrees of freedom
D)n - 3 degrees of freedom
A)n degrees of freedom
B)n - 1 degrees of freedom
C)n - 2 degrees of freedom
D)n - 3 degrees of freedom
Unlock Deck
Unlock for access to all 90 flashcards in this deck.
Unlock Deck
k this deck
14
The manager of the service department of a local car dealership has noted that the service times of a sample of 30 new automobiles has a standard deviation of 6 minutes. A 95% confidence interval estimate for the standard deviation of the service times for all their new automobiles is
A)16.047 to 45.722
B)4.778 to 8.066
C)2.93 to 6.31
D)22.833 to 65.059
A)16.047 to 45.722
B)4.778 to 8.066
C)2.93 to 6.31
D)22.833 to 65.059
Unlock Deck
Unlock for access to all 90 flashcards in this deck.
Unlock Deck
k this deck
15
A sample of 20 cans of tomato juice showed a standard deviation of 0.4 ounces. A 95% confidence interval estimate of the variance for the population is
A)0.2313 to 0.8533
B)0.2224 to 0.7924
C)0.3042 to 0.5843
D)0.0925 to 0.3413
A)0.2313 to 0.8533
B)0.2224 to 0.7924
C)0.3042 to 0.5843
D)0.0925 to 0.3413
Unlock Deck
Unlock for access to all 90 flashcards in this deck.
Unlock Deck
k this deck
16
The bottler of a certain soft drink claims their equipment to be accurate and that the variance of all filled bottles is 0.05 or less. The null hypothesis in a test to confirm the claim would be written as
A)H0: 2 0.05
B)H0: 2 > 0.05
C)H0: 2 < 0.05
D)H0: 2 0.05
A)H0: 2 0.05
B)H0: 2 > 0.05
C)H0: 2 < 0.05
D)H0: 2 0.05
Unlock Deck
Unlock for access to all 90 flashcards in this deck.
Unlock Deck
k this deck
17
We are interested in testing to see if the variance of a population is less than 7. The correct null hypothesis is
A) < 7
B) 2 7
C)S < 49
D)S > 49
A) < 7
B) 2 7
C)S < 49
D)S > 49
Unlock Deck
Unlock for access to all 90 flashcards in this deck.
Unlock Deck
k this deck
18
The value of F.05 with 8 numerator and 19 denominator degrees of freedom is
A)2.48
B)2.58
C)3.63
D)2.96
A)2.48
B)2.58
C)3.63
D)2.96
Unlock Deck
Unlock for access to all 90 flashcards in this deck.
Unlock Deck
k this deck
19
For an F distribution, the number of degrees of freedom for the numerator
A)must be larger than the number of degrees for the denominator
B)must be smaller than the number of degrees of freedom for the denominator
C)must be equal to the number of degrees of freedom for the denominator
D)can be larger, smaller, or equal to the number of degrees of freedom for the denominator
Unlock Deck
Unlock for access to all 90 flashcards in this deck.
Unlock Deck
k this deck
20
The producer of a certain bottling equipment claims that the variance of all their filled bottles is 0.027 or less. A sample of 30 bottles showed a standard deviation of 0.2. The p-value for the test is
A)between 0.025 to 0.05
B)between 0.05 to 0.01
C)0.05
D)0.025
A)between 0.025 to 0.05
B)between 0.05 to 0.01
C)0.05
D)0.025
Unlock Deck
Unlock for access to all 90 flashcards in this deck.
Unlock Deck
k this deck
21
We are interested in testing whether the variance of a population is significantly more than 625. The null hypothesis for this test is
A)Ho: 2 > 625
B)Ho: 2 ? 625
C)Ho: 2 ? 625
D)Ho: 2 ? 25
A)Ho: 2 > 625
B)Ho: 2 ? 625
C)Ho: 2 ? 625
D)Ho: 2 ? 25
Unlock Deck
Unlock for access to all 90 flashcards in this deck.
Unlock Deck
k this deck
22
The 95% confidence interval estimate for a population variance when a sample variance of 324 is obtained from a sample of 81 items is
A)14.14 to 174.94
B)243.087 to 453.518
C)16.42 to 194.35
D)15.591 to 21.296
A)14.14 to 174.94
B)243.087 to 453.518
C)16.42 to 194.35
D)15.591 to 21.296
Unlock Deck
Unlock for access to all 90 flashcards in this deck.
Unlock Deck
k this deck
23
Exhibit 11-1
Last year, the standard deviation of the ages of the students at UA was 1.8 years. Recently, a sample of 61 students had a standard deviation of 2.1 years. We are interested in testing to see if there has been a significant change in the standard deviation of the ages of the students at UA.
Refer to Exhibit 11-1. The p-value for this test is
A)0.05
B)between 0.025 and .05
C)between .05 and .01
D)1.96
Unlock Deck
Unlock for access to all 90 flashcards in this deck.
Unlock Deck
k this deck
24
To avoid the problem of not having access to tables of the F distribution with values given for the lower tail when a two-tailed test is required, let the smaller sample variance be
A)the denominator of the test statistic
B)the numerator of the test statistic
C)at least one
D)None of these alternatives is correct.
A)the denominator of the test statistic
B)the numerator of the test statistic
C)at least one
D)None of these alternatives is correct.
Unlock Deck
Unlock for access to all 90 flashcards in this deck.
Unlock Deck
k this deck
25
The value of F0.01 with 9 numerator and 20 denominator degrees of freedom is
A)2.39
B)2.94
C)2.91
D)3.46
A)2.39
B)2.94
C)2.91
D)3.46
Unlock Deck
Unlock for access to all 90 flashcards in this deck.
Unlock Deck
k this deck
26
The critical value of F at 95% confidence when there is a sample size of 21 for the sample with the smaller variance, and there is a sample size of 9 for the sample with the larger sample variance is
A)2.45
B)2.94
C)2.37
D)2.10
A)2.45
B)2.94
C)2.37
D)2.10
Unlock Deck
Unlock for access to all 90 flashcards in this deck.
Unlock Deck
k this deck
27
Exhibit 11-1
Last year, the standard deviation of the ages of the students at UA was 1.8 years. Recently, a sample of 61 students had a standard deviation of 2.1 years. We are interested in testing to see if there has been a significant change in the standard deviation of the ages of the students at UA.
Refer to Exhibit 11-1. The test statistic is
A)44.08
B)79.08
C)81.67
D)3.24
Unlock Deck
Unlock for access to all 90 flashcards in this deck.
Unlock Deck
k this deck
28
A sample of 60 items from population 1 has a sample variance of 8 while a sample of 40 items from population 2 has a sample variance of 10. If we test whether the variances of the two populations are equal, the test statistic will have a value of
A)0.8
B)1.56
C)1.5
D)1.25
A)0.8
B)1.56
C)1.5
D)1.25
Unlock Deck
Unlock for access to all 90 flashcards in this deck.
Unlock Deck
k this deck
29
The sampling distribution used when making inferences about a single population's variance is
A)an F distribution
B)a t distribution
C)a chi-square distribution
D)a normal distribution
A)an F distribution
B)a t distribution
C)a chi-square distribution
D)a normal distribution
Unlock Deck
Unlock for access to all 90 flashcards in this deck.
Unlock Deck
k this deck
30
The sampling distribution of the ratio of two independent sample variances taken from normal populations with equal variances is
A)an F distribution
B)a chi-square distribution
C)a t distribution
D)a normal distribution
A)an F distribution
B)a chi-square distribution
C)a t distribution
D)a normal distribution
Unlock Deck
Unlock for access to all 90 flashcards in this deck.
Unlock Deck
k this deck
31
Which of the following has an F distribution?
A)(n - 1)S/
B)S1/S2
C)(n - 1)S1/S2
D)
A)(n - 1)S/
B)S1/S2
C)(n - 1)S1/S2
D)
Unlock Deck
Unlock for access to all 90 flashcards in this deck.
Unlock Deck
k this deck
32
The chi-square value for a one-tailed (upper tail) hypothesis test at 95% confidence and a sample size of 25 is
A)33.196
B)36.415
C)39.364
D)37.652
A)33.196
B)36.415
C)39.364
D)37.652
Unlock Deck
Unlock for access to all 90 flashcards in this deck.
Unlock Deck
k this deck
33
The 90% confidence interval estimate for a population standard deviation when a sample variance of 50 is obtained from a sample of 15 items is
A)4.18 to 15.07
B)5.18 to 11.15
C)5.44 to 10.32
D)29.55 to 106.53
A)4.18 to 15.07
B)5.18 to 11.15
C)5.44 to 10.32
D)29.55 to 106.53
Unlock Deck
Unlock for access to all 90 flashcards in this deck.
Unlock Deck
k this deck
34
Which of the following has a chi-square distribution?
A)(n - 1) 2/S2
B)(n - 2) 2/S2
C)(n - 1)S/
D)(n - 1)S2/ 2
A)(n - 1) 2/S2
B)(n - 2) 2/S2
C)(n - 1)S/
D)(n - 1)S2/ 2
Unlock Deck
Unlock for access to all 90 flashcards in this deck.
Unlock Deck
k this deck
35
A sample of 61 observations yielded a sample standard deviation of 6. If we want to test Ho: 2 = 40, the test statistic is
A)54
B)9.15
C)54.90
D)9
A)54
B)9.15
C)54.90
D)9
Unlock Deck
Unlock for access to all 90 flashcards in this deck.
Unlock Deck
k this deck
36
The 99% confidence interval estimate for a population variance when a sample standard deviation of 12 is obtained from a sample of 10 items is
A)4.58 to 62.25
B)46.53 to 422.17
C)54.94 to 747.01
D)62.04 to 562.89
A)4.58 to 62.25
B)46.53 to 422.17
C)54.94 to 747.01
D)62.04 to 562.89
Unlock Deck
Unlock for access to all 90 flashcards in this deck.
Unlock Deck
k this deck
37
The chi-square value for a one-tailed test (lower tail) when the level of significance is 0.1 and the sample size is 15 is
A)21.064
B)23.685
C)7.785
D)6.571
A)21.064
B)23.685
C)7.785
D)6.571
Unlock Deck
Unlock for access to all 90 flashcards in this deck.
Unlock Deck
k this deck
38
A sample of 21 elements is selected to estimate a 90% confidence interval for the variance of the population. The chi-square value(s) to be used for this interval estimation is (are)
A)-1.96 and 1.96
B)12.443
C)10.851 and 31.410
D)12.443 and 28.412
A)-1.96 and 1.96
B)12.443
C)10.851 and 31.410
D)12.443 and 28.412
Unlock Deck
Unlock for access to all 90 flashcards in this deck.
Unlock Deck
k this deck
39
The sampling distribution of the quantity (n-1)s2/ 2is the
A)chi-square distribution
B)normal distribution
C)F distribution
D)t distribution
A)chi-square distribution
B)normal distribution
C)F distribution
D)t distribution
Unlock Deck
Unlock for access to all 90 flashcards in this deck.
Unlock Deck
k this deck
40
The sampling distribution of the ratio of independent sample variances extracted from two normal populations with equal variances is the
A)chi-square distribution
B)normal distribution
C)Z distribution
D)t distribution
A)chi-square distribution
B)normal distribution
C)Z distribution
D)t distribution
Unlock Deck
Unlock for access to all 90 flashcards in this deck.
Unlock Deck
k this deck
41
Exhibit 11-6 We want to test the hypothesis that the population variances are equal.
Refer to Exhibit 11-6. The test statistic for this problem equals
A)0.417
B).843
C)2.4
D)1.500
We want to test the hypothesis that the population variances are equal.Refer to Exhibit 11-6. The test statistic for this problem equals
A)0.417
B).843
C)2.4
D)1.500
Unlock Deck
Unlock for access to all 90 flashcards in this deck.
Unlock Deck
k this deck
42
Exhibit 11-3
The contents of a sample of 26 cans of apple juice showed a standard deviation of 0.06 ounces. We are interested in testing to determine whether the variance of the population is significantly more than 0.003.
Refer to Exhibit 11-3. The p-value for this test is
A)0.05
B)greater than 0.10
C)less than 0.10
D)1.96
Unlock Deck
Unlock for access to all 90 flashcards in this deck.
Unlock Deck
k this deck
43
Exhibit 11-6 We want to test the hypothesis that the population variances are equal.
Refer to Exhibit 11-6. At 95% confidence, the null hypothesis
A)should be rejected
B)should not be rejected
C)should be revised
D)None of these alternatives is correct.
We want to test the hypothesis that the population variances are equal.Refer to Exhibit 11-6. At 95% confidence, the null hypothesis
A)should be rejected
B)should not be rejected
C)should be revised
D)None of these alternatives is correct.
Unlock Deck
Unlock for access to all 90 flashcards in this deck.
Unlock Deck
k this deck
44
Exhibit 11-5
Refer to Exhibit 11-5. The null hypothesis
A)should be rejected
B)should not be rejected
C)should be revised
D)None of these alternatives is correct.
Refer to Exhibit 11-5. The null hypothesis
A)should be rejected
B)should not be rejected
C)should be revised
D)None of these alternatives is correct.
Unlock Deck
Unlock for access to all 90 flashcards in this deck.
Unlock Deck
k this deck
45
Exhibit 11-4
Refer to Exhibit 11-4. At 95% confidence, the null hypothesis
A)should be rejected
B)should not be rejected
C)should be revised
D)None of these alternatives is correct.
Refer to Exhibit 11-4. At 95% confidence, the null hypothesis
A)should be rejected
B)should not be rejected
C)should be revised
D)None of these alternatives is correct.
Unlock Deck
Unlock for access to all 90 flashcards in this deck.
Unlock Deck
k this deck
46
Exhibit 11-3
The contents of a sample of 26 cans of apple juice showed a standard deviation of 0.06 ounces. We are interested in testing to determine whether the variance of the population is significantly more than 0.003.
Refer to Exhibit 11-3. The test statistic is
A)1.2
B)31.2
C)30
D)500
The contents of a sample of 26 cans of apple juice showed a standard deviation of 0.06 ounces. We are interested in testing to determine whether the variance of the population is significantly more than 0.003.
Refer to Exhibit 11-3. The test statistic is
A)1.2
B)31.2
C)30
D)500
Unlock Deck
Unlock for access to all 90 flashcards in this deck.
Unlock Deck
k this deck
47
Exhibit 11-4
Refer to Exhibit 11-4. The p-value is between
A)0.025 and 0.05
B)0.05 and 0.1
C)0.1 and 0.2
D)0.2 and 0.3
Refer to Exhibit 11-4. The p-value is between
A)0.025 and 0.05
B)0.05 and 0.1
C)0.1 and 0.2
D)0.2 and 0.3
Unlock Deck
Unlock for access to all 90 flashcards in this deck.
Unlock Deck
k this deck
48
Exhibit 11-2
We are interested in determining whether or not the variances of the sales at two music stores (A and B) are equal. A sample of 26 days of sales at store A has a sample standard deviation of 30 while a sample of 16 days of sales from store B has a sample standard deviation of 20.
Refer to Exhibit 11-2. At 95% confidence the null hypothesis
A)should be rejected
B)should not be rejected
C)should be revised
D)None of these alternatives is correct.
Unlock Deck
Unlock for access to all 90 flashcards in this deck.
Unlock Deck
k this deck
49
Exhibit 11-3
The contents of a sample of 26 cans of apple juice showed a standard deviation of 0.06 ounces. We are interested in testing to determine whether the variance of the population is significantly more than 0.003.
Refer to Exhibit 11-3. At 95% confidence, the null hypothesis
A)should be rejected
B)should not be rejected
C)should be revised
D)None of these alternatives is correct.
Unlock Deck
Unlock for access to all 90 flashcards in this deck.
Unlock Deck
k this deck
50
Exhibit 11-7 We want to test the hypothesis that population A has a larger variance than population B.
Refer to Exhibit 11-7. The p-value is approximately
A)0.10
B)0.05
C)0.025
D)0.01
We want to test the hypothesis that population A has a larger variance than population B.Refer to Exhibit 11-7. The p-value is approximately
A)0.10
B)0.05
C)0.025
D)0.01
Unlock Deck
Unlock for access to all 90 flashcards in this deck.
Unlock Deck
k this deck
51
Exhibit 11-5
Refer to Exhibit 11-5. The test statistic for this problem equals
A).63
B)12.68
C)13.33
D)13.66
Refer to Exhibit 11-5. The test statistic for this problem equals
A).63
B)12.68
C)13.33
D)13.66
Unlock Deck
Unlock for access to all 90 flashcards in this deck.
Unlock Deck
k this deck
52
Exhibit 11-1
Last year, the standard deviation of the ages of the students at UA was 1.8 years. Recently, a sample of 61 students had a standard deviation of 2.1 years. We are interested in testing to see if there has been a significant change in the standard deviation of the ages of the students at UA.
Refer to Exhibit 11-1. At 95% confidence the null hypothesis
A)should be rejected
B)should not be rejected
C)should be revised
D)None of these alternatives is correct.
Unlock Deck
Unlock for access to all 90 flashcards in this deck.
Unlock Deck
k this deck
53
Exhibit 11-8
Refer to Exhibit 11-8. The test statistic has a value of
A)20.91
B)24.20
C)24.00
D)20.00
Refer to Exhibit 11-8. The test statistic has a value of
A)20.91
B)24.20
C)24.00
D)20.00
Unlock Deck
Unlock for access to all 90 flashcards in this deck.
Unlock Deck
k this deck
54
Exhibit 11-6 We want to test the hypothesis that the population variances are equal.
Refer to Exhibit 11-6. The p-value is between
A)0.025 and 0.05
B)0.05 and 0.10
C)0.10 and 0.20
D)0.00 and 0.01
We want to test the hypothesis that the population variances are equal.Refer to Exhibit 11-6. The p-value is between
A)0.025 and 0.05
B)0.05 and 0.10
C)0.10 and 0.20
D)0.00 and 0.01
Unlock Deck
Unlock for access to all 90 flashcards in this deck.
Unlock Deck
k this deck
55
Exhibit 11-7 We want to test the hypothesis that population A has a larger variance than population B.
Refer to Exhibit 11-7. The test statistic for this problem equals
A)0.4132
B)1.96
C)2.42
D)1.645
We want to test the hypothesis that population A has a larger variance than population B.Refer to Exhibit 11-7. The test statistic for this problem equals
A)0.4132
B)1.96
C)2.42
D)1.645
Unlock Deck
Unlock for access to all 90 flashcards in this deck.
Unlock Deck
k this deck
56
Exhibit 11-4
Refer to Exhibit 11-4. The test statistic for this problem equals
A)100
B)101.88
C)101.25
D)64
Refer to Exhibit 11-4. The test statistic for this problem equals
A)100
B)101.88
C)101.25
D)64
Unlock Deck
Unlock for access to all 90 flashcards in this deck.
Unlock Deck
k this deck
57
Exhibit 11-2
We are interested in determining whether or not the variances of the sales at two music stores (A and B) are equal. A sample of 26 days of sales at store A has a sample standard deviation of 30 while a sample of 16 days of sales from store B has a sample standard deviation of 20.
Refer to Exhibit 11-2. The test statistic is
A)1.50
B)0.67
C)1.56
D)2.25
Unlock Deck
Unlock for access to all 90 flashcards in this deck.
Unlock Deck
k this deck
58
Exhibit 11-2
We are interested in determining whether or not the variances of the sales at two music stores (A and B) are equal. A sample of 26 days of sales at store A has a sample standard deviation of 30 while a sample of 16 days of sales from store B has a sample standard deviation of 20.
Refer to Exhibit 11-2. The p-value for this test is
A)between 0.05 and 0.10
B)between 0.10 and 0.2
C)between 0.2 and 0.3
D)None of these alternatives is correct.
Unlock Deck
Unlock for access to all 90 flashcards in this deck.
Unlock Deck
k this deck
59
Exhibit 11-5
Refer to Exhibit 11-5. The null hypothesis is to be tested at the 5% level of significance. The critical value(s) from the table is(are)
A)22.362
B)23.685
C)5.009 and 24.736
D)5.629 and 26.119
Refer to Exhibit 11-5. The null hypothesis is to be tested at the 5% level of significance. The critical value(s) from the table is(are)
A)22.362
B)23.685
C)5.009 and 24.736
D)5.629 and 26.119
Unlock Deck
Unlock for access to all 90 flashcards in this deck.
Unlock Deck
k this deck
60
Exhibit 11-3
The contents of a sample of 26 cans of apple juice showed a standard deviation of 0.06 ounces. We are interested in testing to determine whether the variance of the population is significantly more than 0.003.
-Refer to Exhibit 11-3. The null hypothesis is
A)S2 > 0.003
B)S2 0.003
C) 2 > 0.003
D) 2 0.003
Unlock Deck
Unlock for access to all 90 flashcards in this deck.
Unlock Deck
k this deck
61
A random sample of 25 employees of a local utility firm showed that their monthly incomes had a sample standard deviation of $112. Provide a 90% confidence interval estimate for the standard deviation of the incomes for all the firm's employees.
Unlock Deck
Unlock for access to all 90 flashcards in this deck.
Unlock Deck
k this deck
62
It has been suggested that night shift-workers show more variability in their output levels than day workers. Below, you are given the results of two independent random samples.
a.State the null and alternative hypotheses to be tested.
b.Compute the test statistic.
c.Determine the p-value.
d.At 95% confidence, what do you conclude?
a.State the null and alternative hypotheses to be tested.
b.Compute the test statistic.
c.Determine the p-value.
d.At 95% confidence, what do you conclude?
Unlock Deck
Unlock for access to all 90 flashcards in this deck.
Unlock Deck
k this deck
63
An egg packing company has stated that the standard deviation of the weights of their grade A large eggs is 0.07 ounces or less. The sample variance for 51 eggs was 0.0065 ounces. Can this sample result confirm the company's claim?
Use = 0.1.
Use = 0.1.
Unlock Deck
Unlock for access to all 90 flashcards in this deck.
Unlock Deck
k this deck
64
A sample of 30 items provided a sample mean of 28 and a sample standard deviation of 6. Test the following hypotheses using = 0.05. What is your conclusion?
Unlock Deck
Unlock for access to all 90 flashcards in this deck.
Unlock Deck
k this deck
65
Exhibit 11-8
Refer to Exhibit 11-8. The p-value is
A)less than 0.025
B)less than 0.05
C)less than 0.10
D)greater than 0.10
Refer to Exhibit 11-8. The p-value is
A)less than 0.025
B)less than 0.05
C)less than 0.10
D)greater than 0.10
Unlock Deck
Unlock for access to all 90 flashcards in this deck.
Unlock Deck
k this deck
66
The standard deviation of the daily temperatures in Honolulu last year was 4 degrees Fahrenheit. A random sample of 25 days resulted in a standard deviation of 5.8 degrees Fahrenheit. Has there been a significant increase in the variance of the temperatures? Use = 0.05.
Unlock Deck
Unlock for access to all 90 flashcards in this deck.
Unlock Deck
k this deck
67
The standard deviation of the ages of a sample of 16 executives from the northern states was 8.2 years; while the standard deviation of the ages of a sample of 25 executives from the southern states was 12.8 years. At = 0.1, test to see if there is any difference in the standard deviations of the ages of all the northern and southern executives.
Unlock Deck
Unlock for access to all 90 flashcards in this deck.
Unlock Deck
k this deck
68
Exhibit 11-8
Refer to Exhibit 11-8. If the test is to be performed at 95% confidence, the critical value(s) from the table is(are)
A)10.9823 and 36.7897
B)33.9240
C)12.338
D)33.924
Refer to Exhibit 11-8. If the test is to be performed at 95% confidence, the critical value(s) from the table is(are)
A)10.9823 and 36.7897
B)33.9240
C)12.338
D)33.924
Unlock Deck
Unlock for access to all 90 flashcards in this deck.
Unlock Deck
k this deck
69
A random sample of 41 scores of students taking the ACT test showed a standard deviation of 8 points. Provide a 98% confidence interval estimate for the standard deviation of all the ACT test scores.
Unlock Deck
Unlock for access to all 90 flashcards in this deck.
Unlock Deck
k this deck
70
A sample of 61 items provided a sample mean of 932, a sample mode of 900, and a sample standard deviation of 11. Test the following hypotheses using = 0.05. What is your conclusion?
Unlock Deck
Unlock for access to all 90 flashcards in this deck.
Unlock Deck
k this deck
71
The grades of a sample of 5 students, selected from a large population, are given below.
a.Determine a point estimate for the variance of the population.
b.Determine a 95% confidence interval for the variance of the population.
c.At 90% confidence, test to determine if the variance of the population is less than or equal to 50.
a.Determine a point estimate for the variance of the population.
b.Determine a 95% confidence interval for the variance of the population.
c.At 90% confidence, test to determine if the variance of the population is less than or equal to 50.
Unlock Deck
Unlock for access to all 90 flashcards in this deck.
Unlock Deck
k this deck
72
We are interested in determining whether or not the variances of the sales at two small grocery stores are equal. A sample of 16 days of sales at each store indicated the following. Are the variances of the populations (from which these samples came) equal?
Use = 0.05.
Are the variances of the populations (from which these samples came) equal?Use = 0.05.
Unlock Deck
Unlock for access to all 90 flashcards in this deck.
Unlock Deck
k this deck
73
At = 0.1, test to see if the population variances from which the following samples were drawn are equal.
Unlock Deck
Unlock for access to all 90 flashcards in this deck.
Unlock Deck
k this deck
74
A lumber company has claimed that the standard deviation for the lengths of their 6 foot boards is 0.5 inches or less. To test their claim, a random sample of 17 six-foot boards is selected; and it is determined that the standard deviation of the sample is 0.4. Do the results of the sample support the company's claim? Use = 0.1.
Unlock Deck
Unlock for access to all 90 flashcards in this deck.
Unlock Deck
k this deck
75
Exhibit 11-8
Refer to Exhibit 11-8. The null hypothesis
A)should be rejected
B)should not be rejected
C)should be revised
D)None of these alternatives is correct.
Refer to Exhibit 11-8. The null hypothesis
A)should be rejected
B)should not be rejected
C)should be revised
D)None of these alternatives is correct.
Unlock Deck
Unlock for access to all 90 flashcards in this deck.
Unlock Deck
k this deck
76
The president of a bank believes that the variance of the deposits of suburban customers is more than the variance of city customers. Below you are given the results of samples taken from suburban and city customers.
a.State the null and alternative hypotheses to be tested.
b.Compute the test statistic.
c.Determine the p-value.
d.At 95% confidence, what do you conclude?
a.State the null and alternative hypotheses to be tested.
b.Compute the test statistic.
c.Determine the p-value.
d.At 95% confidence, what do you conclude?
Unlock Deck
Unlock for access to all 90 flashcards in this deck.
Unlock Deck
k this deck
77
A sample of 15 items provides a sample mean of 18 and a sample variance of 16. Compute a 95% confidence interval estimate for the standard deviation of the population.
Unlock Deck
Unlock for access to all 90 flashcards in this deck.
Unlock Deck
k this deck
78
Student advisors are interested in determining if the variances of the grades of day students and night students are the same. The following samples are drawn: Test the equality of the variances of the populations at 95% confidence.
Test the equality of the variances of the populations at 95% confidence. Unlock Deck
Unlock for access to all 90 flashcards in this deck.
Unlock Deck
k this deck
79
A random sample of 21 checking accounts at a bank showed an average daily balance of $430 with a standard deviation of $50.
a.Provide a 95% confidence interval estimate of the variance of the population of the checking accounts.
b.Provide a 95% confidence interval estimate of the standard deviation of the population of the checking accounts.
a.Provide a 95% confidence interval estimate of the variance of the population of the checking accounts.
b.Provide a 95% confidence interval estimate of the standard deviation of the population of the checking accounts.
Unlock Deck
Unlock for access to all 90 flashcards in this deck.
Unlock Deck
k this deck
80
A machine produces pipes used in airplanes. The average length of the pipe is 16 inches. The acceptable variance for the length is .3 inches. A sample of 25 pipes was taken. The average length in the sample was 15.95 inches with a variance of .4 inches.
a.Construct a 95% confidence interval for the population variance.
b.State the null and alternative hypotheses to be tested.
c.Compute the test statistic.
d.The null hypothesis is to be tested at the 5% level of significance. State the decision rule for the test using the critical value approach.
e.What do you conclude about the population variance?
Unlock Deck
Unlock for access to all 90 flashcards in this deck.
Unlock Deck
k this deck
Unlock Deck
Unlock for access to all 90 flashcards in this deck.


