Exam 11: Inferences About Population Variances
Exam 1: Data and Statistics98 Questions
Exam 2: Descriptive Statistics: Tabular and Graphical Displays62 Questions
Exam 3: Descriptive Statistics: Numerical Measures173 Questions
Exam 4: Introduction to Probability138 Questions
Exam 5: Discrete Probability Distributions123 Questions
Exam 6: Continuous Probability Distributions174 Questions
Exam 7: Sampling and Sampling Distributions133 Questions
Exam 8: Interval Estimation137 Questions
Exam 9: Hypothesis Tests148 Questions
Exam 10: Inference About Means and Proportions With Two Populations121 Questions
Exam 11: Inferences About Population Variances90 Questions
Exam 12: Comparing Multiple Proportions, Test of Independence and Goodness of Fit90 Questions
Exam 13: Experimental Design and Analysis of Variance115 Questions
Exam 14: Simple Linear Regression146 Questions
Exam 15: Multiple Regression115 Questions
Exam 16: Regression Analysis: Model Building76 Questions
Exam 17: Time Series Analysis and Forecasting68 Questions
Exam 18: Nonparametric Methods81 Questions
Exam 19: Statistical Methods for Quality Control29 Questions
Exam 20: Index Numbers52 Questions
Exam 21: Decision Analysis on Website65 Questions
Exam 22: Sample Survey on Website63 Questions
Select questions type
The standard deviation of the ages of a sample of 16 executives from the northern states was 8.2 years; while the standard deviation of the ages of a sample of 25 executives from the southern states was 12.8 years. At = 0.1, test to see if there is any difference in the standard deviations of the ages of all the northern and southern executives.
Free
(Essay)
4.7/5  (33)
(33)
Correct Answer: Verified
Since F = 2.44 > 2.28, reject H0
p-value is between .05 and 0.1
The sampling distribution of the ratio of independent sample variances extracted from two normal populations with equal variances is the
Free
(Multiple Choice)
4.8/5 (29)
Correct Answer:Verified
C
Exhibit 11-8  -Refer to Exhibit 11-8. The p-value is
Free
(Multiple Choice)
4.9/5 (37)
Correct Answer:Verified
D
The bottler of a certain soft drink claims their equipment to be accurate and that the variance of all filled bottles is 0.05 or less. The null hypothesis in a test to confirm the claim would be written as
(Multiple Choice)
4.9/5 (39)
A random sample of 41 scores of students taking the ACT test showed a standard deviation of 8 points. Provide a 98% confidence interval estimate for the standard deviation of all the ACT test scores.
(Short Answer)
4.8/5 (33)
ACT scores of a sample of UTC students are shown below. 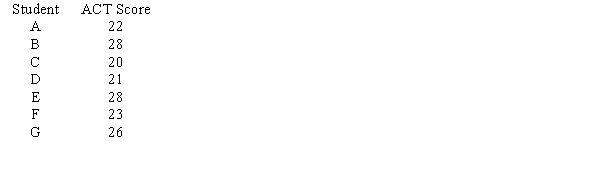 a.Compute the mean and the variance.
b.At 95% confidence, test to determine whether or not the variance of the ACT scores of the population of UTC students is significantly more than 8.
a.Compute the mean and the variance.
b.At 95% confidence, test to determine whether or not the variance of the ACT scores of the population of UTC students is significantly more than 8.
(Essay)
4.9/5 (38)
Exhibit 11-3
The contents of a sample of 26 cans of apple juice showed a standard deviation of 0.06 ounces. We are interested in testing to determine whether the variance of the population is significantly more than 0.003.
-Refer to Exhibit 11-3. The test statistic is
(Multiple Choice)
4.8/5 (33)
Exhibit 11-1
Last year, the standard deviation of the ages of the students at UA was 1.8 years. Recently, a sample of 61 students had a standard deviation of 2.1 years. We are interested in testing to see if there has been a significant change in the standard deviation of the ages of the students at UA.
-Refer to Exhibit 11-1. The test statistic is
(Multiple Choice)
4.8/5 (42)
Student advisors are interested in determining if the variances of the grades of day students and night students are the same. The following samples are drawn: 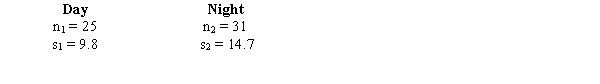 Test the equality of the variances of the populations at 95% confidence.
(Essay)
4.9/5 (42)
Exhibit 11-2
We are interested in determining whether or not the variances of the sales at two music stores (A and B) are equal. A sample of 26 days of sales at store A has a sample standard deviation of 30 while a sample of 16 days of sales from store B has a sample standard deviation of 20.
-Refer to Exhibit 11-2. The test statistic is
(Multiple Choice)
4.8/5 (37)
The manager of the service department of a local car dealership has noted that the service times of a sample of 15 new automobiles has a standard deviation of 4 minutes. A 95% confidence interval estimate for the variance of service times for all their new automobiles is
(Multiple Choice)
4.9/5 (45)
We are interested in testing whether the variance of a population is significantly more than 625. The null hypothesis for this test is
(Multiple Choice)
4.8/5 (32)
A random sample of 31 charge sales showed a sample standard deviation of $50. A 90% confidence interval estimate of the population standard deviation is
(Multiple Choice)
4.8/5 (33)
The value of F.05 with 8 numerator and 19 denominator degrees of freedom is
(Multiple Choice)
4.8/5 (29)
The critical value of F at 95% confidence when there is a sample size of 21 for the sample with the smaller variance, and there is a sample size of 9 for the sample with the larger sample variance is
(Multiple Choice)
4.9/5 (42)
Exhibit 11-2
We are interested in determining whether or not the variances of the sales at two music stores (A and B) are equal. A sample of 26 days of sales at store A has a sample standard deviation of 30 while a sample of 16 days of sales from store B has a sample standard deviation of 20.
-Refer to Exhibit 11-2. The p-value for this test is
(Multiple Choice)
4.7/5 (31)
Exhibit 11-1
Last year, the standard deviation of the ages of the students at UA was 1.8 years. Recently, a sample of 61 students had a standard deviation of 2.1 years. We are interested in testing to see if there has been a significant change in the standard deviation of the ages of the students at UA.
-Refer to Exhibit 11-1. At 95% confidence the null hypothesis
(Multiple Choice)
4.9/5 (32)
Filters
- Essay(0)
- Multiple Choice(0)
- Short Answer(0)
- True False(0)
- Matching(0)