Deck 9: Hypothesis Tests
Full screen (f)
Question
Question
Question
Question
Question
Question
Question
Question
Question
Question
Question
Question
Question
Question
Question
Question
Question
Question
Question
Question
Question
Question
In order to test the following hypotheses at an level of significance H0:  800
800
Ha: > 800
The null hypothesis will be rejected if the test statistic Z is
A) Z
Z
B)< Z
C)< -Z
D)=
800Ha: > 800
The null hypothesis will be rejected if the test statistic Z is
A)
Z B)< Z
C)< -Z
D)=
Question
When the p-value is used for hypothesis testing, the null hypothesis is rejected if
A)p-value
B) < p-value
C)p-value
D)p-value = 1 -
A)p-value
B) < p-value
C)p-value
D)p-value = 1 -
Question
When the following hypotheses are being tested at a level of significance of H0:  500
500
Ha: < 500
The null hypothesis will be rejected if the p-value is
A)
B)>
C)> /2
D) 1 - /2
500Ha: < 500
The null hypothesis will be rejected if the p-value is
A)
B)>
C)> /2
D)
1 - /2 Question
Question
Question
Question
Question
Question
Question
Question
Question
Question
Question
Question
Question
Question
Question
Question
Question
Question
A machine is designed to fill toothpaste tubes with 5.8 ounces of toothpaste. The manufacturer does not want any underfilling or overfilling. The correct hypotheses to be tested are
A)
B)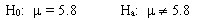
C)
D)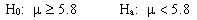
A)
B)
C)
D)
Question
Question
Question
Question
Question
Question
The average manufacturing work week in metropolitan Chattanooga was 40.1 hours last year. It is believed that the recession has led to a reduction in the average work week. To test the validity of this belief, the hypotheses are
A)
B)
C)
D)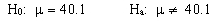
A)
B)
C)
D)
Question
The average hourly wage of computer programmers with 2 years of experience has been $21.80. Because of high demand for computer programmers, it is believed there has been a significant increase in the average wage of computer programmers. To test whether or not there has been an increase, the correct hypotheses to be tested are
A)
B)
C)
D)
A)
B)
C)
D)
Question
The average monthly rent for one-bedroom apartments in Chattanooga has been $700. Because of the downturn in the real estate market, it is believed that there has been a decrease in the average rental. The correct hypotheses to be tested are
A)
B)
C)
D)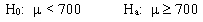
A)
B)
C)
D)
Question
Question
A student believes that the average grade on the final examination in statistics is at least 85. She plans on taking a sample to test her belief. The correct set of hypotheses is
A)H0: < 85 Ha: 85
85
B)H0: 85 Ha: > 85
C)H0: 85 Ha: < 85
D)H0: > 85 Ha: 85
85
A)H0: < 85 Ha:
85B)H0:
85 Ha: > 85C)H0:
85 Ha: < 85D)H0: > 85 Ha:
85 Question
Question
Question
Question
Question
Question
Question
Question
Question
In the past, 75% of the tourists who visited Chattanooga went to see Rock City. The management of Rock City recently undertook an extensive promotional campaign. They are interested in determining whether the promotional campaign actually increased the proportion of tourists visiting Rock City. The correct set of hypotheses is
A)H0: P > 0.75 Ha: P 0.75
0.75
B)H0: P < 0.75 Ha: P 0.75
0.75
C)H0: P 0.75 Ha: P < 0.75
D)H0: P 0.75 Ha: P > 0.75
A)H0: P > 0.75 Ha: P
0.75B)H0: P < 0.75 Ha: P
0.75C)H0: P
0.75 Ha: P < 0.75D)H0: P
0.75 Ha: P > 0.75 Question
Exhibit 9-2
n = 64 = 50
= 50
s = 16
H0: 54
54
Ha: < 54
-Refer to Exhibit 9-2. If the test is done at 95% confidence, the null hypothesis should
A)not be rejected
B)be rejected
C)Not enough information is given to answer this question.
D)None of these alternatives is correct.
n = 64
= 50s = 16
H0:
54Ha: < 54
-Refer to Exhibit 9-2. If the test is done at 95% confidence, the null hypothesis should
A)not be rejected
B)be rejected
C)Not enough information is given to answer this question.
D)None of these alternatives is correct.
Question
The manager of an automobile dealership is considering a new bonus plan in order to increase sales. Currently, the mean sales rate per salesperson is five automobiles per month. The correct set of hypotheses for testing the effect of the bonus plan is
A)H0: < 5 Ha: 5
5
B)H0: 5 Ha: > 5
C)H0: > 5 Ha: 5
5
D)H0: 5 Ha: < 5
A)H0: < 5 Ha:
5B)H0:
5 Ha: > 5C)H0: > 5 Ha:
5D)H0:
5 Ha: < 5 Question
Exhibit 9-3
n = 49 = 54.8
s = 28
H0: 50
50
Ha: > 50
-Refer to Exhibit 9-3. If the test is done at the 5% level of significance, the null hypothesis should
A)not be rejected
B)be rejected
C)Not enough information given to answer this question.
D)None of these alternatives is correct.
n = 49
= 54.8s = 28
H0:
50Ha: > 50
-Refer to Exhibit 9-3. If the test is done at the 5% level of significance, the null hypothesis should
A)not be rejected
B)be rejected
C)Not enough information given to answer this question.
D)None of these alternatives is correct.
Question
Your investment executive claims that the average yearly rate of return on the stocks she recommends is at least 10.0%. You plan on taking a sample to test her claim. The correct set of hypotheses is
A)H0: < 10.0% Ha: 10.0%
10.0%
B)H0: 10.0% Ha: > 10.0%
C)H0: > 10.0% Ha: 10.0%
10.0%
D)H0: 10.0% Ha: < 10.0%
A)H0: < 10.0% Ha:
10.0%B)H0:
10.0% Ha: > 10.0%C)H0: > 10.0% Ha:
10.0%D)H0:
10.0% Ha: < 10.0% Question
Question
A weatherman stated that the average temperature during July in Chattanooga is 80 degrees or less. A sample of 32 Julys is taken. The correct set of hypotheses is
A)H0: 80 Ha: < 80
B)H0: 80 Ha: > 80
C)H0: 80 Ha: = 80
D)H0: < 80 Ha: > 80
A)H0:
80 Ha: < 80B)H0:
80 Ha: > 80C)H0: 80 Ha: = 80
D)H0: < 80 Ha: > 80
Question
Exhibit 9-3
n = 49 = 54.8
s = 28
H0: 50
Ha: > 50
-Refer to Exhibit 9-3. The p-value is between
A)0.01 to 0.025
B)0.025 to 0.05
C).05 to 0.1
D)0.1 to 0.2
n = 49
= 54.8s = 28
H0:
50Ha: > 50
-Refer to Exhibit 9-3. The p-value is between
A)0.01 to 0.025
B)0.025 to 0.05
C).05 to 0.1
D)0.1 to 0.2
Question
The school's newspaper reported that the proportion of students majoring in business is at least 30%. You plan on taking a sample to test the newspaper's claim. The correct set of hypotheses is
A)H0: P < 0.30 Ha: P 0.30
0.30
B)H0: P 0.30 Ha: P > 0.30
C)H0: P 0.30 Ha: P < 0.30
D)H0: P > 0.30 Ha: P 0.30
0.30
A)H0: P < 0.30 Ha: P
0.30B)H0: P
0.30 Ha: P > 0.30C)H0: P
0.30 Ha: P < 0.30D)H0: P > 0.30 Ha: P
0.30 Question
The academic planner of a university thinks that at least 35% of the entire student body attends summer school. The correct set of hypotheses to test his belief is
A)H0: P > 0.35 Ha: P 0.35
0.35
B)H0: P 0.35 Ha: P > 0.35
C)H0: P 0.35 Ha: P < 0.35
D)H0: P > 0.35 Ha: P 0.35
0.35
A)H0: P > 0.35 Ha: P
0.35B)H0: P
0.35 Ha: P > 0.35C)H0: P
0.35 Ha: P < 0.35D)H0: P > 0.35 Ha: P
0.35 Question
Exhibit 9-3
n = 49 = 54.8
s = 28
H0: 50
Ha: > 50
-Refer to Exhibit 9-3. The test statistic is
A)0.1714
B)0.3849
C)-1.2
D)1.2
n = 49
= 54.8s = 28
H0:
50Ha: > 50
-Refer to Exhibit 9-3. The test statistic is
A)0.1714
B)0.3849
C)-1.2
D)1.2
Question
Given the following information, the test statistic is n = 49  = 50 S = 7 Ho: > 52
Ha: < 52
The test statistic for the above information is
A)2
B)-2
C)1
D)-1
= 50 S = 7 Ho: > 52Ha: < 52
The test statistic for the above information is
A)2
B)-2
C)1
D)-1
Question
Exhibit 9-2
n = 64 = 50
s = 16
H0: 54
Ha: < 54
-Refer to Exhibit 9-2. The test statistic equals
A)-4
B)-3
C)-2
D)-1
n = 64
= 50s = 16
H0:
54Ha: < 54
-Refer to Exhibit 9-2. The test statistic equals
A)-4
B)-3
C)-2
D)-1
Question
A soft drink filling machine, when in perfect adjustment, fills the bottles with 12 ounces of soft drink. Any over filling or under filling results in the shutdown and readjustment of the machine. To determine whether or not the machine is properly adjusted, the correct set of hypotheses is
A)H0: < 12 Ha: 12
12
B)H0: 12 Ha: > 12
C)H0: 12 Ha: = 12
D)H0: = 12 Ha: 12
A)H0: < 12 Ha:
12B)H0:
12 Ha: > 12C)H0: 12 Ha: = 12
D)H0: = 12 Ha: 12
Question
Exhibit 9-1
n = 36 = 24.6
S = 12
H0: 20
20
Ha: > 20
-Refer to Exhibit 9-1. If the test is done at 95% confidence, the null hypothesis should
A)not be rejected
B)be rejected
C)Not enough information is given to answer this question.
D)None of these alternatives is correct.
n = 36
= 24.6S = 12
H0:
20Ha: > 20
-Refer to Exhibit 9-1. If the test is done at 95% confidence, the null hypothesis should
A)not be rejected
B)be rejected
C)Not enough information is given to answer this question.
D)None of these alternatives is correct.
Question
The average life expectancy of tires produced by the Whitney Tire Company has been 40,000 miles. Management believes that due to a new production process, the life expectancy of their tires has increased. In order to test the validity of their belief, the correct set of hypotheses is
A)H0: < 40,000 Ha: 40,000
B)H0: 40,000 Ha: > 40,000
C)H0: > 40,000 Ha: 40,000
D)H0: 40,000 Ha: < 40,000
A)H0: < 40,000 Ha:
40,000B)H0:
40,000 Ha: > 40,000C)H0: > 40,000 Ha:
40,000D)H0:
40,000 Ha: < 40,000 Question
Exhibit 9-2
n = 64 = 50
s = 16
H0: 54
Ha: < 54
-Refer to Exhibit 9-2. The p-value is between
A).005 to .01
B).01 to .025
C).025 to .05
D).05 to .01
n = 64
= 50s = 16
H0:
54Ha: < 54
-Refer to Exhibit 9-2. The p-value is between
A).005 to .01
B).01 to .025
C).025 to .05
D).05 to .01
Question
Exhibit 9-1
n = 36 = 24.6
S = 12
H0: 20
Ha: > 20
-Refer to Exhibit 9-1. The p-value is between
A)0.005 to 0.01
B)0.01 to 0.025
C)0.025 to 0.05
D)0.05 to 0.10
n = 36
= 24.6S = 12
H0:
20Ha: > 20
-Refer to Exhibit 9-1. The p-value is between
A)0.005 to 0.01
B)0.01 to 0.025
C)0.025 to 0.05
D)0.05 to 0.10
Question
Question
Exhibit 9-1
n = 36 = 24.6
S = 12
H0: 20
Ha: > 20
-Refer to Exhibit 9-1. The test statistic is
A)2.3
B)0.38
C)-2.3
D)-0.38
n = 36
= 24.6S = 12
H0:
20Ha: > 20
-Refer to Exhibit 9-1. The test statistic is
A)2.3
B)0.38
C)-2.3
D)-0.38

Unlock Deck
Sign up to unlock the cards in this deck!
Unlock Deck
Unlock Deck
1/148
Play
Full screen (f)
Deck 9: Hypothesis Tests
1
The sum of the values of and
A)always add up to 1.0
B)always add up to 0.5
C)is the probability of Type II error
D)none of these alternatives is correct
A)always add up to 1.0
B)always add up to 0.5
C)is the probability of Type II error
D)none of these alternatives is correct
none of these alternatives is correct
2
In hypothesis testing, the tentative assumption about the population parameter is
A)the alternative hypothesis
B)the null hypothesis
C)either the null or the alternative
D)None of these alternatives is correct.
A)the alternative hypothesis
B)the null hypothesis
C)either the null or the alternative
D)None of these alternatives is correct.
the null hypothesis
3
A Type II error is committed when
A)a true alternative hypothesis is mistakenly rejected
B)a true null hypothesis is mistakenly rejected
C)the sample size has been too small
D)not enough information has been available
A)a true alternative hypothesis is mistakenly rejected
B)a true null hypothesis is mistakenly rejected
C)the sample size has been too small
D)not enough information has been available
a true alternative hypothesis is mistakenly rejected
4
For a lower tail test, the p-value is the probability of obtaining a value for the test statistic
A)at least as small as that provided by the sample
B)at least as large as that provided by the sample
C)at least as small as that provided by the population
D)at least as large as that provided by the population.
A)at least as small as that provided by the sample
B)at least as large as that provided by the sample
C)at least as small as that provided by the population
D)at least as large as that provided by the population.
Unlock Deck
Unlock for access to all 148 flashcards in this deck.
Unlock Deck
k this deck
5
The error of rejecting a true null hypothesis is
A)a Type I error
B)a Type II error
C)is the same as
D)committed when not enough information is available
A)a Type I error
B)a Type II error
C)is the same as
D)committed when not enough information is available
Unlock Deck
Unlock for access to all 148 flashcards in this deck.
Unlock Deck
k this deck
6
In hypothesis testing,
A)the smaller the Type I error, the smaller the Type II error will be
B)the smaller the Type I error, the larger the Type II error will be
C)Type II error will not be effected by Type I error
D)the sum of Type I and Ttype II errors must equal to 1
A)the smaller the Type I error, the smaller the Type II error will be
B)the smaller the Type I error, the larger the Type II error will be
C)Type II error will not be effected by Type I error
D)the sum of Type I and Ttype II errors must equal to 1
Unlock Deck
Unlock for access to all 148 flashcards in this deck.
Unlock Deck
k this deck
7
The p-value is a probability that measures the support (or lack of support) for the
A)null hypothesis
B)alternative hypothesis
C)either the null or the alternative hypothesis
D)sample statistic
A)null hypothesis
B)alternative hypothesis
C)either the null or the alternative hypothesis
D)sample statistic
Unlock Deck
Unlock for access to all 148 flashcards in this deck.
Unlock Deck
k this deck
8
The critical value of t for a two tail test with 6 degrees of freedom is
A)2.447
B)1.943
C)2.365
D)1.985
A)2.447
B)1.943
C)2.365
D)1.985
Unlock Deck
Unlock for access to all 148 flashcards in this deck.
Unlock Deck
k this deck
9
The p-value
A)is the same as the Z statistic
B)measures the number of standard deviations from the mean
C)is a distance
D)is a probability
A)is the same as the Z statistic
B)measures the number of standard deviations from the mean
C)is a distance
D)is a probability
Unlock Deck
Unlock for access to all 148 flashcards in this deck.
Unlock Deck
k this deck
10
What type of error occurs if you fail to reject H0 when, in fact, it is not true?
A)Type II
B)Type I
C)either Type I or Type II, depending on the level of significance
D)either Type I or Type II, depending on whether the test is one tail or two tail
A)Type II
B)Type I
C)either Type I or Type II, depending on the level of significance
D)either Type I or Type II, depending on whether the test is one tail or two tail
Unlock Deck
Unlock for access to all 148 flashcards in this deck.
Unlock Deck
k this deck
11
The level of significance is the
A)maximum allowable probability of Type II error
B)maximum allowable probability of Type I error
C)same as the confidence coefficient
D)same as the p-value
A)maximum allowable probability of Type II error
B)maximum allowable probability of Type I error
C)same as the confidence coefficient
D)same as the p-value
Unlock Deck
Unlock for access to all 148 flashcards in this deck.
Unlock Deck
k this deck
12
We are interested in conducting a study in order to determine what percentage of voters in a city would vote for the incumbent mayor. What is the minimum size sample needed to estimate the population proportion with a margin of error not exceeding 4% at 95% confidence?
A)625
B)626
C)600
D)601
A)625
B)626
C)600
D)601
Unlock Deck
Unlock for access to all 148 flashcards in this deck.
Unlock Deck
k this deck
13
The power curve provides the probability of
A)correctly accepting the null hypothesis
B)incorrectly accepting the null hypothesis
C)correctly rejecting the alternative hypothesis
D)correctly rejecting the null hypothesis
A)correctly accepting the null hypothesis
B)incorrectly accepting the null hypothesis
C)correctly rejecting the alternative hypothesis
D)correctly rejecting the null hypothesis
Unlock Deck
Unlock for access to all 148 flashcards in this deck.
Unlock Deck
k this deck
14
The p-value
A)can be any value
B)can be any positive value
C)can be any value, negative or positive
D)must be a number between zero and 1
A)can be any value
B)can be any positive value
C)can be any value, negative or positive
D)must be a number between zero and 1
Unlock Deck
Unlock for access to all 148 flashcards in this deck.
Unlock Deck
k this deck
15
An assumption made about the value of a population parameter is called a
A)hypothesis
B)conclusion
C)confidence
D)significance
A)hypothesis
B)conclusion
C)confidence
D)significance
Unlock Deck
Unlock for access to all 148 flashcards in this deck.
Unlock Deck
k this deck
16
In hypothesis testing if the null hypothesis is rejected,
A)no conclusions can be drawn from the test
B)the alternative hypothesis is true
C)the data must have been accumulated incorrectly
D)the sample size has been too small
A)no conclusions can be drawn from the test
B)the alternative hypothesis is true
C)the data must have been accumulated incorrectly
D)the sample size has been too small
Unlock Deck
Unlock for access to all 148 flashcards in this deck.
Unlock Deck
k this deck
17
The level of significance in hypothesis testing is the probability of
A)accepting a true null hypothesis
B)accepting a false null hypothesis
C)rejecting a true null hypothesis
D)None of these alternatives is correct.
A)accepting a true null hypothesis
B)accepting a false null hypothesis
C)rejecting a true null hypothesis
D)None of these alternatives is correct.
Unlock Deck
Unlock for access to all 148 flashcards in this deck.
Unlock Deck
k this deck
18
The probability of committing a Type I error when the null hypothesis is true is
A)the confidence level
B)
C)greater than 1
D)the Level of Significance
A)the confidence level
B)
C)greater than 1
D)the Level of Significance
Unlock Deck
Unlock for access to all 148 flashcards in this deck.
Unlock Deck
k this deck
19
For a two-tail test, the p-value is the probability of obtaining a value for the test statistic as
A)likely as that provided by the sample
B)unlikely as that provided by the sample
C)likely as that provided by the population
D)unlikely as that provided by the population
A)likely as that provided by the sample
B)unlikely as that provided by the sample
C)likely as that provided by the population
D)unlikely as that provided by the population
Unlock Deck
Unlock for access to all 148 flashcards in this deck.
Unlock Deck
k this deck
20
It is known that the population variance ( 2) is 144. At 95% confidence, what size sample should be taken so that the margin of error is does not exceed 5 or less?
A)22
B)23
C)24
D)25
A)22
B)23
C)24
D)25
Unlock Deck
Unlock for access to all 148 flashcards in this deck.
Unlock Deck
k this deck
21
The level of significance
A)can be any positive value
B)can be any value
C)is (1 - confidence level)
D)can be any value between -1.96 to 1.96
A)can be any positive value
B)can be any value
C)is (1 - confidence level)
D)can be any value between -1.96 to 1.96
Unlock Deck
Unlock for access to all 148 flashcards in this deck.
Unlock Deck
k this deck
22
In order to test the following hypotheses at an level of significance H0: 800
Ha: > 800
The null hypothesis will be rejected if the test statistic Z is
A) Z
B)< Z
C)< -Z
D)=
800Ha: > 800
The null hypothesis will be rejected if the test statistic Z is
A)
Z B)< Z
C)< -Z
D)=
Unlock Deck
Unlock for access to all 148 flashcards in this deck.
Unlock Deck
k this deck
23
When the p-value is used for hypothesis testing, the null hypothesis is rejected if
A)p-value
B) < p-value
C)p-value
D)p-value = 1 -
A)p-value
B) < p-value
C)p-value
D)p-value = 1 -
Unlock Deck
Unlock for access to all 148 flashcards in this deck.
Unlock Deck
k this deck
24
When the following hypotheses are being tested at a level of significance of H0: 500
Ha: < 500
The null hypothesis will be rejected if the p-value is
A)
B)>
C)> /2
D) 1 - /2
500Ha: < 500
The null hypothesis will be rejected if the p-value is
A)
B)>
C)> /2
D)
1 - /2 Unlock Deck
Unlock for access to all 148 flashcards in this deck.
Unlock Deck
k this deck
25
If a hypothesis is rejected at 95% confidence, it
A)will always be accepted at 90% confidence
B)will always be rejected at 90% confidence
C)will sometimes be rejected at 90% confidence
D)None of these alternatives is correct.
A)will always be accepted at 90% confidence
B)will always be rejected at 90% confidence
C)will sometimes be rejected at 90% confidence
D)None of these alternatives is correct.
Unlock Deck
Unlock for access to all 148 flashcards in this deck.
Unlock Deck
k this deck
26
In the hypothesis testing procedure, is
A)the level of significance
B)the critical value
C)the confidence level
D)1 - level of significance
A)the level of significance
B)the critical value
C)the confidence level
D)1 - level of significance
Unlock Deck
Unlock for access to all 148 flashcards in this deck.
Unlock Deck
k this deck
27
As the test statistic becomes larger, the p-value
A)gets smaller
B)becomes larger
C)stays the same, since the sample size has not been changed
D)becomes negative
A)gets smaller
B)becomes larger
C)stays the same, since the sample size has not been changed
D)becomes negative
Unlock Deck
Unlock for access to all 148 flashcards in this deck.
Unlock Deck
k this deck
28
If a hypothesis test leads to the rejection of the null hypothesis,
A)a Type II error must have been committed
B)a Type II error may have been committed
C)a Type I error must have been committed
D)a Type I error may have been committed
A)a Type II error must have been committed
B)a Type II error may have been committed
C)a Type I error must have been committed
D)a Type I error may have been committed
Unlock Deck
Unlock for access to all 148 flashcards in this deck.
Unlock Deck
k this deck
29
If a hypothesis is rejected at the 5% level of significance, it
A)will always be rejected at the 1% level
B)will always be accepted at the 1% level
C)will never be tested at the 1% level
D)may be rejected or not rejected at the 1% level
A)will always be rejected at the 1% level
B)will always be accepted at the 1% level
C)will never be tested at the 1% level
D)may be rejected or not rejected at the 1% level
Unlock Deck
Unlock for access to all 148 flashcards in this deck.
Unlock Deck
k this deck
30
The probability of making a Type I error is denoted by
A)
B)
C)1 -
D)1 -
A)
B)
C)1 -
D)1 -
Unlock Deck
Unlock for access to all 148 flashcards in this deck.
Unlock Deck
k this deck
31
The p-value ranges between
A)zero and infinity
B)minus infinity to plus infinity
C)zero to one
D)-1 to +1
A)zero and infinity
B)minus infinity to plus infinity
C)zero to one
D)-1 to +1
Unlock Deck
Unlock for access to all 148 flashcards in this deck.
Unlock Deck
k this deck
32
Which of the following does not need to be known in order to compute the p-value?
A)knowledge of whether the test is one-tailed or two-tailed
B)the value of the test statistic
C)the level of significance
D)None of these alternatives is correct.
A)knowledge of whether the test is one-tailed or two-tailed
B)the value of the test statistic
C)the level of significance
D)None of these alternatives is correct.
Unlock Deck
Unlock for access to all 148 flashcards in this deck.
Unlock Deck
k this deck
33
If the level of significance of a hypothesis test is raised from .01 to .05, the probability of a Type II error
A)will also increase from .01 to .05
B)will not change
C)will decrease
D)will increase
A)will also increase from .01 to .05
B)will not change
C)will decrease
D)will increase
Unlock Deck
Unlock for access to all 148 flashcards in this deck.
Unlock Deck
k this deck
34
For a lower bounds one-tailed test, the test statistic z is determined to be zero. The p-value for this test is
A)zero
B)-0.5
C)+0.5
D)1.00
A)zero
B)-0.5
C)+0.5
D)1.00
Unlock Deck
Unlock for access to all 148 flashcards in this deck.
Unlock Deck
k this deck
35
In hypothesis testing if the null hypothesis has been rejected when the alternative hypothesis has been true,
A)a Type I error has been committed
B)a Type II error has been committed
C)either a Type I or Type II error has been committed
D)the correct decision has been made
A)a Type I error has been committed
B)a Type II error has been committed
C)either a Type I or Type II error has been committed
D)the correct decision has been made
Unlock Deck
Unlock for access to all 148 flashcards in this deck.
Unlock Deck
k this deck
36
In a two-tailed hypothesis test situation, the test statistic is determined to be t = -2.692. The sample size has been 45. The p-value for this test is
A)-0.005
B)+0.005
C)-0.01
D)+0.01
A)-0.005
B)+0.005
C)-0.01
D)+0.01
Unlock Deck
Unlock for access to all 148 flashcards in this deck.
Unlock Deck
k this deck
37
In a lower one-tail hypothesis test situation, the p-value is determined to be 0.2. If the sample size for this test is 51, the t statistic has a value of
A)0.849
B)-0.849
C)1.299
D)-1.299
A)0.849
B)-0.849
C)1.299
D)-1.299
Unlock Deck
Unlock for access to all 148 flashcards in this deck.
Unlock Deck
k this deck
38
The probability of making a Type II error is denoted by
A)
B)
C)1 -
D)1 -
A)
B)
C)1 -
D)1 -
Unlock Deck
Unlock for access to all 148 flashcards in this deck.
Unlock Deck
k this deck
39
If the probability of a Type I error ( ) is 0.05, then the probability of a Type II error ( ) must be
A)0.05
B)0.95
C)0.025
D)None of these alternatives is correct.
A)0.05
B)0.95
C)0.025
D)None of these alternatives is correct.
Unlock Deck
Unlock for access to all 148 flashcards in this deck.
Unlock Deck
k this deck
40
If a hypothesis is not rejected at the 5% level of significance, it
A)will also not be rejected at the 1% level
B)will always be rejected at the 1% level
C)will sometimes be rejected at the 1% level
D)None of these alternatives is correct.
A)will also not be rejected at the 1% level
B)will always be rejected at the 1% level
C)will sometimes be rejected at the 1% level
D)None of these alternatives is correct.
Unlock Deck
Unlock for access to all 148 flashcards in this deck.
Unlock Deck
k this deck
41
Read the Z statistic from the normal distribution table and circle the correct answer. A one-tailed test (upper tail) at 87.7% confidence; Z =
A)1.54
B)1.96
C)1.645
D)1.16
A)1.54
B)1.96
C)1.645
D)1.16
Unlock Deck
Unlock for access to all 148 flashcards in this deck.
Unlock Deck
k this deck
42
A machine is designed to fill toothpaste tubes with 5.8 ounces of toothpaste. The manufacturer does not want any underfilling or overfilling. The correct hypotheses to be tested are
A)
B)
C)
D)
A)
B)
C)
D)
Unlock Deck
Unlock for access to all 148 flashcards in this deck.
Unlock Deck
k this deck
43
A two-tailed test is performed at 95% confidence. The p-value is determined to be 0.09. The null hypothesis
A)must be rejected
B)should not be rejected
C)could be rejected, depending on the sample size
D)has been designed incorrectly
A)must be rejected
B)should not be rejected
C)could be rejected, depending on the sample size
D)has been designed incorrectly
Unlock Deck
Unlock for access to all 148 flashcards in this deck.
Unlock Deck
k this deck
44
In a one-tailed hypothesis test (lower tail) the test statistic is determined to be -2. The p-value for this test is
A)0.4772
B)0.0228
C)0.0056
D)0.5228
A)0.4772
B)0.0228
C)0.0056
D)0.5228
Unlock Deck
Unlock for access to all 148 flashcards in this deck.
Unlock Deck
k this deck
45
For a one-tailed test (upper tail), a sample size of 26 at 90% confidence, t =
A)1.316
B)-1.316
C)-1.740
D)1.740
A)1.316
B)-1.316
C)-1.740
D)1.740
Unlock Deck
Unlock for access to all 148 flashcards in this deck.
Unlock Deck
k this deck
46
For a one-tailed test (lower tail), a sample size of 10 at 90% confidence, t =
A)1.383
B)2.821
C)-1.383
D)-2.821
A)1.383
B)2.821
C)-1.383
D)-2.821
Unlock Deck
Unlock for access to all 148 flashcards in this deck.
Unlock Deck
k this deck
47
For a one-tailed test (lower tail) at 93.7% confidence, Z =
A)-1.86
B)-1.53
C)-1.96
D)-1.645
A)-1.86
B)-1.53
C)-1.96
D)-1.645
Unlock Deck
Unlock for access to all 148 flashcards in this deck.
Unlock Deck
k this deck
48
The average manufacturing work week in metropolitan Chattanooga was 40.1 hours last year. It is believed that the recession has led to a reduction in the average work week. To test the validity of this belief, the hypotheses are
A)
B)
C)
D)
A)
B)
C)
D)
Unlock Deck
Unlock for access to all 148 flashcards in this deck.
Unlock Deck
k this deck
49
The average hourly wage of computer programmers with 2 years of experience has been $21.80. Because of high demand for computer programmers, it is believed there has been a significant increase in the average wage of computer programmers. To test whether or not there has been an increase, the correct hypotheses to be tested are
A)
B)
C)
D)
A)
B)
C)
D)
Unlock Deck
Unlock for access to all 148 flashcards in this deck.
Unlock Deck
k this deck
50
The average monthly rent for one-bedroom apartments in Chattanooga has been $700. Because of the downturn in the real estate market, it is believed that there has been a decrease in the average rental. The correct hypotheses to be tested are
A)
B)
C)
D)
A)
B)
C)
D)
Unlock Deck
Unlock for access to all 148 flashcards in this deck.
Unlock Deck
k this deck
51
For a two-tailed test at 98.4% confidence, Z =
A)1.96
B)1.14
C)2.41
D)0.8612
A)1.96
B)1.14
C)2.41
D)0.8612
Unlock Deck
Unlock for access to all 148 flashcards in this deck.
Unlock Deck
k this deck
52
A student believes that the average grade on the final examination in statistics is at least 85. She plans on taking a sample to test her belief. The correct set of hypotheses is
A)H0: < 85 Ha: 85
B)H0: 85 Ha: > 85
C)H0: 85 Ha: < 85
D)H0: > 85 Ha: 85
A)H0: < 85 Ha:
85B)H0:
85 Ha: > 85C)H0:
85 Ha: < 85D)H0: > 85 Ha:
85 Unlock Deck
Unlock for access to all 148 flashcards in this deck.
Unlock Deck
k this deck
53
For a one-tailed test (upper tail), a sample size of 18 at 95% confidence, t =
A)2.12
B)-2.12
C)-1.740
D)1.740
A)2.12
B)-2.12
C)-1.740
D)1.740
Unlock Deck
Unlock for access to all 148 flashcards in this deck.
Unlock Deck
k this deck
54
For a one-tailed test (lower tail) at 89.8% confidence, Z =
A)-1.27
B)-1.53
C)-1.96
D)-1.64
A)-1.27
B)-1.53
C)-1.96
D)-1.64
Unlock Deck
Unlock for access to all 148 flashcards in this deck.
Unlock Deck
k this deck
55
For a two-tailed test at 86.12% confidence, Z =
A)1.96
B)1.48
C)1.09
D)0.86
A)1.96
B)1.48
C)1.09
D)0.86
Unlock Deck
Unlock for access to all 148 flashcards in this deck.
Unlock Deck
k this deck
56
For a one-tailed test (upper tail) at 93.7% confidence, Z =
A)1.50
B)1.96
C)1.645
D)1.53
A)1.50
B)1.96
C)1.645
D)1.53
Unlock Deck
Unlock for access to all 148 flashcards in this deck.
Unlock Deck
k this deck
57
In a two-tailed hypothesis test the test statistic is determined to be Z = -2.5. The p-value for this test is
A)-1.25
B)0.4938
C)0.0062
D)0.0124
A)-1.25
B)0.4938
C)0.0062
D)0.0124
Unlock Deck
Unlock for access to all 148 flashcards in this deck.
Unlock Deck
k this deck
58
For a one-tailed test (lower tail) with 22 degrees of freedom at 95% confidence, the value of t =
A)-1.383
B)1.383
C)-1.717
D)-1.721
A)-1.383
B)1.383
C)-1.717
D)-1.721
Unlock Deck
Unlock for access to all 148 flashcards in this deck.
Unlock Deck
k this deck
59
For a one-tailed hypothesis test (upper tail) the p-value is computed to be 0.034. If the test is being conducted at 95% confidence, the null hypothesis
A)could be rejected or not rejected depending on the sample size
B)could be rejected or not rejected depending on the value of the mean of the sample
C)is not rejected
D)is rejected
A)could be rejected or not rejected depending on the sample size
B)could be rejected or not rejected depending on the value of the mean of the sample
C)is not rejected
D)is rejected
Unlock Deck
Unlock for access to all 148 flashcards in this deck.
Unlock Deck
k this deck
60
For a two-tailed test, a sample of 20 at 80% confidence, t =
A)1.328
B)2.539
C)1.325
D)2.528
A)1.328
B)2.539
C)1.325
D)2.528
Unlock Deck
Unlock for access to all 148 flashcards in this deck.
Unlock Deck
k this deck
61
In the past, 75% of the tourists who visited Chattanooga went to see Rock City. The management of Rock City recently undertook an extensive promotional campaign. They are interested in determining whether the promotional campaign actually increased the proportion of tourists visiting Rock City. The correct set of hypotheses is
A)H0: P > 0.75 Ha: P 0.75
B)H0: P < 0.75 Ha: P 0.75
C)H0: P 0.75 Ha: P < 0.75
D)H0: P 0.75 Ha: P > 0.75
A)H0: P > 0.75 Ha: P
0.75B)H0: P < 0.75 Ha: P
0.75C)H0: P
0.75 Ha: P < 0.75D)H0: P
0.75 Ha: P > 0.75 Unlock Deck
Unlock for access to all 148 flashcards in this deck.
Unlock Deck
k this deck
62
Exhibit 9-2
n = 64 = 50
s = 16
H0: 54
Ha: < 54
-Refer to Exhibit 9-2. If the test is done at 95% confidence, the null hypothesis should
A)not be rejected
B)be rejected
C)Not enough information is given to answer this question.
D)None of these alternatives is correct.
n = 64
= 50s = 16
H0:
54Ha: < 54
-Refer to Exhibit 9-2. If the test is done at 95% confidence, the null hypothesis should
A)not be rejected
B)be rejected
C)Not enough information is given to answer this question.
D)None of these alternatives is correct.
Unlock Deck
Unlock for access to all 148 flashcards in this deck.
Unlock Deck
k this deck
63
The manager of an automobile dealership is considering a new bonus plan in order to increase sales. Currently, the mean sales rate per salesperson is five automobiles per month. The correct set of hypotheses for testing the effect of the bonus plan is
A)H0: < 5 Ha: 5
B)H0: 5 Ha: > 5
C)H0: > 5 Ha: 5
D)H0: 5 Ha: < 5
A)H0: < 5 Ha:
5B)H0:
5 Ha: > 5C)H0: > 5 Ha:
5D)H0:
5 Ha: < 5 Unlock Deck
Unlock for access to all 148 flashcards in this deck.
Unlock Deck
k this deck
64
Exhibit 9-3
n = 49 = 54.8
s = 28
H0: 50
Ha: > 50
-Refer to Exhibit 9-3. If the test is done at the 5% level of significance, the null hypothesis should
A)not be rejected
B)be rejected
C)Not enough information given to answer this question.
D)None of these alternatives is correct.
n = 49
= 54.8s = 28
H0:
50Ha: > 50
-Refer to Exhibit 9-3. If the test is done at the 5% level of significance, the null hypothesis should
A)not be rejected
B)be rejected
C)Not enough information given to answer this question.
D)None of these alternatives is correct.
Unlock Deck
Unlock for access to all 148 flashcards in this deck.
Unlock Deck
k this deck
65
Your investment executive claims that the average yearly rate of return on the stocks she recommends is at least 10.0%. You plan on taking a sample to test her claim. The correct set of hypotheses is
A)H0: < 10.0% Ha: 10.0%
B)H0: 10.0% Ha: > 10.0%
C)H0: > 10.0% Ha: 10.0%
D)H0: 10.0% Ha: < 10.0%
A)H0: < 10.0% Ha:
10.0%B)H0:
10.0% Ha: > 10.0%C)H0: > 10.0% Ha:
10.0%D)H0:
10.0% Ha: < 10.0% Unlock Deck
Unlock for access to all 148 flashcards in this deck.
Unlock Deck
k this deck
66
A sample of 1400 items had 280 defective items. For the following hypothesis test, Ho: P = 0.20
Ha: P > 0.20
The test statistic is
A)0.28
B)0.14
C)28%
D)zero
Ha: P > 0.20
The test statistic is
A)0.28
B)0.14
C)28%
D)zero
Unlock Deck
Unlock for access to all 148 flashcards in this deck.
Unlock Deck
k this deck
67
A weatherman stated that the average temperature during July in Chattanooga is 80 degrees or less. A sample of 32 Julys is taken. The correct set of hypotheses is
A)H0: 80 Ha: < 80
B)H0: 80 Ha: > 80
C)H0: 80 Ha: = 80
D)H0: < 80 Ha: > 80
A)H0:
80 Ha: < 80B)H0:
80 Ha: > 80C)H0: 80 Ha: = 80
D)H0: < 80 Ha: > 80
Unlock Deck
Unlock for access to all 148 flashcards in this deck.
Unlock Deck
k this deck
68
Exhibit 9-3
n = 49 = 54.8
s = 28
H0: 50
Ha: > 50
-Refer to Exhibit 9-3. The p-value is between
A)0.01 to 0.025
B)0.025 to 0.05
C).05 to 0.1
D)0.1 to 0.2
n = 49
= 54.8s = 28
H0:
50Ha: > 50
-Refer to Exhibit 9-3. The p-value is between
A)0.01 to 0.025
B)0.025 to 0.05
C).05 to 0.1
D)0.1 to 0.2
Unlock Deck
Unlock for access to all 148 flashcards in this deck.
Unlock Deck
k this deck
69
The school's newspaper reported that the proportion of students majoring in business is at least 30%. You plan on taking a sample to test the newspaper's claim. The correct set of hypotheses is
A)H0: P < 0.30 Ha: P 0.30
B)H0: P 0.30 Ha: P > 0.30
C)H0: P 0.30 Ha: P < 0.30
D)H0: P > 0.30 Ha: P 0.30
A)H0: P < 0.30 Ha: P
0.30B)H0: P
0.30 Ha: P > 0.30C)H0: P
0.30 Ha: P < 0.30D)H0: P > 0.30 Ha: P
0.30 Unlock Deck
Unlock for access to all 148 flashcards in this deck.
Unlock Deck
k this deck
70
The academic planner of a university thinks that at least 35% of the entire student body attends summer school. The correct set of hypotheses to test his belief is
A)H0: P > 0.35 Ha: P 0.35
B)H0: P 0.35 Ha: P > 0.35
C)H0: P 0.35 Ha: P < 0.35
D)H0: P > 0.35 Ha: P 0.35
A)H0: P > 0.35 Ha: P
0.35B)H0: P
0.35 Ha: P > 0.35C)H0: P
0.35 Ha: P < 0.35D)H0: P > 0.35 Ha: P
0.35 Unlock Deck
Unlock for access to all 148 flashcards in this deck.
Unlock Deck
k this deck
71
Exhibit 9-3
n = 49 = 54.8
s = 28
H0: 50
Ha: > 50
-Refer to Exhibit 9-3. The test statistic is
A)0.1714
B)0.3849
C)-1.2
D)1.2
n = 49
= 54.8s = 28
H0:
50Ha: > 50
-Refer to Exhibit 9-3. The test statistic is
A)0.1714
B)0.3849
C)-1.2
D)1.2
Unlock Deck
Unlock for access to all 148 flashcards in this deck.
Unlock Deck
k this deck
72
Given the following information, the test statistic is n = 49 = 50 S = 7 Ho: > 52
Ha: < 52
The test statistic for the above information is
A)2
B)-2
C)1
D)-1
= 50 S = 7 Ho: > 52Ha: < 52
The test statistic for the above information is
A)2
B)-2
C)1
D)-1
Unlock Deck
Unlock for access to all 148 flashcards in this deck.
Unlock Deck
k this deck
73
Exhibit 9-2
n = 64 = 50
s = 16
H0: 54
Ha: < 54
-Refer to Exhibit 9-2. The test statistic equals
A)-4
B)-3
C)-2
D)-1
n = 64
= 50s = 16
H0:
54Ha: < 54
-Refer to Exhibit 9-2. The test statistic equals
A)-4
B)-3
C)-2
D)-1
Unlock Deck
Unlock for access to all 148 flashcards in this deck.
Unlock Deck
k this deck
74
A soft drink filling machine, when in perfect adjustment, fills the bottles with 12 ounces of soft drink. Any over filling or under filling results in the shutdown and readjustment of the machine. To determine whether or not the machine is properly adjusted, the correct set of hypotheses is
A)H0: < 12 Ha: 12
B)H0: 12 Ha: > 12
C)H0: 12 Ha: = 12
D)H0: = 12 Ha: 12
A)H0: < 12 Ha:
12B)H0:
12 Ha: > 12C)H0: 12 Ha: = 12
D)H0: = 12 Ha: 12
Unlock Deck
Unlock for access to all 148 flashcards in this deck.
Unlock Deck
k this deck
75
Exhibit 9-1
n = 36 = 24.6
S = 12
H0: 20
Ha: > 20
-Refer to Exhibit 9-1. If the test is done at 95% confidence, the null hypothesis should
A)not be rejected
B)be rejected
C)Not enough information is given to answer this question.
D)None of these alternatives is correct.
n = 36
= 24.6S = 12
H0:
20Ha: > 20
-Refer to Exhibit 9-1. If the test is done at 95% confidence, the null hypothesis should
A)not be rejected
B)be rejected
C)Not enough information is given to answer this question.
D)None of these alternatives is correct.
Unlock Deck
Unlock for access to all 148 flashcards in this deck.
Unlock Deck
k this deck
76
The average life expectancy of tires produced by the Whitney Tire Company has been 40,000 miles. Management believes that due to a new production process, the life expectancy of their tires has increased. In order to test the validity of their belief, the correct set of hypotheses is
A)H0: < 40,000 Ha: 40,000
B)H0: 40,000 Ha: > 40,000
C)H0: > 40,000 Ha: 40,000
D)H0: 40,000 Ha: < 40,000
A)H0: < 40,000 Ha:
40,000B)H0:
40,000 Ha: > 40,000C)H0: > 40,000 Ha:
40,000D)H0:
40,000 Ha: < 40,000 Unlock Deck
Unlock for access to all 148 flashcards in this deck.
Unlock Deck
k this deck
77
Exhibit 9-2
n = 64 = 50
s = 16
H0: 54
Ha: < 54
-Refer to Exhibit 9-2. The p-value is between
A).005 to .01
B).01 to .025
C).025 to .05
D).05 to .01
n = 64
= 50s = 16
H0:
54Ha: < 54
-Refer to Exhibit 9-2. The p-value is between
A).005 to .01
B).01 to .025
C).025 to .05
D).05 to .01
Unlock Deck
Unlock for access to all 148 flashcards in this deck.
Unlock Deck
k this deck
78
Exhibit 9-1
n = 36 = 24.6
S = 12
H0: 20
Ha: > 20
-Refer to Exhibit 9-1. The p-value is between
A)0.005 to 0.01
B)0.01 to 0.025
C)0.025 to 0.05
D)0.05 to 0.10
n = 36
= 24.6S = 12
H0:
20Ha: > 20
-Refer to Exhibit 9-1. The p-value is between
A)0.005 to 0.01
B)0.01 to 0.025
C)0.025 to 0.05
D)0.05 to 0.10
Unlock Deck
Unlock for access to all 148 flashcards in this deck.
Unlock Deck
k this deck
79
For the following hypothesis test, Ho: = 150
Ha: < 150
The test statistic
A)must be negative
B)must be positive
C)can be either negative or positive
D)must be a number between zero and 1
Ha: < 150
The test statistic
A)must be negative
B)must be positive
C)can be either negative or positive
D)must be a number between zero and 1
Unlock Deck
Unlock for access to all 148 flashcards in this deck.
Unlock Deck
k this deck
80
Exhibit 9-1
n = 36 = 24.6
S = 12
H0: 20
Ha: > 20
-Refer to Exhibit 9-1. The test statistic is
A)2.3
B)0.38
C)-2.3
D)-0.38
n = 36
= 24.6S = 12
H0:
20Ha: > 20
-Refer to Exhibit 9-1. The test statistic is
A)2.3
B)0.38
C)-2.3
D)-0.38
Unlock Deck
Unlock for access to all 148 flashcards in this deck.
Unlock Deck
k this deck
Unlock Deck
Unlock for access to all 148 flashcards in this deck.


