Deck 14: Definite Integrals: Techniques of Integration
Full screen (f)
Question
Use the function  from x = 0 to x = 1 and n equal subintervals with the function evaluated at the left-hand endpoints of each subinterval. Find a formula for the sum of the areas of the n rectangles (call this S).
A)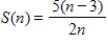
B)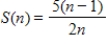
C)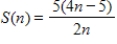
D)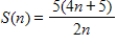
E)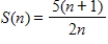
from x = 0 to x = 1 and n equal subintervals with the function evaluated at the left-hand endpoints of each subinterval. Find a formula for the sum of the areas of the n rectangles (call this S). A)
B)
C)
D)
E)
Question
Use the sum formulas to find the value of the sum that follows. 
A)720
B)160
C)435
D)820
E)90
A)720
B)160
C)435
D)820
E)90
Question
Use rectangles to find the area between  and the x-axis from
  to
to 
A)
B)
C)
D)
E)
and the x-axis from to A)
B)
C)
D)
E)
Question
Approximate the area under the curve defined by the function  over the interval x = 0 to x = 3 using the right-hand endpoints of three subintervals (rectangles).
A)
Square units
B)
Square units
C)
Square units
D)
Square units
E)
Square units
over the interval x = 0 to x = 3 using the right-hand endpoints of three subintervals (rectangles). A)
Square units
B)
Square units
C)
Square units
D)
Square units
E)
Square units
Question
Find the numerical value of  by using the sum formulas.
A)44
B)6
C)228
D)229
E)48
by using the sum formulas. A)44
B)6
C)228
D)229
E)48
Question
When the area under 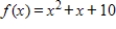 from
from  to
to  is approximated, the formulas for the sum of n rectangles using left-hand endpoints and right-hand endpoints are:
Left-hand endpoints: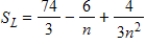
Right-hand endpoints: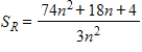
Find and
and  .
.
A)
B)
C)
D)
E)
from to is approximated, the formulas for the sum of n rectangles using left-hand endpoints and right-hand endpoints are: Left-hand endpoints:
Right-hand endpoints:
Find
and .
A)
B)
C)
D)
E)
Question
The graph in the following figure gives the times that it takes a vehicle to reach speeds from 0 mph to 25 mph, in increments of 5 mph, with a curve connecting them. Count the squares under the curve to estimate this distance. Estimate the distance traveled by the vehicle in 14 seconds, to a speed of 25 mph. (Be careful with time units.) 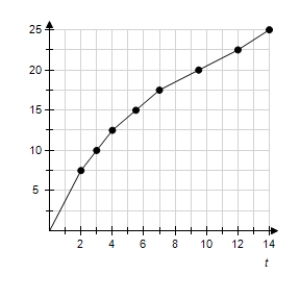
A)1/16 mile
B)4/15 mile
C)1/13 mile
D)1/9 mile
E)1/8 mile
A)1/16 mile
B)4/15 mile
C)1/13 mile
D)1/9 mile
E)1/8 mile
Question
Use the function  from
from  to
to  and n equal subintervals with the function evaluated at the left-hand endpoints of each subinterval. Find
  by using the formula for the sum of the areas of the n rectangles (call this S).
A)
B)
C)
D)
E)
from to and n equal subintervals with the function evaluated at the left-hand endpoints of each subinterval. Find by using the formula for the sum of the areas of the n rectangles (call this S). A)
B)
C)
D)
E)
Question
Find the numerical value of 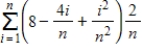 by using the sum formulas.
A)
B)
C)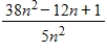
D)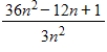
E)
by using the sum formulas. A)
B)
C)
D)
E)
Question
When the area under  from
from  to
to  is approximated, the formulas for the sum of n rectangles using left-hand endpoints and right-hand endpoints are:
Left-hand endpoints: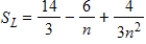
Right-hand endpoints: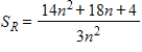
Find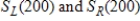
A)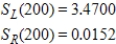
B)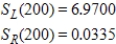
C)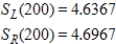
D)
E)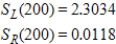
from to is approximated, the formulas for the sum of n rectangles using left-hand endpoints and right-hand endpoints are: Left-hand endpoints:
Right-hand endpoints:
Find
A)
B)
C)
D)
E)
Question
The following table shows the rate of oil consumption (in thousands of barrels per year) by a certain city. Estimate the total consumption of oil by the city from 1999 -2004 by using 5 equal subdivisions and left-hand endpoints to estimate the area under the graph that corresponds to the table from 1999 to 2004. 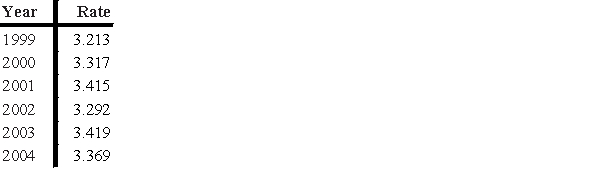
A)17.708 thousand barrels
B)16.656 thousand barrels
C)16.812 thousand barrels
D)17.606 thousand barrels
E)15.733 thousand barrels
A)17.708 thousand barrels
B)16.656 thousand barrels
C)16.812 thousand barrels
D)17.606 thousand barrels
E)15.733 thousand barrels
Question
Approximate the area under the curve over the specified interval by using the indicated number of subintervals (or rectangles) and evaluating the function at the left-hand endpoints of the subintervals. Compute the approximate area using up to 4 decimal places as needed.  from
from  to
to 
 subintervals.
A)11.625 square units
B)23.25 square units
C)19.25 square units
D)46.5 square units
E)2 square units
from to subintervals.
A)11.625 square units
B)23.25 square units
C)19.25 square units
D)46.5 square units
E)2 square units
Question
Suppose the presence of phosphates in certain waste products dumped into a lake promotes the growth of algae. Rampant growth of algae affects the oxygen supply in the water, so an environmental group wishes to estimate the area of algae growth. The group measures the length across the algae growth (see the figure) and obtains the following data (in feet).  Use 8 rectangles with bases of 10 feet and lengths measured at the left-hand endpoints to approximate the area of the algae growth.
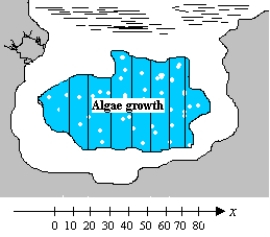
A)1,730 sq ft
B)1,704 sq ft
C)2,076 sq ft
D)2,520 sq ft
E)2,556 sq ft
Use 8 rectangles with bases of 10 feet and lengths measured at the left-hand endpoints to approximate the area of the algae growth.
A)1,730 sq ft
B)1,704 sq ft
C)2,076 sq ft
D)2,520 sq ft
E)2,556 sq ft
Question
Find the value of the sum  , if
, if 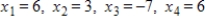 .
.
A)64
B)60
C)20
D)8
E)32
, if . A)64
B)60
C)20
D)8
E)32
Question
Approximate the area under the curve over the specified interval by using the indicated number of subintervals (or rectangles) and evaluating the function at the right-hand endpoints of the subintervals. Compute the approximate area using up to four decimal places as needed. 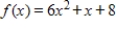 from
from  to
to 
 subintervals.
A)9.25 square units
B)17.5 square units
C)0.5 square unit
D)21 square units
E)37 square units
from to subintervals.
A)9.25 square units
B)17.5 square units
C)0.5 square unit
D)21 square units
E)37 square units
Question
Find the value of the sum 
A)8,784
B)8,808
C)5,675
D)8,800
E)2,622
A)8,784
B)8,808
C)5,675
D)8,800
E)2,622
Question
Use the function  from
from  to
to  and n equal subintervals with the function evaluated at the right-hand endpoints of each subinterval. Let the sum of the areas of the rectangles be S. Find
  by using the formula for the sum of the areas of the n rectangles.
A)10
B)30
C)60
D)12
E)14
from to and n equal subintervals with the function evaluated at the right-hand endpoints of each subinterval. Let the sum of the areas of the rectangles be S. Find by using the formula for the sum of the areas of the n rectangles. A)10
B)30
C)60
D)12
E)14
Question
Approximate the area under the curve defined by the function  over the interval x = 0 to x = 3 using the left-hand endpoints of three subintervals (rectangles).
A)
B)
C)
D)
E)
over the interval x = 0 to x = 3 using the left-hand endpoints of three subintervals (rectangles). A)
B)
C)
D)
E)
Question
Find the value of the given sum and round to four decimal places. 
A)3.2405
B)2.3000
C)2.5571
D)2.0000
E)2.6250
A)3.2405
B)2.3000
C)2.5571
D)2.0000
E)2.6250
Question
Use the function  from
from  to
to  and n equal subintervals with the function evaluated at the right-hand endpoints of each subinterval. Find a formula for the sum of the areas of the n rectangles (call this S).
A)
B)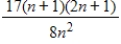
C)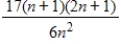
D)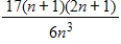
E)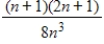
from to and n equal subintervals with the function evaluated at the right-hand endpoints of each subinterval. Find a formula for the sum of the areas of the n rectangles (call this S). A)
B)
C)
D)
E)
Question
Evaluate 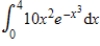 .
.
A)
B)
C)
D)
E)
. A)
B)
C)
D)
E)
Question
Evaluate the definite integral  .
.
A)
B)
C)
D)
E)
. A)
B)
C)
D)
E)
Question
Evaluate  .
.
A)
B)
C)
D)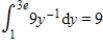
E)
. A)
B)
C)
D)
E)
Question
Evaluate the definite integral  .
.
A)-160
B)-290
C)-70
D)-140
E)-65
. A)-160
B)-290
C)-70
D)-140
E)-65
Question
Evaluate the definite integral  .
.
A)
B)
C)
D)
E)
. A)
B)
C)
D)
E)
Question
Evaluate the definite integral  .
.
A)
B)
C)
D)
E)
. A)
B)
C)
D)
E)
Question
Find the area between the curve  and the x-axis from
  to
to  .
.
A)
B)
C)
D)
E)
and the x-axis from to . A)
B)
C)
D)
E)
Question
Evaluate  .
.
A)8
B)2
C)6
D)3
E)0
. A)8
B)2
C)6
D)3
E)0
Question
Find the shaded area between the given function and the x-axis. 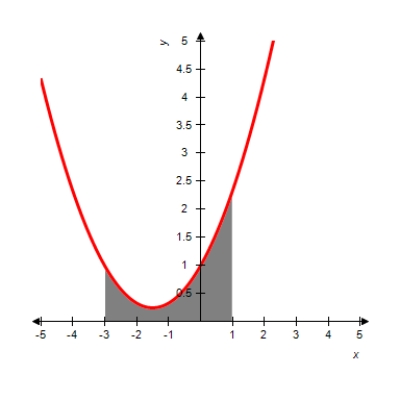
A)
B)
C)
D)
E)
A)
B)
C)
D)
E)
Question
Find the area between the curve  and the x-axis from
  to
to  .
.
A)
B)
C)
D)
E)
and the x-axis from to . A)
B)
C)
D)
E)
Question
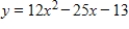
True or false. For the function  gives the area between the graph of
  and the x-axis from
  .
.
A)True
B)False
gives the area between the graph of and the x-axis from . A)True
B)False
Question
Evaluate the definite integral  .
.
A)0
B)576
C)-576
D)-1152
E)1152
. A)0
B)576
C)-576
D)-1152
E)1152
Question
Suppose spending for a wireless communications services (in billions of dollars per year) can be modeled by the function  where
where  represents 1995. Use
  equal subdivisions with right-hand endpoints to approximate the area under the graph of S(t) between
  and
and  . Round your answer to one decimal place.
A)1,079.1 billion dollars
B)506.5 billion dollars
C)575.3 billion dollars
D)440.9 billion dollars
E)539.5 billion dollars
where represents 1995. Use equal subdivisions with right-hand endpoints to approximate the area under the graph of S(t) between and . Round your answer to one decimal place. A)1,079.1 billion dollars
B)506.5 billion dollars
C)575.3 billion dollars
D)440.9 billion dollars
E)539.5 billion dollars
Question
The rate of depreciation of a building is given by 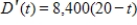 dollars per year,
  . Use the definite integral to find the total depreciation over the first 20 years.
A)$1,680,000
B)$84,000
C)$840,000
D)$480,000
E)$3,360,000
dollars per year, . Use the definite integral to find the total depreciation over the first 20 years. A)$1,680,000
B)$84,000
C)$840,000
D)$480,000
E)$3,360,000
Question
Evaluate the definite integral 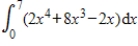 .
.
A)
B)
C)
D)
E)
. A)
B)
C)
D)
E)
Question
Use the figure to decide which of 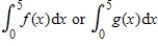 is larger, or if they are equal.
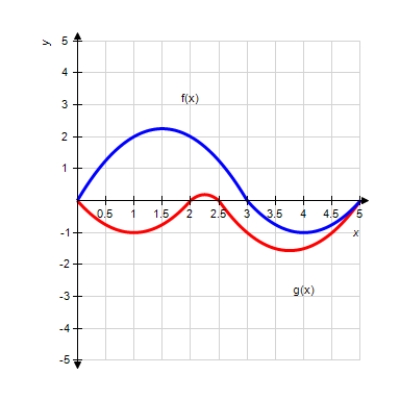
A)
B)
C)
is larger, or if they are equal. A)
B)
C)
Question
Evaluate the given integral with the Fundamental Theorem of Calculus  .
.
A)-26
B)-25
C)-28
D)-35
E)-31
. A)-26
B)-25
C)-28
D)-35
E)-31
Question
The United States' spending for military (in billions of dollars per year) can be modeled by 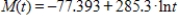 , where
  represents 1993. Estimate the total spending for the United States military between 2000 and 2005 by using 10 equal subdivisions and right-hand endpoints to approximate the area under the graph of M(t) between
  and
and  . Round to three decimal places.
A)3,084.662 billion dollars
B)2,768.887 billion dollars
C)2,794.895 billion dollars
D)2,527.474 billion dollars
E)2,845.774 billion dollars
, where represents 1993. Estimate the total spending for the United States military between 2000 and 2005 by using 10 equal subdivisions and right-hand endpoints to approximate the area under the graph of M(t) between and . Round to three decimal places. A)3,084.662 billion dollars
B)2,768.887 billion dollars
C)2,794.895 billion dollars
D)2,527.474 billion dollars
E)2,845.774 billion dollars
Question
Evaluate the definite integral  .
.
A)
B)
C)
D)
E)
. A)
B)
C)
D)
E)
Question
Evaluate the definite integral  .
.
A)
B)
C)
D)
E)
. A)
B)
C)
D)
E)
Question
Find the area of the region enclosed by the graphs of  and
and  .
.
A)
B)
C)
D)
E)
and . A)
B)
C)
D)
E)
Question
Equations are given whose graphs enclose a region. Find the area of the region.  ,
,  ,
,  and
and 
A)
B)
C)
D)
E)
, , and A)
B)
C)
D)
E)
Question
Assume that a store finds that its sales revenue changes at a rate given by 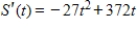 dollars per day, where t is the number of days after an advertising campaign ends and
  . Find the total sales for the second week after the campaign ends
  to
to  .
.
A)$5,733
B)$6,909
C)$4,179
D)$12,117
E)$1,575
dollars per day, where t is the number of days after an advertising campaign ends and . Find the total sales for the second week after the campaign ends to . A)$5,733
B)$6,909
C)$4,179
D)$12,117
E)$1,575
Question
Suppose in a small city the response time t (in minutes) of the fire company is given by the probability density function 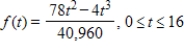 . For a fire chosen at random, find the probability that the response time is 10 minutes or less. Round your answer to three decimal places.
A)0.242
B)0.567
C)0.391
D)0.758
E)0.609
. For a fire chosen at random, find the probability that the response time is 10 minutes or less. Round your answer to three decimal places. A)0.242
B)0.567
C)0.391
D)0.758
E)0.609
Question
Find the average value of the given function over the given interval. 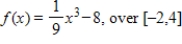
A)
B)
C)
D)
E)
A)
B)
C)
D)
E)
Question
Find the average value of the function  over
over 
A)48
B)96
C)44
D)12
E)-36
over A)48
B)96
C)44
D)12
E)-36
Question
Find the area of the shaded region.
A)
B)
C)
D)
E)
A)
B)
C)
D)
E)
Question
Equations are given whose graphs enclose a region. Find the area of the region. 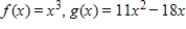
A)
B)
C)
D)
E)
A)
B)
C)
D)
E)
Question
Suppose the rate of production of a new line of products is given by  where x is the number of items produced and t is the number of weeks the products have been in production. How many units were produced in the first 6 weeks? Round your answer to the nearest unit produced.
A)1,300 units
B)2,300 units
C)2,600 units
D)1,000 units
E)2,000 units
where x is the number of items produced and t is the number of weeks the products have been in production. How many units were produced in the first 6 weeks? Round your answer to the nearest unit produced. A)1,300 units
B)2,300 units
C)2,600 units
D)1,000 units
E)2,000 units
Question
Suppose that a vending machine service company models its income by assuming that money flows continuously into the machines, with the annual rate of flow given by 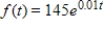 in thousands of dollars per year. Find the total income from the machines predicted by the model over the first 5 years. Round your answer to the nearest thousand dollars.
A)$29,743,000
B)$592,000
C)$743,000
D)$897,000
E)$29,592,000
in thousands of dollars per year. Find the total income from the machines predicted by the model over the first 5 years. Round your answer to the nearest thousand dollars. A)$29,743,000
B)$592,000
C)$743,000
D)$897,000
E)$29,592,000
Question
Find the area of the shaded region. 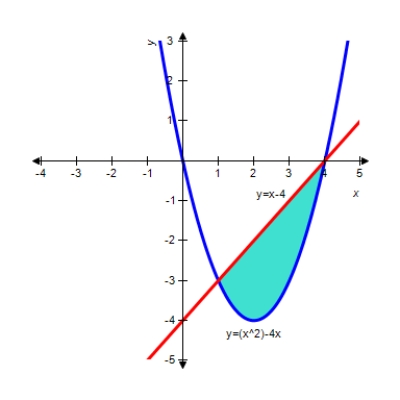
A)
B)
C)
D)
E)
A)
B)
C)
D)
E)
Question
Market revenue for Hammer Inc. (in millions of dollars per year) can be modeled by  , where
  represents 1990. Evaluate
  . Round your answer to the nearest cent.
A)$1,358.51
B)$15,558.45
C)$93,350.70
D)$10,372.30
E)$51,861.50
, where represents 1990. Evaluate . Round your answer to the nearest cent. A)$1,358.51
B)$15,558.45
C)$93,350.70
D)$10,372.30
E)$51,861.50
Question
Find the area of the shaded region for the graph given below. 
A)
B)
C)
D)
E)
A)
B)
C)
D)
E)
Question
Find the average value of the function 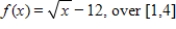
A)
B)
C)
D)
E)
A)
B)
C)
D)
E)
Question
The average life for a particular brand of car battery is given by the following probability density function where t is in years. 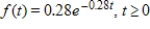 Find the probability that a battery chosen at random lasts between 2 and 7 years. Round your answer to two decimal places.
A)1.72
B)0.43
C)0.54
D)0.34
E)0.65
Find the probability that a battery chosen at random lasts between 2 and 7 years. Round your answer to two decimal places. A)1.72
B)0.43
C)0.54
D)0.34
E)0.65
Question
Find the area of the region bounded by 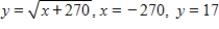
A)
B)
C)
D)
E)
A)
B)
C)
D)
E)
Question
Find the area of the shaded region for the graph given below. 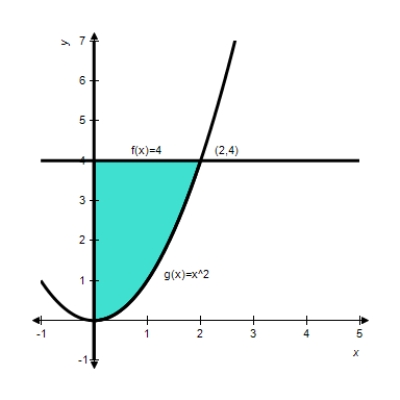
A)
B)
C)
D)
E)
A)
B)
C)
D)
E)
Question
Find the area of the region enclosed by 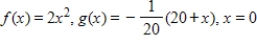 and
and  .
.
A)
B)
C)
D)
E)
and . A)
B)
C)
D)
E)
Question
Equations are given whose graphs enclose a region. Find the area of the region.  ,
, 
A)
B)
C)
D)
E)
, A)
B)
C)
D)
E)
Question
Find the area of the shaded region. Round to the nearest hundredth if necessary. 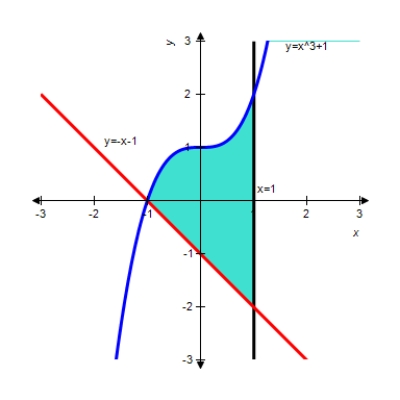
A)
B)2
C)4
D)
E)3
A)
B)2
C)4
D)
E)3
Question
For a certain product, the total revenue is given by  , and the total cost is given by
  . Write an integral that gives the average profit for the product over the interval from 4 to 11
A)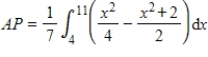
B)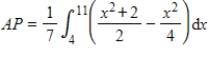
C)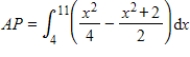
D)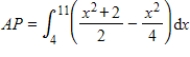
E)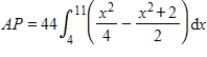
, and the total cost is given by . Write an integral that gives the average profit for the product over the interval from 4 to 11 A)
B)
C)
D)
E)
Question
Suppose the number of daily sales of a product was found to be given by  , x days after the start of an advertising campaign for this product. Find the average daily sales during the first 25 days of the campaign-that is, from
  to
to  . Round your answer to the nearest dollar.
A)$133
B)$130
C)$127
D)$265
E)$255
, x days after the start of an advertising campaign for this product. Find the average daily sales during the first 25 days of the campaign-that is, from to . Round your answer to the nearest dollar. A)$133
B)$130
C)$127
D)$265
E)$255
Question
The Lorenz curve for the income distribution in a certain country in 2005 is given by  . Find the Gini coefficient of income for 2005 for this country. Round your answer to four decimal places.
A)0.3576
B)0.4648
C)0.5614
D)0.2103
E)0.2668
. Find the Gini coefficient of income for 2005 for this country. Round your answer to four decimal places. A)0.3576
B)0.4648
C)0.5614
D)0.2103
E)0.2668
Question
The demand function for a certain product is given by  , where p is the price and q is the number of units demanded. Find the average price as demand ranges from 24 to 92 units. Round your answer to the nearest penny.
A)$576.51
B)$290.51
C)$1,238.44
D)$427.05
E)$982.21
, where p is the price and q is the number of units demanded. Find the average price as demand ranges from 24 to 92 units. Round your answer to the nearest penny. A)$576.51
B)$290.51
C)$1,238.44
D)$427.05
E)$982.21
Question
A 58-year-old couple are considering opening a business of their own. They will either purchase an established Gift and Card Shoppe or open a new Video Rental Palace. The Gift Shoppe has a continuous income stream with an annual rate of flow at time t given by  (dollars per year) and the Video Palace has a continuous income stream with a projected annual rate of flow at time t given by
  (dollars per year). The initial investment is the same for both businesses, and money is worth 10% compounded continuously. Find the present value of the Video Palace over the next 8 years (until the couple reach age 66). Round your answer to the nearest dollar.
A)$222,961
B)$220,268
C)$202,618
D)$237,342
E)$181,863
(dollars per year) and the Video Palace has a continuous income stream with a projected annual rate of flow at time t given by (dollars per year). The initial investment is the same for both businesses, and money is worth 10% compounded continuously. Find the present value of the Video Palace over the next 8 years (until the couple reach age 66). Round your answer to the nearest dollar. A)$222,961
B)$220,268
C)$202,618
D)$237,342
E)$181,863
Question
A small brewery considers the output of its bottling machine as a continuous income stream with an annual rate of flow at time t given by  in thousands of dollars per year. Find the income from this stream for the next 30 years. Round your answer to the nearest dollar.
A)$712,660
B)$716,213
C)$703,158
D)$722,162
E)$708,733
in thousands of dollars per year. Find the income from this stream for the next 30 years. Round your answer to the nearest dollar. A)$712,660
B)$716,213
C)$703,158
D)$722,162
E)$708,733
Question
A 58-year-old couple are considering opening a business of their own. They will either purchase an established Gift and Card Shoppe or open a new Video Rental Palace. The Gift Shoppe has a continuous income stream with an annual rate of flow at time t given by  (dollars per year) and the Video Palace has a continuous income stream with a projected annual rate of flow at time t given by
  (dollars per year). The initial investment is the same for both businesses, and money is worth 10% compounded continuously. Determine which is the better buy by finding the present value of each business over the next 7 years (until the couple reach age 65).
A)the Video Palace
B)the Gift Shoppe
(dollars per year) and the Video Palace has a continuous income stream with a projected annual rate of flow at time t given by (dollars per year). The initial investment is the same for both businesses, and money is worth 10% compounded continuously. Determine which is the better buy by finding the present value of each business over the next 7 years (until the couple reach age 65). A)the Video Palace
B)the Gift Shoppe
Question
The cost of producing x units of a certain item is  Find the average value of the cost function C(x) over the interval from 0 to 1,000. Round answer to nearest penny.
A)$933,866.67
B)$2,801,600.00
C)$549,333.33
D)$3,735,466.67
E)$2,147,893.33
Find the average value of the cost function C(x) over the interval from 0 to 1,000. Round answer to nearest penny. A)$933,866.67
B)$2,801,600.00
C)$549,333.33
D)$3,735,466.67
E)$2,147,893.33
Question
Suppose that the Carter Car Service franchise finds that the income generated by its stores can be modeled by assuming that the income is a continuous stream with a monthly rate of flow at time t given by  (dollars per month). Find the total income from a Carter Car Service store for years 3 through 5 of operation and round to the nearest penny.
A)$973,587.71
B)$2,307,500.23
C)$1,059,312.41
D)$1,684,306.74
E)$1,186,131.50
(dollars per month). Find the total income from a Carter Car Service store for years 3 through 5 of operation and round to the nearest penny. A)$973,587.71
B)$2,307,500.23
C)$1,059,312.41
D)$1,684,306.74
E)$1,186,131.50
Question
The Carter Car Service franchise has a continuous income stream with a monthly rate of flow modeled by  (dollars per month). Find the average flow of income over years 2 to 7. Round your answer to the nearest cent.
A)$37,861.91
B)$32,623.16
C)$89,736.51
D)$51,870.82
E)$36,528.74
(dollars per month). Find the average flow of income over years 2 to 7. Round your answer to the nearest cent. A)$37,861.91
B)$32,623.16
C)$89,736.51
D)$51,870.82
E)$36,528.74
Question
Assume that the tax burden per capita (in dollars) for selected years from 1950 to 2002 can be modeled by  where
where  represents 1950. If the model remains valid, find the predicted average federal tax burden per capita from 2000 to 2010. Round your answer to the nearest dollar.
A)$8,982 federal tax per capita
B)$9,881 average federal tax per capita
C)$19,117 average federal tax per capita
D)$21,241 average federal tax per capita
E)$10,978 average federal tax per capita
where represents 1950. If the model remains valid, find the predicted average federal tax burden per capita from 2000 to 2010. Round your answer to the nearest dollar. A)$8,982 federal tax per capita
B)$9,881 average federal tax per capita
C)$19,117 average federal tax per capita
D)$21,241 average federal tax per capita
E)$10,978 average federal tax per capita
Question
Suppose that a printing firm considers the production of its presses as a continuous income stream. If the annual rate of flow at time t is given by  in thousands of dollars per year, and if money is worth 7% compounded continuously, find the present value and future value of the presses over the next 10 years. Round your answer to the nearest dollar.
A)Present Value: $212,562; Future Value: $428,047
B)Present Value: $181,071; Future Value: $364,632
C)Present Value: $119,242; Future Value: $240,124
D)Present Value: $193,878; Future Value: $390,422
E)Present Value: $127,833; Future Value: $257,424
in thousands of dollars per year, and if money is worth 7% compounded continuously, find the present value and future value of the presses over the next 10 years. Round your answer to the nearest dollar. A)Present Value: $212,562; Future Value: $428,047
B)Present Value: $181,071; Future Value: $364,632
C)Present Value: $119,242; Future Value: $240,124
D)Present Value: $193,878; Future Value: $390,422
E)Present Value: $127,833; Future Value: $257,424
Question
Suppose that a vending machine company is considering selling some of its machines. Suppose further that the income from these particular machines is a continuous stream with an annual rate of flow at time t given by  Find the present value and future value of the machines over the next 3 years if the money is worth 11% compounded continuously. Round answers to the nearest dollar.
A)PV = $1,893 FV = $2,633
B)PV = $1,893 FV = $2,349
C)PV = $1,689 FV = $2,349
D)PV = $1,689 FV = $2,633
E)PV = $2,364 FV = $2,633
Find the present value and future value of the machines over the next 3 years if the money is worth 11% compounded continuously. Round answers to the nearest dollar. A)PV = $1,893 FV = $2,633
B)PV = $1,893 FV = $2,349
C)PV = $1,689 FV = $2,349
D)PV = $1,689 FV = $2,633
E)PV = $2,364 FV = $2,633
Question
Suppose the Gini coefficient of income for a certain country is  If the Lorenz curve for this country is
  , find the value of p.
A)12
B)11
C)10
D)13
E)14
If the Lorenz curve for this country is , find the value of p. A)12
B)11
C)10
D)13
E)14
Question
The demand function for a product is  where p is in millions of dollars and x is the number of thousands of units. If the equilibrium price is $6 million, what is the consumer's surplus? Round your answer to the nearest million dollars.
A)114 million dollars
B)149 million dollars
C)83 million dollars
D)88 million dollars
E)174 million dollars
where p is in millions of dollars and x is the number of thousands of units. If the equilibrium price is $6 million, what is the consumer's surplus? Round your answer to the nearest million dollars. A)114 million dollars
B)149 million dollars
C)83 million dollars
D)88 million dollars
E)174 million dollars
Question
A continuous income stream has an annual rate of flow at time t given by  (dollars per year). Find the present value of this income stream for the next 9 years, if the money is worth 4% compounded continuously. Round to the nearest dollar.
A)$47,664
B)$107,767
C)$178,262
D)$147,471
E)$81,028
(dollars per year). Find the present value of this income stream for the next 9 years, if the money is worth 4% compounded continuously. Round to the nearest dollar. A)$47,664
B)$107,767
C)$178,262
D)$147,471
E)$81,028
Question
A drug manufacturer has developed a time-release capsule with the number of milligrams of the drug in the bloodstream given by 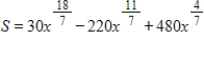 where x is in hours and
  . Find the average number of milligrams of the drug in the bloodstream for the first 3 hours after a capsule is taken. Round your answer to the nearest milligram.
A)350 mg
B)266 mg
C)233 mg
D)175 mg
E)200 mg
where x is in hours and . Find the average number of milligrams of the drug in the bloodstream for the first 3 hours after a capsule is taken. Round your answer to the nearest milligram. A)350 mg
B)266 mg
C)233 mg
D)175 mg
E)200 mg
Question
Suppose that the income from a slot machine in a casino flows continuously at a rate of 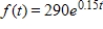 , where t is the time in hours since the casino opened. The total income during the first 8 hours is given by
  . Find the average income over the first 8 hours.
A)$289.02
B)$313.24
C)$728.90
D)$560.69
E)$953.18
, where t is the time in hours since the casino opened. The total income during the first 8 hours is given by . Find the average income over the first 8 hours. A)$289.02
B)$313.24
C)$728.90
D)$560.69
E)$953.18
Question
A franchise models the profit from its store as a continuous income stream with a monthly rate of flow at time t given by 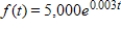 (dollars per month). When a new store opens, its manager is judged against the model, with special emphasis on the second half of the first year. Find the total profit for the second 6-month period
  to
to  . Round your answer to the nearest dollar.
A)$61,831
B)$51,679
C)$40,973
D)$30,821
E)$46,232
(dollars per month). When a new store opens, its manager is judged against the model, with special emphasis on the second half of the first year. Find the total profit for the second 6-month period to . Round your answer to the nearest dollar. A)$61,831
B)$51,679
C)$40,973
D)$30,821
E)$46,232
Question
In an effort to make the distribution of income more nearly equal, the government of a country passes a tax law that changes the Lorenz curve from  for 2004 to
  for 2005. Find the Gini coefficient of income for both years. Round your answer to six decimal places.
A)2004: 0.317536 2005: 0.155385
B)2004: 0.416149 2005: 0.208966
C)2004: 0.256705 2005: 0.123673
D)2004: 0.215434 2005: 0.102712
E)2004: 0.603604 2005: 0.318947
for 2004 to for 2005. Find the Gini coefficient of income for both years. Round your answer to six decimal places. A)2004: 0.317536 2005: 0.155385
B)2004: 0.416149 2005: 0.208966
C)2004: 0.256705 2005: 0.123673
D)2004: 0.215434 2005: 0.102712
E)2004: 0.603604 2005: 0.318947

Unlock Deck
Sign up to unlock the cards in this deck!
Unlock Deck
Unlock Deck
1/185
Play
Full screen (f)
Deck 14: Definite Integrals: Techniques of Integration
1
Use the function from x = 0 to x = 1 and n equal subintervals with the function evaluated at the left-hand endpoints of each subinterval. Find a formula for the sum of the areas of the n rectangles (call this S).
A)
B)
C)
D)
E)
from x = 0 to x = 1 and n equal subintervals with the function evaluated at the left-hand endpoints of each subinterval. Find a formula for the sum of the areas of the n rectangles (call this S). A)
B)
C)
D)
E)
2
Use the sum formulas to find the value of the sum that follows.
A)720
B)160
C)435
D)820
E)90
A)720
B)160
C)435
D)820
E)90
820
3
Use rectangles to find the area between and the x-axis from to
A)
B)
C)
D)
E)
and the x-axis from to A)
B)
C)
D)
E)
4
Approximate the area under the curve defined by the function over the interval x = 0 to x = 3 using the right-hand endpoints of three subintervals (rectangles).
A)
Square units
B)
Square units
C)
Square units
D)
Square units
E)
Square units
over the interval x = 0 to x = 3 using the right-hand endpoints of three subintervals (rectangles). A)
Square units
B)
Square units
C)
Square units
D)
Square units
E)
Square units
Unlock Deck
Unlock for access to all 185 flashcards in this deck.
Unlock Deck
k this deck
5
Find the numerical value of by using the sum formulas.
A)44
B)6
C)228
D)229
E)48
by using the sum formulas. A)44
B)6
C)228
D)229
E)48
Unlock Deck
Unlock for access to all 185 flashcards in this deck.
Unlock Deck
k this deck
6
When the area under from to is approximated, the formulas for the sum of n rectangles using left-hand endpoints and right-hand endpoints are:
Left-hand endpoints:
Right-hand endpoints:
Find and .
A)
B)
C)
D)
E)
from to is approximated, the formulas for the sum of n rectangles using left-hand endpoints and right-hand endpoints are: Left-hand endpoints:
Right-hand endpoints:
Find
and .
A)
B)
C)
D)
E)
Unlock Deck
Unlock for access to all 185 flashcards in this deck.
Unlock Deck
k this deck
7
The graph in the following figure gives the times that it takes a vehicle to reach speeds from 0 mph to 25 mph, in increments of 5 mph, with a curve connecting them. Count the squares under the curve to estimate this distance. Estimate the distance traveled by the vehicle in 14 seconds, to a speed of 25 mph. (Be careful with time units.)
A)1/16 mile
B)4/15 mile
C)1/13 mile
D)1/9 mile
E)1/8 mile
A)1/16 mile
B)4/15 mile
C)1/13 mile
D)1/9 mile
E)1/8 mile
Unlock Deck
Unlock for access to all 185 flashcards in this deck.
Unlock Deck
k this deck
8
Use the function from to and n equal subintervals with the function evaluated at the left-hand endpoints of each subinterval. Find by using the formula for the sum of the areas of the n rectangles (call this S).
A)
B)
C)
D)
E)
from to and n equal subintervals with the function evaluated at the left-hand endpoints of each subinterval. Find by using the formula for the sum of the areas of the n rectangles (call this S). A)
B)
C)
D)
E)
Unlock Deck
Unlock for access to all 185 flashcards in this deck.
Unlock Deck
k this deck
9
Find the numerical value of by using the sum formulas.
A)
B)
C)
D)
E)
by using the sum formulas. A)
B)
C)
D)
E)
Unlock Deck
Unlock for access to all 185 flashcards in this deck.
Unlock Deck
k this deck
10
When the area under from to is approximated, the formulas for the sum of n rectangles using left-hand endpoints and right-hand endpoints are:
Left-hand endpoints:
Right-hand endpoints:
Find
A)
B)
C)
D)
E)
from to is approximated, the formulas for the sum of n rectangles using left-hand endpoints and right-hand endpoints are: Left-hand endpoints:
Right-hand endpoints:
Find
A)
B)
C)
D)
E)
Unlock Deck
Unlock for access to all 185 flashcards in this deck.
Unlock Deck
k this deck
11
The following table shows the rate of oil consumption (in thousands of barrels per year) by a certain city. Estimate the total consumption of oil by the city from 1999 -2004 by using 5 equal subdivisions and left-hand endpoints to estimate the area under the graph that corresponds to the table from 1999 to 2004.
A)17.708 thousand barrels
B)16.656 thousand barrels
C)16.812 thousand barrels
D)17.606 thousand barrels
E)15.733 thousand barrels
A)17.708 thousand barrels
B)16.656 thousand barrels
C)16.812 thousand barrels
D)17.606 thousand barrels
E)15.733 thousand barrels
Unlock Deck
Unlock for access to all 185 flashcards in this deck.
Unlock Deck
k this deck
12
Approximate the area under the curve over the specified interval by using the indicated number of subintervals (or rectangles) and evaluating the function at the left-hand endpoints of the subintervals. Compute the approximate area using up to 4 decimal places as needed. from to subintervals.
A)11.625 square units
B)23.25 square units
C)19.25 square units
D)46.5 square units
E)2 square units
from to subintervals.
A)11.625 square units
B)23.25 square units
C)19.25 square units
D)46.5 square units
E)2 square units
Unlock Deck
Unlock for access to all 185 flashcards in this deck.
Unlock Deck
k this deck
13
Suppose the presence of phosphates in certain waste products dumped into a lake promotes the growth of algae. Rampant growth of algae affects the oxygen supply in the water, so an environmental group wishes to estimate the area of algae growth. The group measures the length across the algae growth (see the figure) and obtains the following data (in feet). Use 8 rectangles with bases of 10 feet and lengths measured at the left-hand endpoints to approximate the area of the algae growth.
A)1,730 sq ft
B)1,704 sq ft
C)2,076 sq ft
D)2,520 sq ft
E)2,556 sq ft
Use 8 rectangles with bases of 10 feet and lengths measured at the left-hand endpoints to approximate the area of the algae growth.
A)1,730 sq ft
B)1,704 sq ft
C)2,076 sq ft
D)2,520 sq ft
E)2,556 sq ft
Unlock Deck
Unlock for access to all 185 flashcards in this deck.
Unlock Deck
k this deck
14
Find the value of the sum , if .
A)64
B)60
C)20
D)8
E)32
, if . A)64
B)60
C)20
D)8
E)32
Unlock Deck
Unlock for access to all 185 flashcards in this deck.
Unlock Deck
k this deck
15
Approximate the area under the curve over the specified interval by using the indicated number of subintervals (or rectangles) and evaluating the function at the right-hand endpoints of the subintervals. Compute the approximate area using up to four decimal places as needed. from to subintervals.
A)9.25 square units
B)17.5 square units
C)0.5 square unit
D)21 square units
E)37 square units
from to subintervals.
A)9.25 square units
B)17.5 square units
C)0.5 square unit
D)21 square units
E)37 square units
Unlock Deck
Unlock for access to all 185 flashcards in this deck.
Unlock Deck
k this deck
16
Find the value of the sum
A)8,784
B)8,808
C)5,675
D)8,800
E)2,622
A)8,784
B)8,808
C)5,675
D)8,800
E)2,622
Unlock Deck
Unlock for access to all 185 flashcards in this deck.
Unlock Deck
k this deck
17
Use the function from to and n equal subintervals with the function evaluated at the right-hand endpoints of each subinterval. Let the sum of the areas of the rectangles be S. Find by using the formula for the sum of the areas of the n rectangles.
A)10
B)30
C)60
D)12
E)14
from to and n equal subintervals with the function evaluated at the right-hand endpoints of each subinterval. Let the sum of the areas of the rectangles be S. Find by using the formula for the sum of the areas of the n rectangles. A)10
B)30
C)60
D)12
E)14
Unlock Deck
Unlock for access to all 185 flashcards in this deck.
Unlock Deck
k this deck
18
Approximate the area under the curve defined by the function over the interval x = 0 to x = 3 using the left-hand endpoints of three subintervals (rectangles).
A)
B)
C)
D)
E)
over the interval x = 0 to x = 3 using the left-hand endpoints of three subintervals (rectangles). A)
B)
C)
D)
E)
Unlock Deck
Unlock for access to all 185 flashcards in this deck.
Unlock Deck
k this deck
19
Find the value of the given sum and round to four decimal places.
A)3.2405
B)2.3000
C)2.5571
D)2.0000
E)2.6250
A)3.2405
B)2.3000
C)2.5571
D)2.0000
E)2.6250
Unlock Deck
Unlock for access to all 185 flashcards in this deck.
Unlock Deck
k this deck
20
Use the function from to and n equal subintervals with the function evaluated at the right-hand endpoints of each subinterval. Find a formula for the sum of the areas of the n rectangles (call this S).
A)
B)
C)
D)
E)
from to and n equal subintervals with the function evaluated at the right-hand endpoints of each subinterval. Find a formula for the sum of the areas of the n rectangles (call this S). A)
B)
C)
D)
E)
Unlock Deck
Unlock for access to all 185 flashcards in this deck.
Unlock Deck
k this deck
21
Evaluate .
A)
B)
C)
D)
E)
. A)
B)
C)
D)
E)
Unlock Deck
Unlock for access to all 185 flashcards in this deck.
Unlock Deck
k this deck
22
Evaluate the definite integral .
A)
B)
C)
D)
E)
. A)
B)
C)
D)
E)
Unlock Deck
Unlock for access to all 185 flashcards in this deck.
Unlock Deck
k this deck
23
Evaluate .
A)
B)
C)
D)
E)
. A)
B)
C)
D)
E)
Unlock Deck
Unlock for access to all 185 flashcards in this deck.
Unlock Deck
k this deck
24
Evaluate the definite integral .
A)-160
B)-290
C)-70
D)-140
E)-65
. A)-160
B)-290
C)-70
D)-140
E)-65
Unlock Deck
Unlock for access to all 185 flashcards in this deck.
Unlock Deck
k this deck
25
Evaluate the definite integral .
A)
B)
C)
D)
E)
. A)
B)
C)
D)
E)
Unlock Deck
Unlock for access to all 185 flashcards in this deck.
Unlock Deck
k this deck
26
Evaluate the definite integral .
A)
B)
C)
D)
E)
. A)
B)
C)
D)
E)
Unlock Deck
Unlock for access to all 185 flashcards in this deck.
Unlock Deck
k this deck
27
Find the area between the curve and the x-axis from to .
A)
B)
C)
D)
E)
and the x-axis from to . A)
B)
C)
D)
E)
Unlock Deck
Unlock for access to all 185 flashcards in this deck.
Unlock Deck
k this deck
28
Evaluate .
A)8
B)2
C)6
D)3
E)0
. A)8
B)2
C)6
D)3
E)0
Unlock Deck
Unlock for access to all 185 flashcards in this deck.
Unlock Deck
k this deck
29
Find the shaded area between the given function and the x-axis.
A)
B)
C)
D)
E)
A)
B)
C)
D)
E)
Unlock Deck
Unlock for access to all 185 flashcards in this deck.
Unlock Deck
k this deck
30
Find the area between the curve and the x-axis from to .
A)
B)
C)
D)
E)
and the x-axis from to . A)
B)
C)
D)
E)
Unlock Deck
Unlock for access to all 185 flashcards in this deck.
Unlock Deck
k this deck
31
True or false. For the function gives the area between the graph of and the x-axis from .
A)True
B)False
gives the area between the graph of and the x-axis from . A)True
B)False
Unlock Deck
Unlock for access to all 185 flashcards in this deck.
Unlock Deck
k this deck
32
Evaluate the definite integral .
A)0
B)576
C)-576
D)-1152
E)1152
. A)0
B)576
C)-576
D)-1152
E)1152
Unlock Deck
Unlock for access to all 185 flashcards in this deck.
Unlock Deck
k this deck
33
Suppose spending for a wireless communications services (in billions of dollars per year) can be modeled by the function where represents 1995. Use equal subdivisions with right-hand endpoints to approximate the area under the graph of S(t) between and . Round your answer to one decimal place.
A)1,079.1 billion dollars
B)506.5 billion dollars
C)575.3 billion dollars
D)440.9 billion dollars
E)539.5 billion dollars
where represents 1995. Use equal subdivisions with right-hand endpoints to approximate the area under the graph of S(t) between and . Round your answer to one decimal place. A)1,079.1 billion dollars
B)506.5 billion dollars
C)575.3 billion dollars
D)440.9 billion dollars
E)539.5 billion dollars
Unlock Deck
Unlock for access to all 185 flashcards in this deck.
Unlock Deck
k this deck
34
The rate of depreciation of a building is given by dollars per year, . Use the definite integral to find the total depreciation over the first 20 years.
A)$1,680,000
B)$84,000
C)$840,000
D)$480,000
E)$3,360,000
dollars per year, . Use the definite integral to find the total depreciation over the first 20 years. A)$1,680,000
B)$84,000
C)$840,000
D)$480,000
E)$3,360,000
Unlock Deck
Unlock for access to all 185 flashcards in this deck.
Unlock Deck
k this deck
35
Evaluate the definite integral .
A)
B)
C)
D)
E)
. A)
B)
C)
D)
E)
Unlock Deck
Unlock for access to all 185 flashcards in this deck.
Unlock Deck
k this deck
36
Use the figure to decide which of is larger, or if they are equal.
A)
B)
C)
is larger, or if they are equal. A)
B)
C)
Unlock Deck
Unlock for access to all 185 flashcards in this deck.
Unlock Deck
k this deck
37
Evaluate the given integral with the Fundamental Theorem of Calculus .
A)-26
B)-25
C)-28
D)-35
E)-31
. A)-26
B)-25
C)-28
D)-35
E)-31
Unlock Deck
Unlock for access to all 185 flashcards in this deck.
Unlock Deck
k this deck
38
The United States' spending for military (in billions of dollars per year) can be modeled by , where represents 1993. Estimate the total spending for the United States military between 2000 and 2005 by using 10 equal subdivisions and right-hand endpoints to approximate the area under the graph of M(t) between and . Round to three decimal places.
A)3,084.662 billion dollars
B)2,768.887 billion dollars
C)2,794.895 billion dollars
D)2,527.474 billion dollars
E)2,845.774 billion dollars
, where represents 1993. Estimate the total spending for the United States military between 2000 and 2005 by using 10 equal subdivisions and right-hand endpoints to approximate the area under the graph of M(t) between and . Round to three decimal places. A)3,084.662 billion dollars
B)2,768.887 billion dollars
C)2,794.895 billion dollars
D)2,527.474 billion dollars
E)2,845.774 billion dollars
Unlock Deck
Unlock for access to all 185 flashcards in this deck.
Unlock Deck
k this deck
39
Evaluate the definite integral .
A)
B)
C)
D)
E)
. A)
B)
C)
D)
E)
Unlock Deck
Unlock for access to all 185 flashcards in this deck.
Unlock Deck
k this deck
40
Evaluate the definite integral .
A)
B)
C)
D)
E)
. A)
B)
C)
D)
E)
Unlock Deck
Unlock for access to all 185 flashcards in this deck.
Unlock Deck
k this deck
41
Find the area of the region enclosed by the graphs of and .
A)
B)
C)
D)
E)
and . A)
B)
C)
D)
E)
Unlock Deck
Unlock for access to all 185 flashcards in this deck.
Unlock Deck
k this deck
42
Equations are given whose graphs enclose a region. Find the area of the region. , , and
A)
B)
C)
D)
E)
, , and A)
B)
C)
D)
E)
Unlock Deck
Unlock for access to all 185 flashcards in this deck.
Unlock Deck
k this deck
43
Assume that a store finds that its sales revenue changes at a rate given by dollars per day, where t is the number of days after an advertising campaign ends and . Find the total sales for the second week after the campaign ends to .
A)$5,733
B)$6,909
C)$4,179
D)$12,117
E)$1,575
dollars per day, where t is the number of days after an advertising campaign ends and . Find the total sales for the second week after the campaign ends to . A)$5,733
B)$6,909
C)$4,179
D)$12,117
E)$1,575
Unlock Deck
Unlock for access to all 185 flashcards in this deck.
Unlock Deck
k this deck
44
Suppose in a small city the response time t (in minutes) of the fire company is given by the probability density function . For a fire chosen at random, find the probability that the response time is 10 minutes or less. Round your answer to three decimal places.
A)0.242
B)0.567
C)0.391
D)0.758
E)0.609
. For a fire chosen at random, find the probability that the response time is 10 minutes or less. Round your answer to three decimal places. A)0.242
B)0.567
C)0.391
D)0.758
E)0.609
Unlock Deck
Unlock for access to all 185 flashcards in this deck.
Unlock Deck
k this deck
45
Find the average value of the given function over the given interval.
A)
B)
C)
D)
E)
A)
B)
C)
D)
E)
Unlock Deck
Unlock for access to all 185 flashcards in this deck.
Unlock Deck
k this deck
46
Find the average value of the function over
A)48
B)96
C)44
D)12
E)-36
over A)48
B)96
C)44
D)12
E)-36
Unlock Deck
Unlock for access to all 185 flashcards in this deck.
Unlock Deck
k this deck
47
Find the area of the shaded region.
A)
B)
C)
D)
E)
A)
B)
C)
D)
E)
Unlock Deck
Unlock for access to all 185 flashcards in this deck.
Unlock Deck
k this deck
48
Equations are given whose graphs enclose a region. Find the area of the region.
A)
B)
C)
D)
E)
A)
B)
C)
D)
E)
Unlock Deck
Unlock for access to all 185 flashcards in this deck.
Unlock Deck
k this deck
49
Suppose the rate of production of a new line of products is given by where x is the number of items produced and t is the number of weeks the products have been in production. How many units were produced in the first 6 weeks? Round your answer to the nearest unit produced.
A)1,300 units
B)2,300 units
C)2,600 units
D)1,000 units
E)2,000 units
where x is the number of items produced and t is the number of weeks the products have been in production. How many units were produced in the first 6 weeks? Round your answer to the nearest unit produced. A)1,300 units
B)2,300 units
C)2,600 units
D)1,000 units
E)2,000 units
Unlock Deck
Unlock for access to all 185 flashcards in this deck.
Unlock Deck
k this deck
50
Suppose that a vending machine service company models its income by assuming that money flows continuously into the machines, with the annual rate of flow given by in thousands of dollars per year. Find the total income from the machines predicted by the model over the first 5 years. Round your answer to the nearest thousand dollars.
A)$29,743,000
B)$592,000
C)$743,000
D)$897,000
E)$29,592,000
in thousands of dollars per year. Find the total income from the machines predicted by the model over the first 5 years. Round your answer to the nearest thousand dollars. A)$29,743,000
B)$592,000
C)$743,000
D)$897,000
E)$29,592,000
Unlock Deck
Unlock for access to all 185 flashcards in this deck.
Unlock Deck
k this deck
51
Find the area of the shaded region.
A)
B)
C)
D)
E)
A)
B)
C)
D)
E)
Unlock Deck
Unlock for access to all 185 flashcards in this deck.
Unlock Deck
k this deck
52
Market revenue for Hammer Inc. (in millions of dollars per year) can be modeled by , where represents 1990. Evaluate . Round your answer to the nearest cent.
A)$1,358.51
B)$15,558.45
C)$93,350.70
D)$10,372.30
E)$51,861.50
, where represents 1990. Evaluate . Round your answer to the nearest cent. A)$1,358.51
B)$15,558.45
C)$93,350.70
D)$10,372.30
E)$51,861.50
Unlock Deck
Unlock for access to all 185 flashcards in this deck.
Unlock Deck
k this deck
53
Find the area of the shaded region for the graph given below.
A)
B)
C)
D)
E)
A)
B)
C)
D)
E)
Unlock Deck
Unlock for access to all 185 flashcards in this deck.
Unlock Deck
k this deck
54
Find the average value of the function
A)
B)
C)
D)
E)
A)
B)
C)
D)
E)
Unlock Deck
Unlock for access to all 185 flashcards in this deck.
Unlock Deck
k this deck
55
The average life for a particular brand of car battery is given by the following probability density function where t is in years. Find the probability that a battery chosen at random lasts between 2 and 7 years. Round your answer to two decimal places.
A)1.72
B)0.43
C)0.54
D)0.34
E)0.65
Find the probability that a battery chosen at random lasts between 2 and 7 years. Round your answer to two decimal places. A)1.72
B)0.43
C)0.54
D)0.34
E)0.65
Unlock Deck
Unlock for access to all 185 flashcards in this deck.
Unlock Deck
k this deck
56
Find the area of the region bounded by
A)
B)
C)
D)
E)
A)
B)
C)
D)
E)
Unlock Deck
Unlock for access to all 185 flashcards in this deck.
Unlock Deck
k this deck
57
Find the area of the shaded region for the graph given below.
A)
B)
C)
D)
E)
A)
B)
C)
D)
E)
Unlock Deck
Unlock for access to all 185 flashcards in this deck.
Unlock Deck
k this deck
58
Find the area of the region enclosed by and .
A)
B)
C)
D)
E)
and . A)
B)
C)
D)
E)
Unlock Deck
Unlock for access to all 185 flashcards in this deck.
Unlock Deck
k this deck
59
Equations are given whose graphs enclose a region. Find the area of the region. ,
A)
B)
C)
D)
E)
, A)
B)
C)
D)
E)
Unlock Deck
Unlock for access to all 185 flashcards in this deck.
Unlock Deck
k this deck
60
Find the area of the shaded region. Round to the nearest hundredth if necessary.
A)
B)2
C)4
D)
E)3
A)
B)2
C)4
D)
E)3
Unlock Deck
Unlock for access to all 185 flashcards in this deck.
Unlock Deck
k this deck
61
For a certain product, the total revenue is given by , and the total cost is given by . Write an integral that gives the average profit for the product over the interval from 4 to 11
A)
B)
C)
D)
E)
, and the total cost is given by . Write an integral that gives the average profit for the product over the interval from 4 to 11 A)
B)
C)
D)
E)
Unlock Deck
Unlock for access to all 185 flashcards in this deck.
Unlock Deck
k this deck
62
Suppose the number of daily sales of a product was found to be given by , x days after the start of an advertising campaign for this product. Find the average daily sales during the first 25 days of the campaign-that is, from to . Round your answer to the nearest dollar.
A)$133
B)$130
C)$127
D)$265
E)$255
, x days after the start of an advertising campaign for this product. Find the average daily sales during the first 25 days of the campaign-that is, from to . Round your answer to the nearest dollar. A)$133
B)$130
C)$127
D)$265
E)$255
Unlock Deck
Unlock for access to all 185 flashcards in this deck.
Unlock Deck
k this deck
63
The Lorenz curve for the income distribution in a certain country in 2005 is given by . Find the Gini coefficient of income for 2005 for this country. Round your answer to four decimal places.
A)0.3576
B)0.4648
C)0.5614
D)0.2103
E)0.2668
. Find the Gini coefficient of income for 2005 for this country. Round your answer to four decimal places. A)0.3576
B)0.4648
C)0.5614
D)0.2103
E)0.2668
Unlock Deck
Unlock for access to all 185 flashcards in this deck.
Unlock Deck
k this deck
64
The demand function for a certain product is given by , where p is the price and q is the number of units demanded. Find the average price as demand ranges from 24 to 92 units. Round your answer to the nearest penny.
A)$576.51
B)$290.51
C)$1,238.44
D)$427.05
E)$982.21
, where p is the price and q is the number of units demanded. Find the average price as demand ranges from 24 to 92 units. Round your answer to the nearest penny. A)$576.51
B)$290.51
C)$1,238.44
D)$427.05
E)$982.21
Unlock Deck
Unlock for access to all 185 flashcards in this deck.
Unlock Deck
k this deck
65
A 58-year-old couple are considering opening a business of their own. They will either purchase an established Gift and Card Shoppe or open a new Video Rental Palace. The Gift Shoppe has a continuous income stream with an annual rate of flow at time t given by (dollars per year) and the Video Palace has a continuous income stream with a projected annual rate of flow at time t given by (dollars per year). The initial investment is the same for both businesses, and money is worth 10% compounded continuously. Find the present value of the Video Palace over the next 8 years (until the couple reach age 66). Round your answer to the nearest dollar.
A)$222,961
B)$220,268
C)$202,618
D)$237,342
E)$181,863
(dollars per year) and the Video Palace has a continuous income stream with a projected annual rate of flow at time t given by (dollars per year). The initial investment is the same for both businesses, and money is worth 10% compounded continuously. Find the present value of the Video Palace over the next 8 years (until the couple reach age 66). Round your answer to the nearest dollar. A)$222,961
B)$220,268
C)$202,618
D)$237,342
E)$181,863
Unlock Deck
Unlock for access to all 185 flashcards in this deck.
Unlock Deck
k this deck
66
A small brewery considers the output of its bottling machine as a continuous income stream with an annual rate of flow at time t given by in thousands of dollars per year. Find the income from this stream for the next 30 years. Round your answer to the nearest dollar.
A)$712,660
B)$716,213
C)$703,158
D)$722,162
E)$708,733
in thousands of dollars per year. Find the income from this stream for the next 30 years. Round your answer to the nearest dollar. A)$712,660
B)$716,213
C)$703,158
D)$722,162
E)$708,733
Unlock Deck
Unlock for access to all 185 flashcards in this deck.
Unlock Deck
k this deck
67
A 58-year-old couple are considering opening a business of their own. They will either purchase an established Gift and Card Shoppe or open a new Video Rental Palace. The Gift Shoppe has a continuous income stream with an annual rate of flow at time t given by (dollars per year) and the Video Palace has a continuous income stream with a projected annual rate of flow at time t given by (dollars per year). The initial investment is the same for both businesses, and money is worth 10% compounded continuously. Determine which is the better buy by finding the present value of each business over the next 7 years (until the couple reach age 65).
A)the Video Palace
B)the Gift Shoppe
(dollars per year) and the Video Palace has a continuous income stream with a projected annual rate of flow at time t given by (dollars per year). The initial investment is the same for both businesses, and money is worth 10% compounded continuously. Determine which is the better buy by finding the present value of each business over the next 7 years (until the couple reach age 65). A)the Video Palace
B)the Gift Shoppe
Unlock Deck
Unlock for access to all 185 flashcards in this deck.
Unlock Deck
k this deck
68
The cost of producing x units of a certain item is Find the average value of the cost function C(x) over the interval from 0 to 1,000. Round answer to nearest penny.
A)$933,866.67
B)$2,801,600.00
C)$549,333.33
D)$3,735,466.67
E)$2,147,893.33
Find the average value of the cost function C(x) over the interval from 0 to 1,000. Round answer to nearest penny. A)$933,866.67
B)$2,801,600.00
C)$549,333.33
D)$3,735,466.67
E)$2,147,893.33
Unlock Deck
Unlock for access to all 185 flashcards in this deck.
Unlock Deck
k this deck
69
Suppose that the Carter Car Service franchise finds that the income generated by its stores can be modeled by assuming that the income is a continuous stream with a monthly rate of flow at time t given by (dollars per month). Find the total income from a Carter Car Service store for years 3 through 5 of operation and round to the nearest penny.
A)$973,587.71
B)$2,307,500.23
C)$1,059,312.41
D)$1,684,306.74
E)$1,186,131.50
(dollars per month). Find the total income from a Carter Car Service store for years 3 through 5 of operation and round to the nearest penny. A)$973,587.71
B)$2,307,500.23
C)$1,059,312.41
D)$1,684,306.74
E)$1,186,131.50
Unlock Deck
Unlock for access to all 185 flashcards in this deck.
Unlock Deck
k this deck
70
The Carter Car Service franchise has a continuous income stream with a monthly rate of flow modeled by (dollars per month). Find the average flow of income over years 2 to 7. Round your answer to the nearest cent.
A)$37,861.91
B)$32,623.16
C)$89,736.51
D)$51,870.82
E)$36,528.74
(dollars per month). Find the average flow of income over years 2 to 7. Round your answer to the nearest cent. A)$37,861.91
B)$32,623.16
C)$89,736.51
D)$51,870.82
E)$36,528.74
Unlock Deck
Unlock for access to all 185 flashcards in this deck.
Unlock Deck
k this deck
71
Assume that the tax burden per capita (in dollars) for selected years from 1950 to 2002 can be modeled by where represents 1950. If the model remains valid, find the predicted average federal tax burden per capita from 2000 to 2010. Round your answer to the nearest dollar.
A)$8,982 federal tax per capita
B)$9,881 average federal tax per capita
C)$19,117 average federal tax per capita
D)$21,241 average federal tax per capita
E)$10,978 average federal tax per capita
where represents 1950. If the model remains valid, find the predicted average federal tax burden per capita from 2000 to 2010. Round your answer to the nearest dollar. A)$8,982 federal tax per capita
B)$9,881 average federal tax per capita
C)$19,117 average federal tax per capita
D)$21,241 average federal tax per capita
E)$10,978 average federal tax per capita
Unlock Deck
Unlock for access to all 185 flashcards in this deck.
Unlock Deck
k this deck
72
Suppose that a printing firm considers the production of its presses as a continuous income stream. If the annual rate of flow at time t is given by in thousands of dollars per year, and if money is worth 7% compounded continuously, find the present value and future value of the presses over the next 10 years. Round your answer to the nearest dollar.
A)Present Value: $212,562; Future Value: $428,047
B)Present Value: $181,071; Future Value: $364,632
C)Present Value: $119,242; Future Value: $240,124
D)Present Value: $193,878; Future Value: $390,422
E)Present Value: $127,833; Future Value: $257,424
in thousands of dollars per year, and if money is worth 7% compounded continuously, find the present value and future value of the presses over the next 10 years. Round your answer to the nearest dollar. A)Present Value: $212,562; Future Value: $428,047
B)Present Value: $181,071; Future Value: $364,632
C)Present Value: $119,242; Future Value: $240,124
D)Present Value: $193,878; Future Value: $390,422
E)Present Value: $127,833; Future Value: $257,424
Unlock Deck
Unlock for access to all 185 flashcards in this deck.
Unlock Deck
k this deck
73
Suppose that a vending machine company is considering selling some of its machines. Suppose further that the income from these particular machines is a continuous stream with an annual rate of flow at time t given by Find the present value and future value of the machines over the next 3 years if the money is worth 11% compounded continuously. Round answers to the nearest dollar.
A)PV = $1,893 FV = $2,633
B)PV = $1,893 FV = $2,349
C)PV = $1,689 FV = $2,349
D)PV = $1,689 FV = $2,633
E)PV = $2,364 FV = $2,633
Find the present value and future value of the machines over the next 3 years if the money is worth 11% compounded continuously. Round answers to the nearest dollar. A)PV = $1,893 FV = $2,633
B)PV = $1,893 FV = $2,349
C)PV = $1,689 FV = $2,349
D)PV = $1,689 FV = $2,633
E)PV = $2,364 FV = $2,633
Unlock Deck
Unlock for access to all 185 flashcards in this deck.
Unlock Deck
k this deck
74
Suppose the Gini coefficient of income for a certain country is If the Lorenz curve for this country is , find the value of p.
A)12
B)11
C)10
D)13
E)14
If the Lorenz curve for this country is , find the value of p. A)12
B)11
C)10
D)13
E)14
Unlock Deck
Unlock for access to all 185 flashcards in this deck.
Unlock Deck
k this deck
75
The demand function for a product is where p is in millions of dollars and x is the number of thousands of units. If the equilibrium price is $6 million, what is the consumer's surplus? Round your answer to the nearest million dollars.
A)114 million dollars
B)149 million dollars
C)83 million dollars
D)88 million dollars
E)174 million dollars
where p is in millions of dollars and x is the number of thousands of units. If the equilibrium price is $6 million, what is the consumer's surplus? Round your answer to the nearest million dollars. A)114 million dollars
B)149 million dollars
C)83 million dollars
D)88 million dollars
E)174 million dollars
Unlock Deck
Unlock for access to all 185 flashcards in this deck.
Unlock Deck
k this deck
76
A continuous income stream has an annual rate of flow at time t given by (dollars per year). Find the present value of this income stream for the next 9 years, if the money is worth 4% compounded continuously. Round to the nearest dollar.
A)$47,664
B)$107,767
C)$178,262
D)$147,471
E)$81,028
(dollars per year). Find the present value of this income stream for the next 9 years, if the money is worth 4% compounded continuously. Round to the nearest dollar. A)$47,664
B)$107,767
C)$178,262
D)$147,471
E)$81,028
Unlock Deck
Unlock for access to all 185 flashcards in this deck.
Unlock Deck
k this deck
77
A drug manufacturer has developed a time-release capsule with the number of milligrams of the drug in the bloodstream given by where x is in hours and . Find the average number of milligrams of the drug in the bloodstream for the first 3 hours after a capsule is taken. Round your answer to the nearest milligram.
A)350 mg
B)266 mg
C)233 mg
D)175 mg
E)200 mg
where x is in hours and . Find the average number of milligrams of the drug in the bloodstream for the first 3 hours after a capsule is taken. Round your answer to the nearest milligram. A)350 mg
B)266 mg
C)233 mg
D)175 mg
E)200 mg
Unlock Deck
Unlock for access to all 185 flashcards in this deck.
Unlock Deck
k this deck
78
Suppose that the income from a slot machine in a casino flows continuously at a rate of , where t is the time in hours since the casino opened. The total income during the first 8 hours is given by . Find the average income over the first 8 hours.
A)$289.02
B)$313.24
C)$728.90
D)$560.69
E)$953.18
, where t is the time in hours since the casino opened. The total income during the first 8 hours is given by . Find the average income over the first 8 hours. A)$289.02
B)$313.24
C)$728.90
D)$560.69
E)$953.18
Unlock Deck
Unlock for access to all 185 flashcards in this deck.
Unlock Deck
k this deck
79
A franchise models the profit from its store as a continuous income stream with a monthly rate of flow at time t given by (dollars per month). When a new store opens, its manager is judged against the model, with special emphasis on the second half of the first year. Find the total profit for the second 6-month period to . Round your answer to the nearest dollar.
A)$61,831
B)$51,679
C)$40,973
D)$30,821
E)$46,232
(dollars per month). When a new store opens, its manager is judged against the model, with special emphasis on the second half of the first year. Find the total profit for the second 6-month period to . Round your answer to the nearest dollar. A)$61,831
B)$51,679
C)$40,973
D)$30,821
E)$46,232
Unlock Deck
Unlock for access to all 185 flashcards in this deck.
Unlock Deck
k this deck
80
In an effort to make the distribution of income more nearly equal, the government of a country passes a tax law that changes the Lorenz curve from for 2004 to for 2005. Find the Gini coefficient of income for both years. Round your answer to six decimal places.
A)2004: 0.317536 2005: 0.155385
B)2004: 0.416149 2005: 0.208966
C)2004: 0.256705 2005: 0.123673
D)2004: 0.215434 2005: 0.102712
E)2004: 0.603604 2005: 0.318947
for 2004 to for 2005. Find the Gini coefficient of income for both years. Round your answer to six decimal places. A)2004: 0.317536 2005: 0.155385
B)2004: 0.416149 2005: 0.208966
C)2004: 0.256705 2005: 0.123673
D)2004: 0.215434 2005: 0.102712
E)2004: 0.603604 2005: 0.318947
Unlock Deck
Unlock for access to all 185 flashcards in this deck.
Unlock Deck
k this deck
Unlock Deck
Unlock for access to all 185 flashcards in this deck.


