Deck 9: Random Variables and Statistics
Full screen (f)
Question
Question
Question
Question
Question
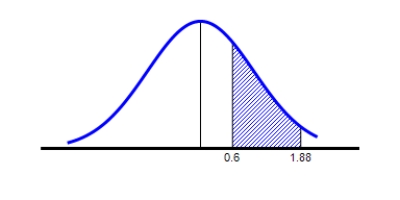
Find the value of the probability of the standard normal variable Z corresponding to the shaded area under the standard normal curve. 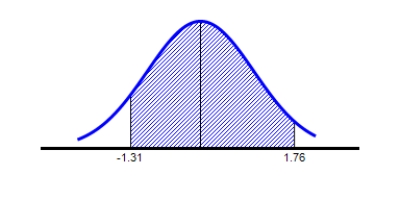
Round your answer to four decimal places.
A)
B)
C)
D)
E)
Round your answer to four decimal places.
A)
B)
C)
D)
E)
Question
Question
Question
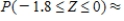
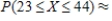
Z is the standard normal distribution. Find the probability 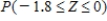 . Please, round the answer to four decimal places.
 __________
. Please, round the answer to four decimal places.
__________ Question
Question
Question
Question
Question
Find the value of the probability of the standard normal variable Z corresponding to the shaded area under the standard normal curve.
Round your answer to four decimal places.
A)
B)
C)
D)
E)
Round your answer to four decimal places.
A)
B)
C)
D)
E)
Question
Question
Question
Question
Question
Question
Question
Question
Question
Question
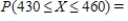
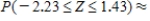
Suppose X is a normal random variable with  and
and  . Find the value, rounding to four decimal places, of
 __________
and . Find the value, rounding to four decimal places, of
__________ Question
Question
Z is the standard normal distribution. Find the probability 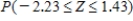 . Please, round your answer to three decimal places.
 __________
. Please, round your answer to three decimal places.
__________ Question
Question
This exercise is based on the following information, gathered from student testing of a statistical software package called MODSTAT. Students were asked to complete certain tasks using the software, without any instructions. The results were as follows. (Assume that the time for each task is normally distributed.) Assuming that the time it takes a student to complete each task is independent of the others, find the probability that a student will take at least 10 minutes to complete each of Tasks 1 and 2. Round your answer to four decimal places. 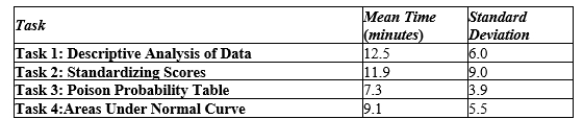
Question
Find the probability that a normal variable takes values more than  standard deviations away from its mean. Please, round the answer to three decimal places.
standard deviations away from its mean. Please, round the answer to three decimal places. Question
Question
This exercise is based on the following information, gathered from student testing of a statistical software package called MODSTAT. Students were asked to complete certain tasks using the software, without any instructions. The results were as follows. (Assume that the time for each task is normally distributed.) It can be shown that if X and Y are independent normal random variables with means  and
and  and standard deviations
  and
and  respectively, then their sum
  is also normally distributed and has mean
  and standard deviation
 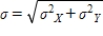 . Assuming that the time it takes a student to complete each task is independent of the others, find the probability that a student will take at least 20 minutes to complete both Tasks 3 and 4. Round your answer to four decimal places. Round Z to two decimal places.
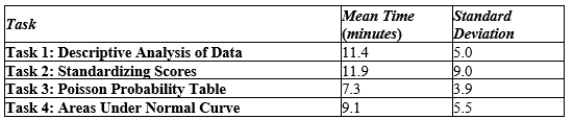
and and standard deviations and respectively, then their sum is also normally distributed and has mean and standard deviation . Assuming that the time it takes a student to complete each task is independent of the others, find the probability that a student will take at least 20 minutes to complete both Tasks 3 and 4. Round your answer to four decimal places. Round Z to two decimal places. Question
Suppose X is a normal random variable with  and
and  . Find the value, rounding to four decimal places, of
 __________
and . Find the value, rounding to four decimal places, of
__________ Question
Question
X has a normal distribution with the given mean and standard deviation. Find the probability. Please, round the answer to three decimal places.
 ,
, 
 __________
, __________ Question
Question
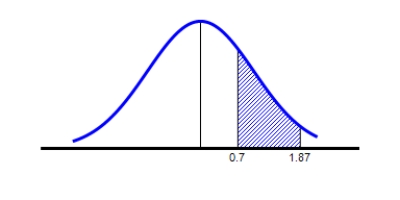
Find the value of the probability of the standard normal variable Z corresponding to the shaded area under the standard normal curve.
? ?
?
Round your answer to four decimal places.
? __________
?
?Round your answer to four decimal places.
? __________
Question
Question
Question
Question
Question
Question
Question
Question
Question
Question
Question
Question
Question
Question
Question
Calculate the standard deviation of X for the probability distribution.
Please round your answer to the nearest whole number, if necessary.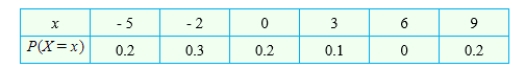
 __________
Please round your answer to the nearest whole number, if necessary.
__________ Question
Question
Question
Question
Calculate the standard deviation of X for the probability distribution. 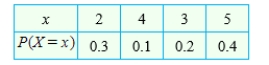
Round your answer to two decimal places.
 __________
Round your answer to two decimal places.
__________ Question
Question
Question
Question
Question
Question
Question
Question
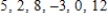
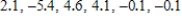
Compute the (sample) standard deviation of the data sample. Round your answer to the nearest whole number, if necessary.

 __________
__________ Question
Compute the (sample) variance and the standard deviation for the data.
Please round your answers to two decimal places, if necessary.
 __________
 __________
Please round your answers to two decimal places, if necessary.
__________
__________ Question
If we model after-tax household income by a normal distribution, then the figures of a 1995 study imply the information in the following table. Assume that the distribution of incomes in each country is bell-shaped and symmetric. If we define a "rich" household as one whose after-tax income is at least 1.3 standard deviations above the mean, find the household income of a rich family in Germany. 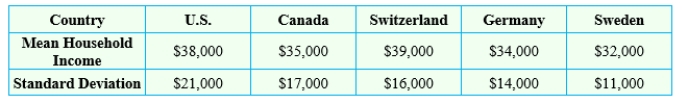
The household income of a rich family in Germany is __________ or __________ (more or less).
The household income of a rich family in Germany is __________ or __________ (more or less).
Question
Calculate the expected value, the variance, and the standard deviation of the given random variable X.
Forty-five darts are thrown at a dartboard. The probability of hitting a bull's-eye is 0.3. Let X be the number of bull's-eyes hit.
Please round your answers to two decimal places, if necessary.
 __________
 __________
 __________
Forty-five darts are thrown at a dartboard. The probability of hitting a bull's-eye is 0.3. Let X be the number of bull's-eyes hit.
Please round your answers to two decimal places, if necessary.
__________
__________
__________ Question
Question
Question
The following is a sample of the percentage increases in the price of a house in eight regions of the U.S.
75, 125, 150, 150, 150, 215, 215, 300
Compute the mean of the given sample. Round answer to the nearest whole number.
 __________
Compute the standard deviation of the given sample. Use the rounded value for the mean in your calculations. Round answer to the nearest whole number.
 __________
Assuming the distribution of percentage housing price increases for all regions is symmetric and bell-shaped, 68 percent of all regions in the U.S. reported housing increases between __________ and __________. Please, use the rounded value for the standard deviation here.
Find the percentage of scores in the sample that fall in this range. Please round your answer to the nearest whole number.
__________%
75, 125, 150, 150, 150, 215, 215, 300
Compute the mean of the given sample. Round answer to the nearest whole number.
__________
Compute the standard deviation of the given sample. Use the rounded value for the mean in your calculations. Round answer to the nearest whole number.
__________
Assuming the distribution of percentage housing price increases for all regions is symmetric and bell-shaped, 68 percent of all regions in the U.S. reported housing increases between __________ and __________. Please, use the rounded value for the standard deviation here.
Find the percentage of scores in the sample that fall in this range. Please round your answer to the nearest whole number.
__________%
Question
Question
Question
Calculate the expected value, the variance, and the standard deviation of the given random variable X. Please round your answers to two decimal places, if necessary.
X is the number of tails that come up when a coin is tossed two times.
 __________
 __________
 __________
X is the number of tails that come up when a coin is tossed two times.
__________
__________
__________ Question
Calculate the standard deviation of X for the probability distribution. Round your answer to two decimal places if necessary. 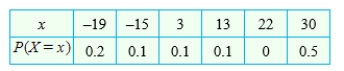
 __________
__________ Question
Your company, Sonic Video, Inc., has conducted research that shows the following probability distribution, where X is the number of video arcades in a randomly chosen city with more than 500,000 inhabitants. 
Compute the mean. Please round your answer to one decimal place. __________
Compute the variance. Use the rounded value for the mean in your calculations. Round your answer to one decimal place. __________
Compute the standard deviation. Use the rounded value for the variance in your calculations. Round your answer to one decimal place. __________
As CEO of Startrooper Video Unlimited, you wish to install a chain of video arcades in Sleepy City, U.S.A. The city council regulations require that the number of arcades be within the range shared by at least 75 percent of all cities. Find this range. Please round your answers to one decimal place.
from __________ to __________
Find the largest number of video arcades you should install so as to comply with this regulation.
The largest number is __________.
Compute the mean. Please round your answer to one decimal place.
__________Compute the variance. Use the rounded value for the mean in your calculations. Round your answer to one decimal place.
__________Compute the standard deviation. Use the rounded value for the variance in your calculations. Round your answer to one decimal place.
__________As CEO of Startrooper Video Unlimited, you wish to install a chain of video arcades in Sleepy City, U.S.A. The city council regulations require that the number of arcades be within the range shared by at least 75 percent of all cities. Find this range. Please round your answers to one decimal place.
from __________ to __________
Find the largest number of video arcades you should install so as to comply with this regulation.
The largest number is __________.
Question
If we model after-tax household income by a normal distribution, then the figures of a 1995 study imply the information in the following table. Assume that the distribution of incomes in each country is bell-shaped and symmetric. Find the percentage of swiss families which earned an after-tax income of $71,000 or more. Round your answer to one decimal place if necessary. 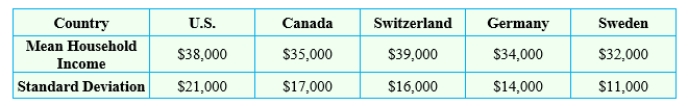
The percentage is __________%.
The percentage is __________%.
Question
Question
Question
Compute the (sample) variance and the standard deviation for the data.
Please round your answers to two decimal places.
 __________
 __________
Please round your answers to two decimal places.
__________
__________ Question
The following is a sample of tow ratings (in pounds) for some popular 2000 model light trucks:
2,000, 2,000, 4,000, 5,000, 6,000, 7,000, 7,000, 7,000, 8,000, 8,000
Compute the mean of the given sample. Round your answer to the nearest whole number.
 __________
Compute the standard deviation of the given sample. Round your answer to the nearest whole number.
 __________
Assuming the distribution of tow ratings for all popular light trucks is symmetric and bell-shaped, 68 percent of all light trucks have tow ratings between __________ and __________. Please, use the rounded value for the standard deviation here.
Find the percentage of scores in the sample that fall in this range.
__________%
2,000, 2,000, 4,000, 5,000, 6,000, 7,000, 7,000, 7,000, 8,000, 8,000
Compute the mean of the given sample. Round your answer to the nearest whole number.
__________
Compute the standard deviation of the given sample. Round your answer to the nearest whole number.
__________
Assuming the distribution of tow ratings for all popular light trucks is symmetric and bell-shaped, 68 percent of all light trucks have tow ratings between __________ and __________. Please, use the rounded value for the standard deviation here.
Find the percentage of scores in the sample that fall in this range.
__________%
Question
Calculate the standard deviation of X for the probability distribution. Round your answer to the whole number. 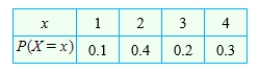
 __________
__________ Question
In 2000, 30 percent of all teenagers in some country had checking accounts. Your bank, TeenChex Inc., is interested in targeting teenagers who do not already have a checking account.
TeenChex selects a random sample of 1,000 teenagers. Find the number of teenagers without checking accounts it can expect.
 __________
Find the standard deviation of this number. Please, round your answer to one decimal place.
 __________
Fill in the missing quantities. Please round answers to the nearest whole number.
There is an approximately 95 percent chance that between __________ and __________ teenagers in the sample will not have checking accounts.
TeenChex selects a random sample of 1,000 teenagers. Find the number of teenagers without checking accounts it can expect.
__________
Find the standard deviation of this number. Please, round your answer to one decimal place.
__________
Fill in the missing quantities. Please round answers to the nearest whole number.
There is an approximately 95 percent chance that between __________ and __________ teenagers in the sample will not have checking accounts.

Unlock Deck
Sign up to unlock the cards in this deck!
Unlock Deck
Unlock Deck
1/178
Play
Full screen (f)
Deck 9: Random Variables and Statistics
1
Suppose X is a normal random variable with and . Find the value of . Please, round the answer to four decimal places.
A)
B)
C)
D)
E)
A)
B)
C)
D)
E)
2
If you roll a die 300 times, what is the probability that you will roll between 50 and 60 fives (Round your answer to two decimal places.) ?
A)0.24
B) 0.47
C) 0.52
D) 0.48
E) 0.76
A)0.24
B) 0.47
C) 0.52
D) 0.48
E) 0.76
0.48
3
This exercise is based on the following information, gathered from student testing of a statistical software package called MODSTAT. Students were asked to complete certain tasks using the software, without any instructions. The results were as follows. (Assume that the time for each task is normally distributed.) Assuming that the time it takes a student to complete each task is independent of the others, find the probability that a student will take at least 10 minutes to complete each of Tasks 1 and 2. Round your answer to four decimal places.
A)0.3425
B) 0.3405
C) 0.6595
D) 0.3415
E) 0.6585
A)0.3425
B) 0.3405
C) 0.6595
D) 0.3415
E) 0.6585
0.3415
4
Suppose X is a normal random variable with and . Find the value of . Please, round the answer to four decimal places.
A)
B)
C)
D)
E)
A)
B)
C)
D)
E)
Unlock Deck
Unlock for access to all 178 flashcards in this deck.
Unlock Deck
k this deck
5
Find the value of the probability of the standard normal variable Z corresponding to the shaded area under the standard normal curve.
Round your answer to four decimal places.
A)
B)
C)
D)
E)
Round your answer to four decimal places.
A)
B)
C)
D)
E)
Unlock Deck
Unlock for access to all 178 flashcards in this deck.
Unlock Deck
k this deck
6
If we model after-tax household income with a normal distribution, then the figures of a 1995 study imply the information in the following table. Assume that the distribution of incomes in each country is normal, and round all percentages to the nearest whole number. What percentage of Swedish households are either very wealthy (income at least $100,000) or very poor (income at most $12,000) Express your answer to the nearest 1%.
A)51%
B) 3%
C) 7%
D) 6%
E) 97%
A)51%
B) 3%
C) 7%
D) 6%
E) 97%
Unlock Deck
Unlock for access to all 178 flashcards in this deck.
Unlock Deck
k this deck
7
If we model after-tax household income with a normal distribution, then the figures of a 1995 study imply the information in the following table. Assume that the distribution of incomes in each country is normal, and round all percentages to the nearest whole number. What percentage of Sweden households had an income of $50,000 or more
A)22%
B) 95%
C) 4%
D) 89%
E) 5%
A)22%
B) 95%
C) 4%
D) 89%
E) 5%
Unlock Deck
Unlock for access to all 178 flashcards in this deck.
Unlock Deck
k this deck
8
Z is the standard normal distribution. Find the probability . Please, round the answer to four decimal places.
__________
. Please, round the answer to four decimal places.
__________ Unlock Deck
Unlock for access to all 178 flashcards in this deck.
Unlock Deck
k this deck
9
Z is the standard normal distribution. Find the probability . Please, round the answer to four decimal places.
A)
B)
C)
D)
E)
A)
B)
C)
D)
E)
Unlock Deck
Unlock for access to all 178 flashcards in this deck.
Unlock Deck
k this deck
10
IQ scores (as measured by the Stanford-Binet intelligence test) are normally distributed with a mean of 100 and a standard deviation of 16. Find the approximate number of people in the U.S. (assuming a total population of 280,000,000) with an IQ higher than 120.
Round your answer to the nearest 100,000.
A)30,600,000 people
B) 265,200,000 people
C) 29,600,000 people
D) 250,400,000 people
E) 132,600,000 people
Round your answer to the nearest 100,000.
A)30,600,000 people
B) 265,200,000 people
C) 29,600,000 people
D) 250,400,000 people
E) 132,600,000 people
Unlock Deck
Unlock for access to all 178 flashcards in this deck.
Unlock Deck
k this deck
11
The mean batting average in major league baseball is about 0.250. Supposing that batting averages are normally distributed, that the standard deviation in the averages is 0.05, and that there are 245 batters, what is the expected number of batters with an average of at least 0.400 Round your answer to two decimal places.
A)0.25 batters
B) 0.75 batters
C) 0.37 batters
D) 0.32 batters
E) 0.2 batters
A)0.25 batters
B) 0.75 batters
C) 0.37 batters
D) 0.32 batters
E) 0.2 batters
Unlock Deck
Unlock for access to all 178 flashcards in this deck.
Unlock Deck
k this deck
12
Find the probability that a normal variable takes values more than standard deviations away from its mean. Please, round the answer to four decimal places.
A)0.9867
B) 0.8026
C) 0.8016
D) 0.4013
E) 0.8036
A)0.9867
B) 0.8026
C) 0.8016
D) 0.4013
E) 0.8036
Unlock Deck
Unlock for access to all 178 flashcards in this deck.
Unlock Deck
k this deck
13
Find the value of the probability of the standard normal variable Z corresponding to the shaded area under the standard normal curve.
Round your answer to four decimal places.
A)
B)
C)
D)
E)
Round your answer to four decimal places.
A)
B)
C)
D)
E)
Unlock Deck
Unlock for access to all 178 flashcards in this deck.
Unlock Deck
k this deck
14
Your company issues flight insurance. You charge $2 and in the event of a plane crash, you will pay out $1 million to the victim or his or her family. In 1989, the probability of a plane crashing on a single trip was 0.00000165. If ten people per flight buy insurance from you, what was your approximate probability of losing money over the course of 100 million flights in 1989 Round your answer to four decimal places. [Hint: First determine how many crashes there must be for you to lose money.] ?
A)0.9971
B) 0.0039
C) 0.136
D) 0.0029
E) 0.0019
A)0.9971
B) 0.0039
C) 0.136
D) 0.0029
E) 0.0019
Unlock Deck
Unlock for access to all 178 flashcards in this deck.
Unlock Deck
k this deck
15
Suppose X is a normal random variable with and . Find the value of . Please, round the answer to four decimal places.
A)
B)
C)
D)
E)
A)
B)
C)
D)
E)
Unlock Deck
Unlock for access to all 178 flashcards in this deck.
Unlock Deck
k this deck
16
The probability of a plane crashing on a single trip in 1989 was 0.00000165. Find the approximate probability that in 50,000,000 flights there will be fewer than 90 crashes. Round your answer to four decimal places. Round Z to two decimal places.
A)0.5332
B) 0.7804
C) 0.7784
D) 0.5342
E) 0.7794
A)0.5332
B) 0.7804
C) 0.7784
D) 0.5342
E) 0.7794
Unlock Deck
Unlock for access to all 178 flashcards in this deck.
Unlock Deck
k this deck
17
The new computer your business bought lists a mean time between failures of 1 year, with a standard deviation of 3 months. Eight months after a repair, it breaks down again. Is this surprising (Assume that the times between failures are normally distributed.)
A)This is not unusual.
B) This is unusual.
A)This is not unusual.
B) This is unusual.
Unlock Deck
Unlock for access to all 178 flashcards in this deck.
Unlock Deck
k this deck
18
LSAT test scores are normally distributed with a mean of 500 and a standard deviation of 100. Find the probability that a randomly chosen test taker will score between 300 and 600. Round your answer to four decimal places.
A)0.5907
B) 0.8185
C) 0.2954
D) 0.1815
E) 0.8175
A)0.5907
B) 0.8185
C) 0.2954
D) 0.1815
E) 0.8175
Unlock Deck
Unlock for access to all 178 flashcards in this deck.
Unlock Deck
k this deck
19
IQ scores as measured by both the Stanford-Binet intelligence test and the Wechsler intelligence test have a mean of 100. The standard deviation for the Stanford-Binet test is 16, while that for the Wechsler test is 14. For which test do a smaller percentage of test-takers score less than 80 ?
A)Wechsler
B) Stanford-Binet
C) Percentages are equal
A)Wechsler
B) Stanford-Binet
C) Percentages are equal
Unlock Deck
Unlock for access to all 178 flashcards in this deck.
Unlock Deck
k this deck
20
This exercise is based on the following information, gathered from student testing of a statistical software package called MODSTAT. Students were asked to complete certain tasks using the software, without any instructions. The results were as follows. (Assume that the time for each task is normally distributed.) It can be shown that if X and Y are independent normal random variables with means and and standard deviations and respectively, then their sum is also normally distributed and has mean and standard deviation . Assuming that the time it takes a student to complete each task is independent of the others, find the probability that a student will take at least 20 minutes to complete both Tasks 3 and 4. Round your answer to four decimal places.
A)0.3382
B) 0.6638
C) 0.6764
D) 0.3372
E) 0.6628
A)0.3382
B) 0.6638
C) 0.6764
D) 0.3372
E) 0.6628
Unlock Deck
Unlock for access to all 178 flashcards in this deck.
Unlock Deck
k this deck
21
Your company issues flight insurance. You charge $2 and in the event of a plane crash, you will pay out $1 million to the victim or his or her family. In 1989, the probability of a plane crashing on a single trip was 0.00000165. If ten people per flight buy insurance from you, what was your approximate probability of losing money over the course of 110 million flights in 1989 Round your answer to four decimal places. [Hint: First determine how many crashes there must be for you to lose money.]
Unlock Deck
Unlock for access to all 178 flashcards in this deck.
Unlock Deck
k this deck
22
The mean batting average in major league baseball is about 0.250. Supposing that batting averages are normally distributed, that the standard deviation in the averages is 0.05, and that there are 250 batters, what is the expected number of batters with an average of at least 0.400 Round your answer to two decimal places.
?
The answer is __________ batters.
?
The answer is __________ batters.
Unlock Deck
Unlock for access to all 178 flashcards in this deck.
Unlock Deck
k this deck
23
Suppose X is a normal random variable with and . Find the value, rounding to four decimal places, of
__________
and . Find the value, rounding to four decimal places, of
__________ Unlock Deck
Unlock for access to all 178 flashcards in this deck.
Unlock Deck
k this deck
24
The probability of a plane crashing on a single trip in 1989 was 0.00000165. Find the approximate probability that in 50,000,000 flights there will be fewer than 80 crashes. Round your answer to four decimal places. Round Z to two decimal places.
Unlock Deck
Unlock for access to all 178 flashcards in this deck.
Unlock Deck
k this deck
25
Z is the standard normal distribution. Find the probability . Please, round your answer to three decimal places.
__________
. Please, round your answer to three decimal places.
__________ Unlock Deck
Unlock for access to all 178 flashcards in this deck.
Unlock Deck
k this deck
26
Compute the standard deviation of the data sample.
Round your answer to two decimal places if necessary.
A)6.73
B) 41.92
C) 22.9
D) 4.79
E) 6.02
Round your answer to two decimal places if necessary.
A)6.73
B) 41.92
C) 22.9
D) 4.79
E) 6.02
Unlock Deck
Unlock for access to all 178 flashcards in this deck.
Unlock Deck
k this deck
27
This exercise is based on the following information, gathered from student testing of a statistical software package called MODSTAT. Students were asked to complete certain tasks using the software, without any instructions. The results were as follows. (Assume that the time for each task is normally distributed.) Assuming that the time it takes a student to complete each task is independent of the others, find the probability that a student will take at least 10 minutes to complete each of Tasks 1 and 2. Round your answer to four decimal places.
Unlock Deck
Unlock for access to all 178 flashcards in this deck.
Unlock Deck
k this deck
28
Find the probability that a normal variable takes values more than standard deviations away from its mean. Please, round the answer to three decimal places.
standard deviations away from its mean. Please, round the answer to three decimal places. Unlock Deck
Unlock for access to all 178 flashcards in this deck.
Unlock Deck
k this deck
29
LSAT test scores are normally distributed with a mean of 500 and a standard deviation of 100. Find the probability that a randomly chosen test taker will score 340 or lower. Round your answer to four decimal places.
Unlock Deck
Unlock for access to all 178 flashcards in this deck.
Unlock Deck
k this deck
30
This exercise is based on the following information, gathered from student testing of a statistical software package called MODSTAT. Students were asked to complete certain tasks using the software, without any instructions. The results were as follows. (Assume that the time for each task is normally distributed.) It can be shown that if X and Y are independent normal random variables with means and and standard deviations and respectively, then their sum is also normally distributed and has mean and standard deviation . Assuming that the time it takes a student to complete each task is independent of the others, find the probability that a student will take at least 20 minutes to complete both Tasks 3 and 4. Round your answer to four decimal places. Round Z to two decimal places.
and and standard deviations and respectively, then their sum is also normally distributed and has mean and standard deviation . Assuming that the time it takes a student to complete each task is independent of the others, find the probability that a student will take at least 20 minutes to complete both Tasks 3 and 4. Round your answer to four decimal places. Round Z to two decimal places. Unlock Deck
Unlock for access to all 178 flashcards in this deck.
Unlock Deck
k this deck
31
Suppose X is a normal random variable with and . Find the value, rounding to four decimal places, of
__________
and . Find the value, rounding to four decimal places, of
__________ Unlock Deck
Unlock for access to all 178 flashcards in this deck.
Unlock Deck
k this deck
32
IQ scores (as measured by the Stanford-Binet intelligence test) are normally distributed with a mean of 100 and a standard deviation of 16. Find the approximate number of people in the U.S. (assuming a total population of 280,000,000) with an IQ higher than 120.
Round your answer to the nearest 100,000.
__________ people
Round your answer to the nearest 100,000.
__________ people
Unlock Deck
Unlock for access to all 178 flashcards in this deck.
Unlock Deck
k this deck
33
X has a normal distribution with the given mean and standard deviation. Find the probability. Please, round the answer to three decimal places.
, __________
, __________ Unlock Deck
Unlock for access to all 178 flashcards in this deck.
Unlock Deck
k this deck
34
The population standard deviation is greater than the sample standard deviation.
Unlock Deck
Unlock for access to all 178 flashcards in this deck.
Unlock Deck
k this deck
35
Find the value of the probability of the standard normal variable Z corresponding to the shaded area under the standard normal curve.
? ?
Round your answer to four decimal places.
? __________
?
?Round your answer to four decimal places.
? __________
Unlock Deck
Unlock for access to all 178 flashcards in this deck.
Unlock Deck
k this deck
36
If we model after-tax household income with a normal distribution, then the figures of a 1995 study imply the information in the following table. Assume that the distribution of incomes in each country is normal, and round all percentages to the nearest whole number. What percentage of U.S. households had an income of $50,000 or more Express your answer to the nearest 1%.
__________% of households
__________% of households
Unlock Deck
Unlock for access to all 178 flashcards in this deck.
Unlock Deck
k this deck
37
The new computer your business bought lists a mean time between failures of 1 year, with a standard deviation of 3 months. Eight months after a repair, it breaks down again. Is this surprising (Assume that the times between failures are normally distributed.)
Unlock Deck
Unlock for access to all 178 flashcards in this deck.
Unlock Deck
k this deck
38
If you roll a die 300 times, what is the probability that you will roll between 50 and 80 sixs Please, round your answer to three decimal places.
Unlock Deck
Unlock for access to all 178 flashcards in this deck.
Unlock Deck
k this deck
39
If we model after-tax household income with a normal distribution, then the figures of a 1995 study imply the information in the following table. Assume that the distribution of incomes in each country is normal, and round all percentages to the nearest whole number. What percentage of German households are either very wealthy (income at least $100,000) or very poor (income at most $12,000) Express your answer to the nearest 1%.
__________% of households
__________% of households
Unlock Deck
Unlock for access to all 178 flashcards in this deck.
Unlock Deck
k this deck
40
LSAT test scores are normally distributed with a mean of 500 and a standard deviation of 100. Find the probability that a randomly chosen test taker will score between 350 and 550. Round your answer to four decimal places.
Unlock Deck
Unlock for access to all 178 flashcards in this deck.
Unlock Deck
k this deck
41
In your bid to be elected class representative, you have your election committee survey five randomly chosen students in your class and ask them to rank you on a scale of 0 - 10. Your rankings are 5, 9, 7, 2, 3.
Calculate the sample standard deviation, rounded to two decimal places.
A)
B)
C)
D)
E)
Calculate the sample standard deviation, rounded to two decimal places.
A)
B)
C)
D)
E)
Unlock Deck
Unlock for access to all 178 flashcards in this deck.
Unlock Deck
k this deck
42
The following list shows the percentage of aging population (residents of age 65 and older) in each of the 50 states in 1990 and 2000.
2000
1990
What was the actual percentage of states whose aging population in 1990 was within two standard deviations of the mean Round your answer to one decimal place if necessary.
A)96%
B) 95%
C) 97%
D) 75%
E) 86%
2000
1990
What was the actual percentage of states whose aging population in 1990 was within two standard deviations of the mean Round your answer to one decimal place if necessary.
A)96%
B) 95%
C) 97%
D) 75%
E) 86%
Unlock Deck
Unlock for access to all 178 flashcards in this deck.
Unlock Deck
k this deck
43
Calculate the standard deviation of X for the probability distribution. Round your answer to two decimal places if necessary.
A)1.05
B) 1
C) 1.02
D) 2.5
E) 5
A)1.05
B) 1
C) 1.02
D) 2.5
E) 5
Unlock Deck
Unlock for access to all 178 flashcards in this deck.
Unlock Deck
k this deck
44
Which is smaller: the sample standard deviation or the population standard deviation ?
A)the population standard deviation
B) the sample standard deviation
A)the population standard deviation
B) the sample standard deviation
Unlock Deck
Unlock for access to all 178 flashcards in this deck.
Unlock Deck
k this deck
45
Your company, Sonic Video, Inc., has conducted research that shows the following probability distribution, where X is the number of video arcades in a randomly chosen city with more than 500,000 inhabitants. As CEO of Startrooper Video Unlimited, you wish to install a chain of video arcades in Sleepy City, U.S.A. The city council regulations require that the number of arcades be within the range shared by at least 75 percent of all cities. Find the largest number of video arcades you should install so as to comply with this regulation.
A)6
B) 4
C) 5
D) 7
E) 3
A)6
B) 4
C) 5
D) 7
E) 3
Unlock Deck
Unlock for access to all 178 flashcards in this deck.
Unlock Deck
k this deck
46
Compute the (sample) standard deviation for the data. Please round your answer to two decimal places.
A)
B)
C)
D)
E)
A)
B)
C)
D)
E)
Unlock Deck
Unlock for access to all 178 flashcards in this deck.
Unlock Deck
k this deck
47
Calculate the standard deviation of X for the probability distribution. Please round your answer to two decimal places, if necessary.
A)
B)
C)
D)
E)
A)
B)
C)
D)
E)
Unlock Deck
Unlock for access to all 178 flashcards in this deck.
Unlock Deck
k this deck
48
Calculate the standard deviation of X for the probability distribution. Round your answer to two decimal places if necessary.
A)1.25
B) 3
C) 1.4
D) 6
E) 1.18
A)1.25
B) 3
C) 1.4
D) 6
E) 1.18
Unlock Deck
Unlock for access to all 178 flashcards in this deck.
Unlock Deck
k this deck
49
In some year, 21 percent of all teenagers in the U.S. had checking accounts. Your bank, TeenChex Inc., is interested in targeting teenagers who do not already have a checking account.
TeenChex selects a random sample of 1,000 teenagers. Find the interval in which the chance that teenagers in the sample will not have checking accounts is approximately 95 percent. Please round your answer to the nearest whole number.
A)764 - 790
B) 790 - 816
C) 777 - 803
D) 764 - 816
E) 790 - 803
TeenChex selects a random sample of 1,000 teenagers. Find the interval in which the chance that teenagers in the sample will not have checking accounts is approximately 95 percent. Please round your answer to the nearest whole number.
A)764 - 790
B) 790 - 816
C) 777 - 803
D) 764 - 816
E) 790 - 803
Unlock Deck
Unlock for access to all 178 flashcards in this deck.
Unlock Deck
k this deck
50
Calculate the standard deviation of X for the probability distribution.
Please round your answer to the nearest whole number, if necessary. __________
Please round your answer to the nearest whole number, if necessary.
__________ Unlock Deck
Unlock for access to all 178 flashcards in this deck.
Unlock Deck
k this deck
51
Following is a sample of tow ratings (in pounds) for some popular 2000 model light trucks:
3,000, 3,000, 4,000, 5,000, 6,000, 7,000, 7,000, 7,000, 9,000, 9,000
Compute the standard deviation of the given sample. Round your answer to the nearest whole number.
A)
B)
C)
D)
E)
3,000, 3,000, 4,000, 5,000, 6,000, 7,000, 7,000, 7,000, 9,000, 9,000
Compute the standard deviation of the given sample. Round your answer to the nearest whole number.
A)
B)
C)
D)
E)
Unlock Deck
Unlock for access to all 178 flashcards in this deck.
Unlock Deck
k this deck
52
The following is a sample of the percentage increases in the price of a house in eight regions of the U.S.
75, 125, 160, 160, 160, 225, 225, 300
Compute the standard deviation of the given sample. Please, use the value for mean, rounded to the nearest whole number in your calculations. Round answer to the nearest whole number.
A)
B)
C)
D)
E)
75, 125, 160, 160, 160, 225, 225, 300
Compute the standard deviation of the given sample. Please, use the value for mean, rounded to the nearest whole number in your calculations. Round answer to the nearest whole number.
A)
B)
C)
D)
E)
Unlock Deck
Unlock for access to all 178 flashcards in this deck.
Unlock Deck
k this deck
53
The following table shows the approximate number of males of Hispanic origin employed in the U.S. in 2005, broken down by age group. In what age interval does the empirical rule predict that 68 percent of all male Hispanic workers will fall Please round answers to the nearest year.
A)31 - 42
B) 19 - 31
C) 19 - 42
D) 12 - 31
E) 12 - 42
A)31 - 42
B) 19 - 31
C) 19 - 42
D) 12 - 31
E) 12 - 42
Unlock Deck
Unlock for access to all 178 flashcards in this deck.
Unlock Deck
k this deck
54
Calculate the standard deviation of X for the probability distribution.
Round your answer to two decimal places.
__________
Round your answer to two decimal places.
__________ Unlock Deck
Unlock for access to all 178 flashcards in this deck.
Unlock Deck
k this deck
55
Compute the (sample) standard deviation for the data. Please round your answer to two decimal places.
A)
B)
C)
D)
E)
A)
B)
C)
D)
E)
Unlock Deck
Unlock for access to all 178 flashcards in this deck.
Unlock Deck
k this deck
56
Calculate the standard deviation of the given random variable X. Please, round your answer to two decimal places, if necessary.
X is the number of heads that come up when a coin is tossed three times.
A)
B)
C)
D)
E)
X is the number of heads that come up when a coin is tossed three times.
A)
B)
C)
D)
E)
Unlock Deck
Unlock for access to all 178 flashcards in this deck.
Unlock Deck
k this deck
57
If we model after-tax household income by a normal distribution, then the figures of a 1995 study imply the information in the following table. Assume that the distribution of incomes in each country is bell-shaped and symmetric. If we define a "poor" household as one whose after-tax income is at least 1.3 standard deviations below the mean, find the household income of a poor family in Switzerland.
A)$59,800 or less
B) $59,800 or more
C) $18,200 or less
D) $16,000 or less
E) $18,200 or more
A)$59,800 or less
B) $59,800 or more
C) $18,200 or less
D) $16,000 or less
E) $18,200 or more
Unlock Deck
Unlock for access to all 178 flashcards in this deck.
Unlock Deck
k this deck
58
Calculate the standard deviation of X for the probability distribution. Round your answer to two decimal places if necessary.
A)261.69
B) 162.19
C) 1,757.64
D) 11.9
E) 16.18
A)261.69
B) 162.19
C) 1,757.64
D) 11.9
E) 16.18
Unlock Deck
Unlock for access to all 178 flashcards in this deck.
Unlock Deck
k this deck
59
Calculate the standard deviation of the given random variable X. Please round your answer to two decimal places.
Forty-five darts are thrown at a dartboard. The probability of hitting a bull's-eye is 0.4. Let X be the number of bull's-eyes hit.
A)
B)
C)
D)
E)
Forty-five darts are thrown at a dartboard. The probability of hitting a bull's-eye is 0.4. Let X be the number of bull's-eyes hit.
A)
B)
C)
D)
E)
Unlock Deck
Unlock for access to all 178 flashcards in this deck.
Unlock Deck
k this deck
60
If we model after-tax household income by a normal distribution, then the figures of a 1995 study imply the information in the following table. Assume that the distribution of incomes in each country is bell-shaped and symmetric. Find the percent of canadian families which earned an after-tax income of $69,000 or more.
A)5%
B) 95%
C) 47.5%
D) 2.5%
E) 99.7%
A)5%
B) 95%
C) 47.5%
D) 2.5%
E) 99.7%
Unlock Deck
Unlock for access to all 178 flashcards in this deck.
Unlock Deck
k this deck
61
Find the expected value of a random variable X having the following probability distribution: Round your answer to tenth if necessary.
A)
B)
C)
D)
E)
A)
B)
C)
D)
E)
Unlock Deck
Unlock for access to all 178 flashcards in this deck.
Unlock Deck
k this deck
62
Compute the (sample) standard deviation of the data sample. Round your answer to the nearest whole number, if necessary.
__________
__________ Unlock Deck
Unlock for access to all 178 flashcards in this deck.
Unlock Deck
k this deck
63
Compute the (sample) variance and the standard deviation for the data.
Please round your answers to two decimal places, if necessary.
__________
__________
Please round your answers to two decimal places, if necessary.
__________
__________ Unlock Deck
Unlock for access to all 178 flashcards in this deck.
Unlock Deck
k this deck
64
If we model after-tax household income by a normal distribution, then the figures of a 1995 study imply the information in the following table. Assume that the distribution of incomes in each country is bell-shaped and symmetric. If we define a "rich" household as one whose after-tax income is at least 1.3 standard deviations above the mean, find the household income of a rich family in Germany.
The household income of a rich family in Germany is __________ or __________ (more or less).
The household income of a rich family in Germany is __________ or __________ (more or less).
Unlock Deck
Unlock for access to all 178 flashcards in this deck.
Unlock Deck
k this deck
65
Calculate the expected value, the variance, and the standard deviation of the given random variable X.
Forty-five darts are thrown at a dartboard. The probability of hitting a bull's-eye is 0.3. Let X be the number of bull's-eyes hit.
Please round your answers to two decimal places, if necessary.
__________
__________
__________
Forty-five darts are thrown at a dartboard. The probability of hitting a bull's-eye is 0.3. Let X be the number of bull's-eyes hit.
Please round your answers to two decimal places, if necessary.
__________
__________
__________ Unlock Deck
Unlock for access to all 178 flashcards in this deck.
Unlock Deck
k this deck
66
Find the expected value of a random variable X having the following probability distribution: Round your answer to tenth if necessary.
A)
B)
C)
D)
E)
A)
B)
C)
D)
E)
Unlock Deck
Unlock for access to all 178 flashcards in this deck.
Unlock Deck
k this deck
67
Calculate the expected value of X for the given probability distribution.
A)
B)
C)
D)
E)
A)
B)
C)
D)
E)
Unlock Deck
Unlock for access to all 178 flashcards in this deck.
Unlock Deck
k this deck
68
The following is a sample of the percentage increases in the price of a house in eight regions of the U.S.
75, 125, 150, 150, 150, 215, 215, 300
Compute the mean of the given sample. Round answer to the nearest whole number.
__________
Compute the standard deviation of the given sample. Use the rounded value for the mean in your calculations. Round answer to the nearest whole number.
__________
Assuming the distribution of percentage housing price increases for all regions is symmetric and bell-shaped, 68 percent of all regions in the U.S. reported housing increases between __________ and __________. Please, use the rounded value for the standard deviation here.
Find the percentage of scores in the sample that fall in this range. Please round your answer to the nearest whole number.
__________%
Unlock Deck
Unlock for access to all 178 flashcards in this deck.
Unlock Deck
k this deck
69
Find the median of 7, 4, 5, 6, 13, 7, 23, and 3.
A)6.5
B) 8.7
C) 13
D) 6
E) 10
A)6.5
B) 8.7
C) 13
D) 6
E) 10
Unlock Deck
Unlock for access to all 178 flashcards in this deck.
Unlock Deck
k this deck
70
The following table shows the approximate number of males of Hispanic origin employed in the U.S., broken down by age group.
Use the rounded midpoints of the given measurement classes to compute the expected value and the standard deviation of the age X of a male Hispanic worker in the U.S. Please round your answers to two decimal places. __________ __________
In what age interval does the empirical rule predict that 68 percent of all male Hispanic workers will fall Please round answers to the nearest year.
from __________ to __________
Unlock Deck
Unlock for access to all 178 flashcards in this deck.
Unlock Deck
k this deck
71
Calculate the expected value, the variance, and the standard deviation of the given random variable X. Please round your answers to two decimal places, if necessary.
X is the number of tails that come up when a coin is tossed two times.
__________
__________
__________
X is the number of tails that come up when a coin is tossed two times.
__________
__________
__________ Unlock Deck
Unlock for access to all 178 flashcards in this deck.
Unlock Deck
k this deck
72
Calculate the standard deviation of X for the probability distribution. Round your answer to two decimal places if necessary. __________
__________ Unlock Deck
Unlock for access to all 178 flashcards in this deck.
Unlock Deck
k this deck
73
Your company, Sonic Video, Inc., has conducted research that shows the following probability distribution, where X is the number of video arcades in a randomly chosen city with more than 500,000 inhabitants.
Compute the mean. Please round your answer to one decimal place. __________
Compute the variance. Use the rounded value for the mean in your calculations. Round your answer to one decimal place. __________
Compute the standard deviation. Use the rounded value for the variance in your calculations. Round your answer to one decimal place. __________
As CEO of Startrooper Video Unlimited, you wish to install a chain of video arcades in Sleepy City, U.S.A. The city council regulations require that the number of arcades be within the range shared by at least 75 percent of all cities. Find this range. Please round your answers to one decimal place.
from __________ to __________
Find the largest number of video arcades you should install so as to comply with this regulation.
The largest number is __________.
Compute the mean. Please round your answer to one decimal place.
__________Compute the variance. Use the rounded value for the mean in your calculations. Round your answer to one decimal place.
__________Compute the standard deviation. Use the rounded value for the variance in your calculations. Round your answer to one decimal place.
__________As CEO of Startrooper Video Unlimited, you wish to install a chain of video arcades in Sleepy City, U.S.A. The city council regulations require that the number of arcades be within the range shared by at least 75 percent of all cities. Find this range. Please round your answers to one decimal place.
from __________ to __________
Find the largest number of video arcades you should install so as to comply with this regulation.
The largest number is __________.
Unlock Deck
Unlock for access to all 178 flashcards in this deck.
Unlock Deck
k this deck
74
If we model after-tax household income by a normal distribution, then the figures of a 1995 study imply the information in the following table. Assume that the distribution of incomes in each country is bell-shaped and symmetric. Find the percentage of swiss families which earned an after-tax income of $71,000 or more. Round your answer to one decimal place if necessary.
The percentage is __________%.
The percentage is __________%.
Unlock Deck
Unlock for access to all 178 flashcards in this deck.
Unlock Deck
k this deck
75
Find the expected value of the following probability distribution.
A)7.3
B) 4
C) 2.5
D) 8.2
E) 10
A)7.3
B) 4
C) 2.5
D) 8.2
E) 10
Unlock Deck
Unlock for access to all 178 flashcards in this deck.
Unlock Deck
k this deck
76
In your bid to be elected class representative, you have your election committee survey five randomly chosen students in your class and ask them to rank you on a scale of 0 - 10. Your rankings are 6, 2, 7, 4, 8.
(a) Find the sample mean, rounded to two decimal places.
__________
(b) Calculate the sample standard deviation, rounded to two decimal places.
__________
(c) Assuming the sample mean and standard deviation are indicative of the class as a whole, in what range does the empirical rule predict that approximately 68% of the class will rank you
Unlock Deck
Unlock for access to all 178 flashcards in this deck.
Unlock Deck
k this deck
77
Compute the (sample) variance and the standard deviation for the data.
Please round your answers to two decimal places.
__________
__________
Please round your answers to two decimal places.
__________
__________ Unlock Deck
Unlock for access to all 178 flashcards in this deck.
Unlock Deck
k this deck
78
The following is a sample of tow ratings (in pounds) for some popular 2000 model light trucks:
2,000, 2,000, 4,000, 5,000, 6,000, 7,000, 7,000, 7,000, 8,000, 8,000
Compute the mean of the given sample. Round your answer to the nearest whole number.
__________
Compute the standard deviation of the given sample. Round your answer to the nearest whole number.
__________
Assuming the distribution of tow ratings for all popular light trucks is symmetric and bell-shaped, 68 percent of all light trucks have tow ratings between __________ and __________. Please, use the rounded value for the standard deviation here.
Find the percentage of scores in the sample that fall in this range.
__________%
Unlock Deck
Unlock for access to all 178 flashcards in this deck.
Unlock Deck
k this deck
79
Calculate the standard deviation of X for the probability distribution. Round your answer to the whole number. __________
__________ Unlock Deck
Unlock for access to all 178 flashcards in this deck.
Unlock Deck
k this deck
80
In 2000, 30 percent of all teenagers in some country had checking accounts. Your bank, TeenChex Inc., is interested in targeting teenagers who do not already have a checking account.
TeenChex selects a random sample of 1,000 teenagers. Find the number of teenagers without checking accounts it can expect.
__________
Find the standard deviation of this number. Please, round your answer to one decimal place.
__________
Fill in the missing quantities. Please round answers to the nearest whole number.
There is an approximately 95 percent chance that between __________ and __________ teenagers in the sample will not have checking accounts.
Unlock Deck
Unlock for access to all 178 flashcards in this deck.
Unlock Deck
k this deck
Unlock Deck
Unlock for access to all 178 flashcards in this deck.


