Deck 2: Descriptive Statistics
Full screen (f)
Question
Question
Question
Question
Question
Question
Question
Question
Question
Question
Question
Question
Question
Question
Question
Question
Question
Question
Question
Question
Identify the shape of the distribution in the figure below. 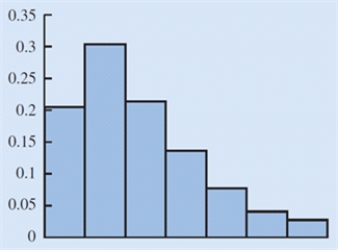
A)Moderately skewed left
B)Symmetric
C)Approximately Bell Shaped
D)Moderately skewed right
A)Moderately skewed left
B)Symmetric
C)Approximately Bell Shaped
D)Moderately skewed right
Question
Question
Question
Question
Question
Question
Question
Question
Question
Question
Question
Question
Question
Question
Question
Question
Question
Question
Question
Question
Question
Question
A survey on the most preferred newspaper in the USA listed The New York Times(TNYT), Washington Post(WP), Daily News(DN), New York Post(NYP), and Los Angeles Times (LAT) as the top five most preferred newspapers. The table below shows the preferences of 50 citizens. 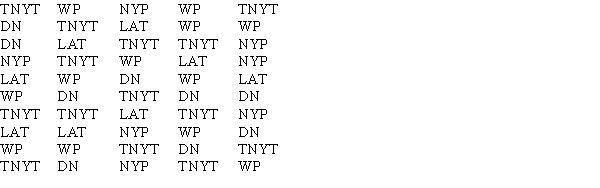
a. Are these data categorical or quantitative?
b. Provide frequency and percent frequency distributions.
c. On the basis of the sample, which newspaper is preferred the most?
a. Are these data categorical or quantitative?
b. Provide frequency and percent frequency distributions.
c. On the basis of the sample, which newspaper is preferred the most?
Question
Question
Suppose that you make a fixed deposit of $1,000 in Bank X and $500 in Bank Y. The value of each investment at the end of each subsequent year is provided in the table.
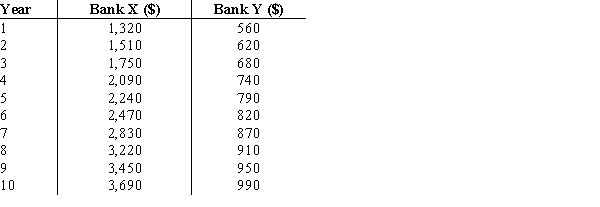
Which of the two banks provides a better return over this time period?
Which of the two banks provides a better return over this time period?
Question
Suppose that the average time an employee takes to reach the office is 35 minutes. To address the issue of late comers, the mode of transport chosen by the employee is tracked: private transport (two-wheelers and four-wheelers) and public transport. The data on the average time (in minutes) taken using both a private transportation system and a public transportation system for a sample of employees are given below. 
a. Considering the travel times (in minutes) of employees using private transport, compute the z-score for the tenth employee with travel time of 29 minutes.
b. Considering the travel times (in minutes) of employees using public transport, compute the z-score for the second employee with travel time of 29 minutes. How does this z-score compare with the z-score you calculated for part a?
c. Based on z-scores, do the data for employees using private transport and public transport contain any outliers?
Question
Consider the following data on income and savings of a sample of residents in a locality: 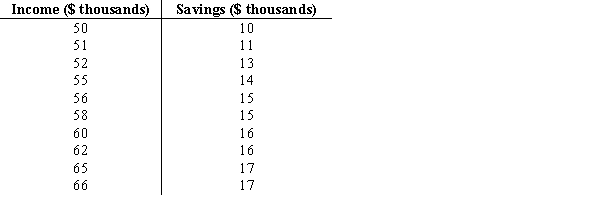
a. Compute the correlation coefficient. Is there a positive correlation between the income and savings? What is your interpretation?
b. Show a scatter diagram of the relationship between the income and savings.
a. Compute the correlation coefficient. Is there a positive correlation between the income and savings? What is your interpretation?
b. Show a scatter diagram of the relationship between the income and savings.
Question
Suppose that the average time an employee takes to reach the office is 35 minutes. To address the issue of late comers, the mode of transport chosen by the employee is tracked: private transport (two-wheelers and four-wheelers) and public transport. The data on the average time (in minutes) taken using both a private transportation system and a public transportation system for a sample of employees are given below. 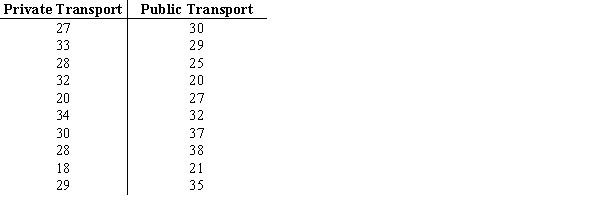
a. What are the mean and median travel times for employees using a private transport? What are the mean and median travel times for employees using a public transport?
b. What are the variance and standard deviation of travel times for employees using a private transport? What are the variance and standard deviation of travel times for employees using a public transport?
c. Comment on the results.
Question
Question
Question
The partial relative frequency distribution is given below: 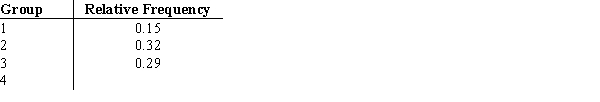
a. What is the relative frequency of group 4?
b. The total sample size is 400. What is the frequency of group 4?
c. Show the frequency distribution.
d. Show the percent frequency distribution.
a. What is the relative frequency of group 4?
b. The total sample size is 400. What is the frequency of group 4?
c. Show the frequency distribution.
d. Show the percent frequency distribution.
Question
Question
The average time a customer service executive takes to resolve an issue on a mobile handset is 26.4 minutes. The average times taken to resolve the issue by a sample of 15 such executives are shown below. 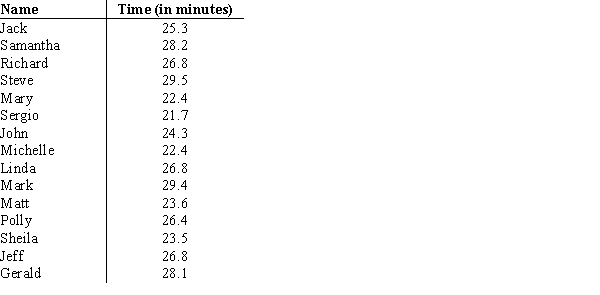
a. What is the mean resolution time?
b. What is the median resolution time?
c. What is the mode for these 15 executives?
d. What is the variance and standard deviation?
e. What is the third quartile?
a. What is the mean resolution time?
b. What is the median resolution time?
c. What is the mode for these 15 executives?
d. What is the variance and standard deviation?
e. What is the third quartile?
Question
Question
Question
Question
Question
Eight observations taken for two variables are as follows: 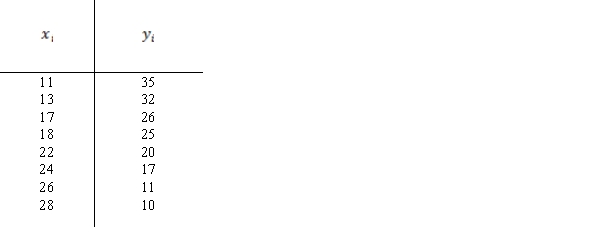
a. Develop a scatter diagram with x on the horizontal axis.
b. What does the scatter diagram developed in part (a) indicate about the relationship between the two variables?
c. Compute and interpret the sample covariance.
d. Compute and interpret the sample correlation coefficient.
a. Develop a scatter diagram with x on the horizontal axis.
b. What does the scatter diagram developed in part (a) indicate about the relationship between the two variables?
c. Compute and interpret the sample covariance.
d. Compute and interpret the sample correlation coefficient.
Question
Question
The mentor of a class researched the number of hours spent on study in a week by each student of the class in order to analyze the correlation between the study hours and the marks obtained by each student. The data on the hours spent per week by 25 students are listed below. 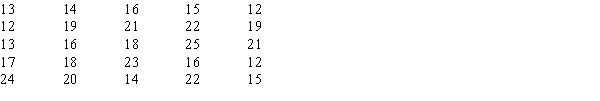
a. What is the least amount of time a student spent per week on studying in this sample? The highest?
b. Use a class width of 2 hours to prepare a frequency distribution, a relative frequency distribution, and a percent frequency distribution for the data.
c. Prepare a histogram and comment on the shape of the distribution.
Question
The following table provides information on the number of billionaires in a country and the continents on which these countries are located. 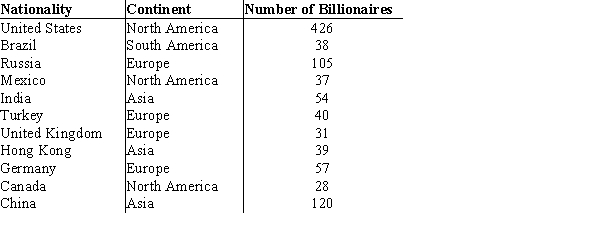
a. Sort the countries from largest to smallest based on the number of billionaires. What are the top five countries according to the number of billionaires?
b. Filter the countries to display only the countries located in North America.
a. Sort the countries from largest to smallest based on the number of billionaires. What are the top five countries according to the number of billionaires?
b. Filter the countries to display only the countries located in North America.
Question
Question
Question
Question
Question
Which graph represents a negative linear relationship between x and y? 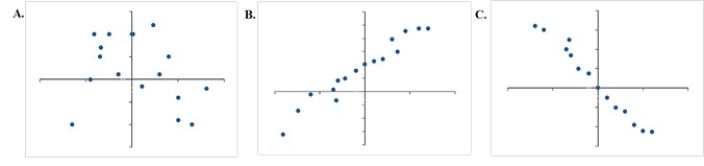
A)A
B)B
C)C
D)None of the graphs display a negative linear relationship.
A)A
B)B
C)C
D)None of the graphs display a negative linear relationship.
Question
Question
Question
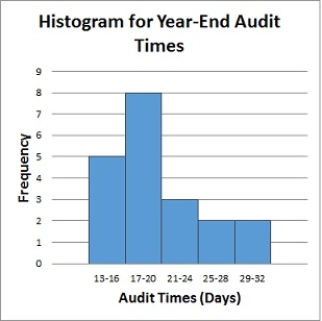
Below is a histogram for the number of days that it took Wyche Accounting to perform audits in the last quarter of last year. What is the relative frequency of the 21-24 bin? 
A)0.05
B)0.14
C)0.25
D)2.5
A)0.05
B)0.14
C)0.25
D)2.5
Question
Question
Question
Below is a histogram for the number of days that it took Wyche Accounting to perform audits in the last quarter of last year. What is the frequency of the 25-28 bin? 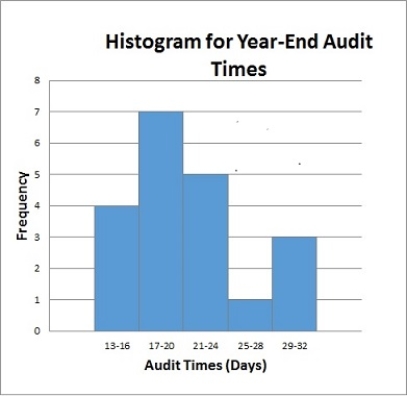
A)0.05
B)1
C)0.5
D)4
A)0.05
B)1
C)0.5
D)4
Question
Below is a histogram for the number of days that it took Wyche Accounting to perform audits in the last quarter of last year. What is the relative frequency of the 21-24 bin?

Question
Select the histogram that is moderately skewed right. 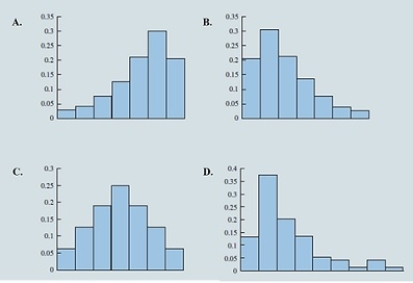
A)A
B)B
C)C
D)D
A)A
B)B
C)C
D)D
Question
Below is a histogram for the number of days that it took Wyche Accounting to perform audits in the last quarter of last year. What is the relative frequency of the 25-28 bin?
Question
Question
Question
Below is a histogram for the number of days that it took Wyche Accounting to perform audits in the last quarter of last year. What is the bin size for the histogram? 
A)3
B)4
C)16
D)5
A)3
B)4
C)16
D)5
Question
Question
Question

Unlock Deck
Sign up to unlock the cards in this deck!
Unlock Deck
Unlock Deck
1/84
Play
Full screen (f)
Deck 2: Descriptive Statistics
1
_______________ act(s) as a representative of the population.
A)The analytics
B)The variance
C)A sample
D)The random variables
A)The analytics
B)The variance
C)A sample
D)The random variables
A sample
2
The data collected from the customers in restaurants about the quality of food is an example of a(n)
A)variable study.
B)cross-sectional study.
C)experimental study.
D)observational study.
A)variable study.
B)cross-sectional study.
C)experimental study.
D)observational study.
observational study.
3
A set of values corresponding to a set of variables is defined as a(n)
A)quantity.
B)event.
C)factor.
D)observation.
A)quantity.
B)event.
C)factor.
D)observation.
observation.
4
In a(n) ________________, one or more variables are identified and controlled or manipulated so that data can be obtained about how they influence the variable of interest identified first.
A)experimental study
B)observational study
C)categorical study
D)variable study
A)experimental study
B)observational study
C)categorical study
D)variable study
Unlock Deck
Unlock for access to all 84 flashcards in this deck.
Unlock Deck
k this deck
5
Data collected from several entities over a period of time (minutes, hours, days, etc.) are called
A)categorical and quantitative data.
B)time series data.
C)source data.
D)cross-sectional data.
A)categorical and quantitative data.
B)time series data.
C)source data.
D)cross-sectional data.
Unlock Deck
Unlock for access to all 84 flashcards in this deck.
Unlock Deck
k this deck
6
A _______________ is a graphical summary of data previously summarized in a frequency distribution.
A)box plot
B)histogram
C)line chart
D)scatter chart
A)box plot
B)histogram
C)line chart
D)scatter chart
Unlock Deck
Unlock for access to all 84 flashcards in this deck.
Unlock Deck
k this deck
7
____________________ are collected from several entities at the same point in time.
A)Time series data
B)Categorical and quantitative data
C)Cross-sectional data
D)Random data
A)Time series data
B)Categorical and quantitative data
C)Cross-sectional data
D)Random data
Unlock Deck
Unlock for access to all 84 flashcards in this deck.
Unlock Deck
k this deck
8
Which of the following are necessary to be determined to define the classes for a frequency distribution with quantitative data?
A)Number of nonoverlapping bins, width of each bin, and bin limits
B)Width of each bin and bin lower limits
C)Number of overlapping bins, width of each bin, and bin upper limits
D)Width of each bin and number of bins
A)Number of nonoverlapping bins, width of each bin, and bin limits
B)Width of each bin and bin lower limits
C)Number of overlapping bins, width of each bin, and bin upper limits
D)Width of each bin and number of bins
Unlock Deck
Unlock for access to all 84 flashcards in this deck.
Unlock Deck
k this deck
9
Consider the data below. What percentage of students scored grade C?
A)33%
B)31%
C)37%
D)28%
A)33%
B)31%
C)37%
D)28%
Unlock Deck
Unlock for access to all 84 flashcards in this deck.
Unlock Deck
k this deck
10
The letter grades of business analysis students is recorded by a professor (4=A, 3=B, 2=C, 1=D). This variable's classification
A)is quantitative data.
B)cannot be determined.
C)is categorical data.
D)is nominal data.
A)is quantitative data.
B)cannot be determined.
C)is categorical data.
D)is nominal data.
Unlock Deck
Unlock for access to all 84 flashcards in this deck.
Unlock Deck
k this deck
11
A quantity of interest that can take on different values is known as a(n)
A)variable.
B)parameter.
C)sample.
D)observation.
A)variable.
B)parameter.
C)sample.
D)observation.
Unlock Deck
Unlock for access to all 84 flashcards in this deck.
Unlock Deck
k this deck
12
The data on the time taken by 10 students in a class to complete an exam is an example of what type of data?
A)Cannot be determined
B)Categorical data
C)Time series data
D)Quantitative data
A)Cannot be determined
B)Categorical data
C)Time series data
D)Quantitative data
Unlock Deck
Unlock for access to all 84 flashcards in this deck.
Unlock Deck
k this deck
13
Compute the relative frequencies for the data given in the table below:
A)0.31, 0.14, 0.37, 0.18
B)0.37, 0.14, 0.31, 0.18
C)0.16, 0.28, 0.33, 0.13
D)0.18, 0.31, 0.37, 0.14
A)0.31, 0.14, 0.37, 0.18
B)0.37, 0.14, 0.31, 0.18
C)0.16, 0.28, 0.33, 0.13
D)0.18, 0.31, 0.37, 0.14
Unlock Deck
Unlock for access to all 84 flashcards in this deck.
Unlock Deck
k this deck
14
The goal regarding using an appropriate number of bins is to show the
A)number of observations.
B)number of variables.
C)variation in the data.
D)correlation in the data.
A)number of observations.
B)number of variables.
C)variation in the data.
D)correlation in the data.
Unlock Deck
Unlock for access to all 84 flashcards in this deck.
Unlock Deck
k this deck
15
Which of the following gives the proportion of items in each bin?
A)Frequency
B)Class size
C)Relative frequency
D)Bin proportion
A)Frequency
B)Class size
C)Relative frequency
D)Bin proportion
Unlock Deck
Unlock for access to all 84 flashcards in this deck.
Unlock Deck
k this deck
16
When working with large spreadsheets with many rows of data, it can be helpful to ____________ the data to better find, view, or manage subsets of data.
A)split
B)sort and filter
C)chart
D)manipulate
A)split
B)sort and filter
C)chart
D)manipulate
Unlock Deck
Unlock for access to all 84 flashcards in this deck.
Unlock Deck
k this deck
17
The difference in a variable measured over observations (time, customers, items, etc.) is known as
A)observed differences.
B)variation.
C)variable change.
D)descriptive analytics.
A)observed differences.
B)variation.
C)variable change.
D)descriptive analytics.
Unlock Deck
Unlock for access to all 84 flashcards in this deck.
Unlock Deck
k this deck
18
A summary of data that shows the number of observations in each of several nonoverlapping bins is called a(n)
A)frequency distribution.
B)sample summary.
C)bin distribution.
D)observed distribution.
A)frequency distribution.
B)sample summary.
C)bin distribution.
D)observed distribution.
Unlock Deck
Unlock for access to all 84 flashcards in this deck.
Unlock Deck
k this deck
19
The act of collecting data that are representative of the population data is called
A)random sampling.
B)sample data.
C)population sampling.
D)applications of business analytics.
A)random sampling.
B)sample data.
C)population sampling.
D)applications of business analytics.
Unlock Deck
Unlock for access to all 84 flashcards in this deck.
Unlock Deck
k this deck
20
Identify the shape of the distribution in the figure below.
A)Moderately skewed left
B)Symmetric
C)Approximately Bell Shaped
D)Moderately skewed right
A)Moderately skewed left
B)Symmetric
C)Approximately Bell Shaped
D)Moderately skewed right
Unlock Deck
Unlock for access to all 84 flashcards in this deck.
Unlock Deck
k this deck
21
The ______________________ shows the number of data items with values less than or equal to the upper class limit of each class.
A)cumulative frequency distribution
B)frequency distribution
C)percent frequency distribution
D)relative frequency distribution
A)cumulative frequency distribution
B)frequency distribution
C)percent frequency distribution
D)relative frequency distribution
Unlock Deck
Unlock for access to all 84 flashcards in this deck.
Unlock Deck
k this deck
22
Compute the third quartile for the following data. 10, 15, 17, 21, 25, 12, 16, 11, 13, 22
A)21.25
B)15.5
C)21.5
D)11.75
A)21.25
B)15.5
C)21.5
D)11.75
Unlock Deck
Unlock for access to all 84 flashcards in this deck.
Unlock Deck
k this deck
23
Use technology to compute the standard deviation for the following sample data. 32, 41, 36, 24, 29, 30, 40, 22, 25, 37
A)5.96
B)6.41
C)5.42
D)6.75
A)5.96
B)6.41
C)5.42
D)6.75
Unlock Deck
Unlock for access to all 84 flashcards in this deck.
Unlock Deck
k this deck
24
For data having a bell-shaped distribution, approximately _____ percent of the data values will be within one standard deviation of the mean.
A)95
B)66
C)68
D)97
A)95
B)66
C)68
D)97
Unlock Deck
Unlock for access to all 84 flashcards in this deck.
Unlock Deck
k this deck
25
Compute the IQR for the following data. 10, 15, 17, 21, 25, 12, 16, 11, 13, 22
A)6.25
B)7.75
C)5.14
D)9.50
A)6.25
B)7.75
C)5.14
D)9.50
Unlock Deck
Unlock for access to all 84 flashcards in this deck.
Unlock Deck
k this deck
26
The simplest measure of variability is the
A)variance.
B)standard deviation.
C)coefficient of variation.
D)range.
A)variance.
B)standard deviation.
C)coefficient of variation.
D)range.
Unlock Deck
Unlock for access to all 84 flashcards in this deck.
Unlock Deck
k this deck
27
A _____________________ determines how far a particular value is from the mean relative to the data set's standard deviation.
A)coefficient of variation
B)z-score
C)variance
D)percentile
A)coefficient of variation
B)z-score
C)variance
D)percentile
Unlock Deck
Unlock for access to all 84 flashcards in this deck.
Unlock Deck
k this deck
28
The ________________ is a point estimate of the population mean for the variable of interest.
A)sample mean
B)median
C)sample
D)geometric mean
A)sample mean
B)median
C)sample
D)geometric mean
Unlock Deck
Unlock for access to all 84 flashcards in this deck.
Unlock Deck
k this deck
29
Compute the coefficient of variation for the following sample data. 32, 41, 36, 24, 29, 30, 40, 22, 25, 37
A)18.64%
B)21.36%
C)20.28%
D)21.67%
A)18.64%
B)21.36%
C)20.28%
D)21.67%
Unlock Deck
Unlock for access to all 84 flashcards in this deck.
Unlock Deck
k this deck
30
The variance is based on the
A)deviation about the median.
B)number of variables.
C)deviation about the mean.
D)correlation in the data.
A)deviation about the median.
B)number of variables.
C)deviation about the mean.
D)correlation in the data.
Unlock Deck
Unlock for access to all 84 flashcards in this deck.
Unlock Deck
k this deck
31
Compute the mode for the following data. 12, 16, 19, 10, 12, 11, 21, 12, 21, 10
A)21
B)11
C)12
D)10
A)21
B)11
C)12
D)10
Unlock Deck
Unlock for access to all 84 flashcards in this deck.
Unlock Deck
k this deck
32
Scores on Ms. Bond's test have a mean of 70 and a standard deviation of 11. Michelle has a score of 48. Convert Michelle's score to a z-score. (Round to two decimal places if necessary.)
A)2
B)41.64
C)-2
D)1.33
A)2
B)41.64
C)-2
D)1.33
Unlock Deck
Unlock for access to all 84 flashcards in this deck.
Unlock Deck
k this deck
33
The correlation coefficient will always take values
A)greater than 0.
B)between -1 and 0.
C)between -1 and +1.
D)less than -1.
A)greater than 0.
B)between -1 and 0.
C)between -1 and +1.
D)less than -1.
Unlock Deck
Unlock for access to all 84 flashcards in this deck.
Unlock Deck
k this deck
34
Any data value with a z-score less than -3 or greater than +3 is considered to be a(n)
A)outlier.
B)usual value.
C)whisker.
D)z-score value.
A)outlier.
B)usual value.
C)whisker.
D)z-score value.
Unlock Deck
Unlock for access to all 84 flashcards in this deck.
Unlock Deck
k this deck
35
Compute the geometric mean for the following data on growth factors of an investment for 10 years. 1.10, 0.50, 0.70, 1.21, 1.25, 1.12, 1.16, 1.11, 1.13, 1.22
A)1.0221
B)1.0148
C)1.0363
D)1.1475
A)1.0221
B)1.0148
C)1.0363
D)1.1475
Unlock Deck
Unlock for access to all 84 flashcards in this deck.
Unlock Deck
k this deck
36
Compute the 50th percentile for the following data. 10, 15, 17, 21, 25, 12, 16, 11, 13, 22
A)18.6
B)13.3
C)15.5
D)17.7
A)18.6
B)13.3
C)15.5
D)17.7
Unlock Deck
Unlock for access to all 84 flashcards in this deck.
Unlock Deck
k this deck
37
If covariance between two variables is near 0, it implies that
A)a positive relationship exists between the variables.
B)the variables are not linearly related.
C)the variables are negatively related.
D)the variables are strongly related.
A)a positive relationship exists between the variables.
B)the variables are not linearly related.
C)the variables are negatively related.
D)the variables are strongly related.
Unlock Deck
Unlock for access to all 84 flashcards in this deck.
Unlock Deck
k this deck
38
Which of the following graphs provides information on outliers and IQR of a data set?
A)Histogram
B)Line chart
C)Scatter chart
D)Box plot
A)Histogram
B)Line chart
C)Scatter chart
D)Box plot
Unlock Deck
Unlock for access to all 84 flashcards in this deck.
Unlock Deck
k this deck
39
Compute the median of the following data. 32, 41, 36, 24, 29, 30, 40, 22, 25, 37
A)28
B)31
C)40
D)34
A)28
B)31
C)40
D)34
Unlock Deck
Unlock for access to all 84 flashcards in this deck.
Unlock Deck
k this deck
40
Compute the mean of the following data. 56, 42, 37, 29, 45, 51, 30, 25, 34, 57
A)42.8
B)52.1
C)40.6
D)39.4
A)42.8
B)52.1
C)40.6
D)39.4
Unlock Deck
Unlock for access to all 84 flashcards in this deck.
Unlock Deck
k this deck
41
The College Board reported that, in 2014, the mean Math Level 2 SAT subject test score was 686 with a standard deviation of 96. Assuming scores follow a bell-shaped distribution, use the empirical rule to find the percentage of students who scored less than 494.
A)97.5%
B)95%
C)2.5%
D)5%
A)97.5%
B)95%
C)2.5%
D)5%
Unlock Deck
Unlock for access to all 84 flashcards in this deck.
Unlock Deck
k this deck
42
A survey on the most preferred newspaper in the USA listed The New York Times(TNYT), Washington Post(WP), Daily News(DN), New York Post(NYP), and Los Angeles Times (LAT) as the top five most preferred newspapers. The table below shows the preferences of 50 citizens.
a. Are these data categorical or quantitative?
b. Provide frequency and percent frequency distributions.
c. On the basis of the sample, which newspaper is preferred the most?
a. Are these data categorical or quantitative?
b. Provide frequency and percent frequency distributions.
c. On the basis of the sample, which newspaper is preferred the most?
Unlock Deck
Unlock for access to all 84 flashcards in this deck.
Unlock Deck
k this deck
43
Scores on Ms. Bond's test have a mean of 70 and a standard deviation of 11. David has a score of 52 on Ms. Bond's test. Scores on Ms. Nash's test have a mean of 64 and a standard deviation of 6. Steven has a score of 52 on Ms. Nash's test. Which student has the higher standardized score?
A)David's standardized score is -1.64 and Steven's standardized scores -2.00. Therefore, David has the higher standardized score.
B)David's standardized score is -1.64 and Steven's standardized scores -2.00. Therefore, Steven has the higher standardized score.
C)David's standardized score is 1.64 and Steven's standardized scores 2.00. Therefore, Steven has the higher standardized score.
D)Cannot be determined with the information provided.
Unlock Deck
Unlock for access to all 84 flashcards in this deck.
Unlock Deck
k this deck
44
Suppose that you make a fixed deposit of $1,000 in Bank X and $500 in Bank Y. The value of each investment at the end of each subsequent year is provided in the table.
Which of the two banks provides a better return over this time period?
Which of the two banks provides a better return over this time period?
Unlock Deck
Unlock for access to all 84 flashcards in this deck.
Unlock Deck
k this deck
45
Suppose that the average time an employee takes to reach the office is 35 minutes. To address the issue of late comers, the mode of transport chosen by the employee is tracked: private transport (two-wheelers and four-wheelers) and public transport. The data on the average time (in minutes) taken using both a private transportation system and a public transportation system for a sample of employees are given below.
a. Considering the travel times (in minutes) of employees using private transport, compute the z-score for the tenth employee with travel time of 29 minutes.
b. Considering the travel times (in minutes) of employees using public transport, compute the z-score for the second employee with travel time of 29 minutes. How does this z-score compare with the z-score you calculated for part a?
c. Based on z-scores, do the data for employees using private transport and public transport contain any outliers?
Unlock Deck
Unlock for access to all 84 flashcards in this deck.
Unlock Deck
k this deck
46
Consider the following data on income and savings of a sample of residents in a locality:
a. Compute the correlation coefficient. Is there a positive correlation between the income and savings? What is your interpretation?
b. Show a scatter diagram of the relationship between the income and savings.
a. Compute the correlation coefficient. Is there a positive correlation between the income and savings? What is your interpretation?
b. Show a scatter diagram of the relationship between the income and savings.
Unlock Deck
Unlock for access to all 84 flashcards in this deck.
Unlock Deck
k this deck
47
Suppose that the average time an employee takes to reach the office is 35 minutes. To address the issue of late comers, the mode of transport chosen by the employee is tracked: private transport (two-wheelers and four-wheelers) and public transport. The data on the average time (in minutes) taken using both a private transportation system and a public transportation system for a sample of employees are given below.
a. What are the mean and median travel times for employees using a private transport? What are the mean and median travel times for employees using a public transport?
b. What are the variance and standard deviation of travel times for employees using a private transport? What are the variance and standard deviation of travel times for employees using a public transport?
c. Comment on the results.
Unlock Deck
Unlock for access to all 84 flashcards in this deck.
Unlock Deck
k this deck
48
A study on the average minutes spent by students on internet usage is 300 with a standard deviation of 102. Answer the following questions assuming a bell-shaped distribution and using the empirical rule.
a. What percentage of students use internet for more than 402 minutes?
b. What percentage of students use internet for more than 504 minutes?
c. What percentage of students use internet between 198 minutes and 300 minutes?
a. What percentage of students use internet for more than 402 minutes?
b. What percentage of students use internet for more than 504 minutes?
c. What percentage of students use internet between 198 minutes and 300 minutes?
Unlock Deck
Unlock for access to all 84 flashcards in this deck.
Unlock Deck
k this deck
49
The College Board originally scaled SAT scores so that the scores for each section were approximately normally distributed with a mean of 500 and a standard deviation of 100. Assuming scores follow a bell-shaped distribution, use the empirical rule to find the percentage of students who scored less than 400.
A)16%
B)68%
C)84%
D)32%
A)16%
B)68%
C)84%
D)32%
Unlock Deck
Unlock for access to all 84 flashcards in this deck.
Unlock Deck
k this deck
50
The partial relative frequency distribution is given below:
a. What is the relative frequency of group 4?
b. The total sample size is 400. What is the frequency of group 4?
c. Show the frequency distribution.
d. Show the percent frequency distribution.
a. What is the relative frequency of group 4?
b. The total sample size is 400. What is the frequency of group 4?
c. Show the frequency distribution.
d. Show the percent frequency distribution.
Unlock Deck
Unlock for access to all 84 flashcards in this deck.
Unlock Deck
k this deck
51
A student willing to participate in a debate competition is required to fill out a registration form. State whether each of the following information about the participant provides categorical or quantitative data.
a. What is your date of birth?
b. Have you participated in any debate competition previously?
c. If yes, in how many debate competitions have you participated so far?
d. Have you won any of the competitions?
e. If yes, how many have you won?
a. What is your date of birth?
b. Have you participated in any debate competition previously?
c. If yes, in how many debate competitions have you participated so far?
d. Have you won any of the competitions?
e. If yes, how many have you won?
Unlock Deck
Unlock for access to all 84 flashcards in this deck.
Unlock Deck
k this deck
52
The average time a customer service executive takes to resolve an issue on a mobile handset is 26.4 minutes. The average times taken to resolve the issue by a sample of 15 such executives are shown below.
a. What is the mean resolution time?
b. What is the median resolution time?
c. What is the mode for these 15 executives?
d. What is the variance and standard deviation?
e. What is the third quartile?
a. What is the mean resolution time?
b. What is the median resolution time?
c. What is the mode for these 15 executives?
d. What is the variance and standard deviation?
e. What is the third quartile?
Unlock Deck
Unlock for access to all 84 flashcards in this deck.
Unlock Deck
k this deck
53
The results of a survey showed that, on average, children spend 5.6 hours at PlayStation per week. Suppose that the standard deviation is 1.7 hours and that the number of hours at PlayStation follows a bell-shaped distribution.
a. Use the empirical rule to calculate the percentage of children who spend between 2.2 and 9 hours at PlayStation per week.
b. What is the z-value for a child who spends 7.5 hours at PlayStation per week?
c. What is the z-value for a child who spends 4.5 hours at PlayStation per week?
a. Use the empirical rule to calculate the percentage of children who spend between 2.2 and 9 hours at PlayStation per week.
b. What is the z-value for a child who spends 7.5 hours at PlayStation per week?
c. What is the z-value for a child who spends 4.5 hours at PlayStation per week?
Unlock Deck
Unlock for access to all 84 flashcards in this deck.
Unlock Deck
k this deck
54
Scores on Ms. Nash's test have a mean of 64 and a standard deviation of 9. Steve has a score of 52. Convert Steve's score to a z-score. (Round to two decimal places if necessary.)
A)1.33
B)58.2
C)-2
D)-1.33
A)1.33
B)58.2
C)-2
D)-1.33
Unlock Deck
Unlock for access to all 84 flashcards in this deck.
Unlock Deck
k this deck
55
The College Board originally scaled SAT scores so that the scores for each section were approximately normally distributed with a mean of 500 and a standard deviation of 100. Assuming scores follow a bell-shaped distribution, use the empirical rule to find the percentage of students who scored greater than 700.
A)97.5%
B)95%
C)2.5%
D)5%
A)97.5%
B)95%
C)2.5%
D)5%
Unlock Deck
Unlock for access to all 84 flashcards in this deck.
Unlock Deck
k this deck
56
Consider a sample on the waiting times (in minutes) at the billing counter in a grocery store to be 15, 24, 18, 15, 21, 20, 15, 22, 19, 16, 15, 22, 20, 15, and 21. Compute the mean, median, and mode.
Unlock Deck
Unlock for access to all 84 flashcards in this deck.
Unlock Deck
k this deck
57
Eight observations taken for two variables are as follows:
a. Develop a scatter diagram with x on the horizontal axis.
b. What does the scatter diagram developed in part (a) indicate about the relationship between the two variables?
c. Compute and interpret the sample covariance.
d. Compute and interpret the sample correlation coefficient.
a. Develop a scatter diagram with x on the horizontal axis.
b. What does the scatter diagram developed in part (a) indicate about the relationship between the two variables?
c. Compute and interpret the sample covariance.
d. Compute and interpret the sample correlation coefficient.
Unlock Deck
Unlock for access to all 84 flashcards in this deck.
Unlock Deck
k this deck
58
Consider a sample on the waiting times (in minutes) at the billing counter in a grocery store to be 15, 24, 18, 15, 21, 20, 15, 22, 19, 16, 15, 22, 20, 15, and 21. Compute the 25th, 50th, and 75th percentiles.
Unlock Deck
Unlock for access to all 84 flashcards in this deck.
Unlock Deck
k this deck
59
The mentor of a class researched the number of hours spent on study in a week by each student of the class in order to analyze the correlation between the study hours and the marks obtained by each student. The data on the hours spent per week by 25 students are listed below.
a. What is the least amount of time a student spent per week on studying in this sample? The highest?
b. Use a class width of 2 hours to prepare a frequency distribution, a relative frequency distribution, and a percent frequency distribution for the data.
c. Prepare a histogram and comment on the shape of the distribution.
Unlock Deck
Unlock for access to all 84 flashcards in this deck.
Unlock Deck
k this deck
60
The following table provides information on the number of billionaires in a country and the continents on which these countries are located.
a. Sort the countries from largest to smallest based on the number of billionaires. What are the top five countries according to the number of billionaires?
b. Filter the countries to display only the countries located in North America.
a. Sort the countries from largest to smallest based on the number of billionaires. What are the top five countries according to the number of billionaires?
b. Filter the countries to display only the countries located in North America.
Unlock Deck
Unlock for access to all 84 flashcards in this deck.
Unlock Deck
k this deck
61
What is the relative frequency for Devon Pride? ? ?
A)0.12
B)99.12
C)0.88
D)Not enough information
A)0.12
B)99.12
C)0.88
D)Not enough information
Unlock Deck
Unlock for access to all 84 flashcards in this deck.
Unlock Deck
k this deck
62
Compute the relative frequencies for students who earned an A shown in the table of grades below. ? ?
A)0.12
B)0.10
C)?0.83
D)Not enough information
A)0.12
B)0.10
C)?0.83
D)Not enough information
Unlock Deck
Unlock for access to all 84 flashcards in this deck.
Unlock Deck
k this deck
63
You have been asked to reorganize the Excel table below into order of sales using the Sales column. Which option will allow you to do this quickly? ? ?
?
A)?Use the Cut and Paste function to reorganize the data into order of sales.
B)?Use the Filter function to organize the data into order of sales.
C)?Use the Order function to organize the data into order of sales.
D)?Use the Sort function to organize the data into order of sales.
?
A)?Use the Cut and Paste function to reorganize the data into order of sales.
B)?Use the Filter function to organize the data into order of sales.
C)?Use the Order function to organize the data into order of sales.
D)?Use the Sort function to organize the data into order of sales.
Unlock Deck
Unlock for access to all 84 flashcards in this deck.
Unlock Deck
k this deck
64
Which Excel command will return all modes when more than one mode exists?
A)MODE.MULT
B)MODE.SNGL
C)MODE
D)MODES
A)MODE.MULT
B)MODE.SNGL
C)MODE
D)MODES
Unlock Deck
Unlock for access to all 84 flashcards in this deck.
Unlock Deck
k this deck
65
Which graph represents a negative linear relationship between x and y?
A)A
B)B
C)C
D)None of the graphs display a negative linear relationship.
A)A
B)B
C)C
D)None of the graphs display a negative linear relationship.
Unlock Deck
Unlock for access to all 84 flashcards in this deck.
Unlock Deck
k this deck
66
What is the total relative frequency? ? ?
A)1
B)99.12
C)0.88
D)Not enough information
A)1
B)99.12
C)0.88
D)Not enough information
Unlock Deck
Unlock for access to all 84 flashcards in this deck.
Unlock Deck
k this deck
67
Compute the relative frequencies for students who earned a C shown in the table of grades below. ? ?
A)0.43
B)0.53
C)?0.83
D)Not enough information
A)0.43
B)0.53
C)?0.83
D)Not enough information
Unlock Deck
Unlock for access to all 84 flashcards in this deck.
Unlock Deck
k this deck
68
Below is a histogram for the number of days that it took Wyche Accounting to perform audits in the last quarter of last year. What is the relative frequency of the 21-24 bin?
A)0.05
B)0.14
C)0.25
D)2.5
A)0.05
B)0.14
C)0.25
D)2.5
Unlock Deck
Unlock for access to all 84 flashcards in this deck.
Unlock Deck
k this deck
69
A sample of 13 adult males' heights are listed below.
70, 72, 71, 70, 69, 73, 69, 68, 70, 71, 67, 71, 74
Find the range of the data.
A)7
B)6.5
C)5
D)4
70, 72, 71, 70, 69, 73, 69, 68, 70, 71, 67, 71, 74
Find the range of the data.
A)7
B)6.5
C)5
D)4
Unlock Deck
Unlock for access to all 84 flashcards in this deck.
Unlock Deck
k this deck
70
What is the mode of the data set given below?
35, 47, 65, 47, 22
A)47.5
B)47
C)65
D)22
35, 47, 65, 47, 22
A)47.5
B)47
C)65
D)22
Unlock Deck
Unlock for access to all 84 flashcards in this deck.
Unlock Deck
k this deck
71
Below is a histogram for the number of days that it took Wyche Accounting to perform audits in the last quarter of last year. What is the frequency of the 25-28 bin?
A)0.05
B)1
C)0.5
D)4
A)0.05
B)1
C)0.5
D)4
Unlock Deck
Unlock for access to all 84 flashcards in this deck.
Unlock Deck
k this deck
72
Below is a histogram for the number of days that it took Wyche Accounting to perform audits in the last quarter of last year. What is the relative frequency of the 21-24 bin?
Unlock Deck
Unlock for access to all 84 flashcards in this deck.
Unlock Deck
k this deck
73
Select the histogram that is moderately skewed right.
A)A
B)B
C)C
D)D
A)A
B)B
C)C
D)D
Unlock Deck
Unlock for access to all 84 flashcards in this deck.
Unlock Deck
k this deck
74
Below is a histogram for the number of days that it took Wyche Accounting to perform audits in the last quarter of last year. What is the relative frequency of the 25-28 bin?
Unlock Deck
Unlock for access to all 84 flashcards in this deck.
Unlock Deck
k this deck
75
In a survey of patients in a local hospital, 62.42% of the respondents indicated that the health care providers needed to spend more time with each patient. What is the population being studied?
A)All patients in a local hospital
B)All survey respondents
C)Hospital patients
D)Cannot be determined from the information given
A)All patients in a local hospital
B)All survey respondents
C)Hospital patients
D)Cannot be determined from the information given
Unlock Deck
Unlock for access to all 84 flashcards in this deck.
Unlock Deck
k this deck
76
Below is the data for the number of days that it took Wyche Accounting to perform audits in the last quarter of last year.
56, 42, 37, 29, 45, 51, 30, 25, 34, 57
What is the median number of days that it took Wyche Accounting to perform audits in the last quarter of last year?
A)41
B)40.6
C)39.5
D)42
56, 42, 37, 29, 45, 51, 30, 25, 34, 57
What is the median number of days that it took Wyche Accounting to perform audits in the last quarter of last year?
A)41
B)40.6
C)39.5
D)42
Unlock Deck
Unlock for access to all 84 flashcards in this deck.
Unlock Deck
k this deck
77
Below is a histogram for the number of days that it took Wyche Accounting to perform audits in the last quarter of last year. What is the bin size for the histogram?
A)3
B)4
C)16
D)5
A)3
B)4
C)16
D)5
Unlock Deck
Unlock for access to all 84 flashcards in this deck.
Unlock Deck
k this deck
78
James's manager asked him to sort the last names in the following list in descending order. What does this mean? ? ?
?
A)?The last names must be sorted from A to Z.
B)?The last names must be sorted from Z to A.
C)?The last names must be sorted from the earliest to the latest that has been added to the list.
D)?James should use the Sort function to organize the data into order of sales.
?
A)?The last names must be sorted from A to Z.
B)?The last names must be sorted from Z to A.
C)?The last names must be sorted from the earliest to the latest that has been added to the list.
D)?James should use the Sort function to organize the data into order of sales.
Unlock Deck
Unlock for access to all 84 flashcards in this deck.
Unlock Deck
k this deck
79
In a survey of patients in a local hospital, 62.42% of the respondents indicated that the health care providers needed to spend more time with each patient. What is the sample for the population being studied?
A)All patients in a local hospital
B)All survey respondents
C)Hospital patients
D)Cannot be determined from the information given
A)All patients in a local hospital
B)All survey respondents
C)Hospital patients
D)Cannot be determined from the information given
Unlock Deck
Unlock for access to all 84 flashcards in this deck.
Unlock Deck
k this deck
80
Below are the data for the number of days that it took Wyche Accounting to perform audits in the last quarter of last year.
56, 42, 37, 29, 45, 51, 30, 25, 34, 57
What is(are) the mode(s) number of days that it took Wyche Accounting to perform audits in the last quarter of last year?
56, 42, 37, 29, 45, 51, 30, 25, 34, 57
What is(are) the mode(s) number of days that it took Wyche Accounting to perform audits in the last quarter of last year?
Unlock Deck
Unlock for access to all 84 flashcards in this deck.
Unlock Deck
k this deck
Unlock Deck
Unlock for access to all 84 flashcards in this deck.


