Exam 2: Descriptive Statistics
Exam 1: Introduction49 Questions
Exam 2: Descriptive Statistics84 Questions
Exam 3: Data Visualization69 Questions
Exam 4: Descriptive Data Mining56 Questions
Exam 5: Probability: an Introduction to Modeling Uncertainty62 Questions
Exam 6: Statistical Inference62 Questions
Exam 7: Linear Regression71 Questions
Exam 8: Time Series Analysis and Forecasting58 Questions
Exam 9: Predictive Data Mining40 Questions
Exam 10: Spreadsheet Models64 Questions
Exam 11: Linear Optimization Models58 Questions
Exam 12: Integer Linear Optimization Models56 Questions
Exam 13: Nonlinear Optimization Models55 Questions
Exam 14: Monte Carlo Simulation59 Questions
Exam 15: Decision Analysis58 Questions
Select questions type
What is the mode of the data set given below?
35, 47, 65, 47, 22
Free
(Multiple Choice)
4.9/5  (36)
(36)
Correct Answer: Verified
B
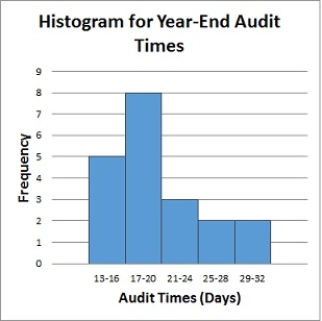
Below is a histogram for the number of days that it took Wyche Accounting to perform audits in the last quarter of last year. What is the relative frequency of the 25-28 bin?
Free
(Short Answer)
4.9/5 (29)
Correct Answer:Verified
0.10
For data having a bell-shaped distribution, approximately _____ percent of the data values will be within one standard deviation of the mean.
Free
(Multiple Choice)
5.0/5 (28)
Correct Answer:Verified
C
Compute the coefficient of variation for the following sample data. 32, 41, 36, 24, 29, 30, 40, 22, 25, 37
(Multiple Choice)
4.9/5 (32)
You have been asked to reorganize the Excel table below into order of sales using the Sales column. Which option will allow you to do this quickly? ? ?
?
(Multiple Choice)
4.8/5 (35)
A _______________ is a graphical summary of data previously summarized in a frequency distribution.
(Multiple Choice)
4.8/5 (38)
If covariance between two variables is near 0, it implies that
(Multiple Choice)
4.8/5 (38)
Which of the following graphs provides information on outliers and IQR of a data set?
(Multiple Choice)
4.9/5 (40)
The College Board originally scaled SAT scores so that the scores for each section were approximately normally distributed with a mean of 500 and a standard deviation of 100. Assuming scores follow a bell-shaped distribution, use the empirical rule to find the percentage of students who scored less than 400.
(Multiple Choice)
4.9/5 (27)
Suppose that you make a fixed deposit of $1,000 in Bank X and $500 in Bank Y. The value of each investment at the end of each subsequent year is provided in the table.
Y ear Bank X (\ ) Bank Y (\ ) 1 1,320 560 2 1,510 620 3 1,750 680 4 2,090 740 5 2,240 790 6 2,470 820 7 2,830 870 8 3,220 910 9 3,450 950 10 3,690 990
Which of the two banks provides a better return over this time period?
(Essay)
4.8/5 (37)
What is(are) the mode(s) of the following data set?
35, 42, 65, 42, 22
(Short Answer)
4.7/5 (26)
Which graph represents a negative linear relationship between x and y? 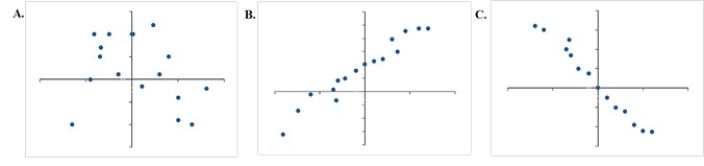
(Multiple Choice)
4.7/5 (31)
Any data value with a z-score less than -3 or greater than +3 is considered to be a(n)
(Multiple Choice)
4.8/5 (32)
Which of the following are necessary to be determined to define the classes for a frequency distribution with quantitative data?
(Multiple Choice)
4.8/5 (31)
The partial relative frequency distribution is given below: Group Relative Frequency 1 0.15 2 0.32 3 0.29
a. What is the relative frequency of group 4?
b. The total sample size is 400. What is the frequency of group 4?
c. Show the frequency distribution.
d. Show the percent frequency distribution.
(Essay)
4.9/5 (31)
The Excel function STANDARDIZE can be used to calculate ____________.
(Short Answer)
4.9/5 (32)
The data collected from the customers in restaurants about the quality of food is an example of a(n)
(Multiple Choice)
4.9/5 (28)
_______________ act(s) as a representative of the population.
(Multiple Choice)
4.7/5 (28)
In a(n) ________________, one or more variables are identified and controlled or manipulated so that data can be obtained about how they influence the variable of interest identified first.
(Multiple Choice)
4.8/5 (37)
A student willing to participate in a debate competition is required to fill out a registration form. State whether each of the following information about the participant provides categorical or quantitative data.
a. What is your date of birth?
b. Have you participated in any debate competition previously?
c. If yes, in how many debate competitions have you participated so far?
d. Have you won any of the competitions?
e. If yes, how many have you won?
(Essay)
4.9/5 (36)
Filters
- Essay(0)
- Multiple Choice(0)
- Short Answer(0)
- True False(0)
- Matching(0)