Deck 8: Time Series Analysis and Forecasting
Full screen (f)
Question
Question
A time series plot of a period of time (in years) verses sales (in thousands of dollars) is shown below Which of the following data patterns best describes the scenario shown? 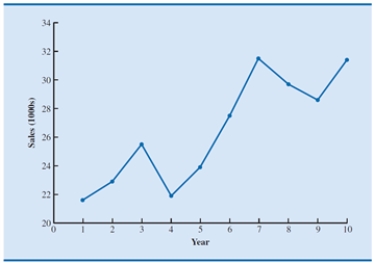
A)Linear trend pattern
B)Nonlinear trend pattern
C)Seasonal pattern
D)Cyclical pattern
A)Linear trend pattern
B)Nonlinear trend pattern
C)Seasonal pattern
D)Cyclical pattern
Question
Question
Question
Question
Question
A time series plot of a period of time period (quarterly) verses quarterly sales (in $1,000s) is shown below. Which of the following data patterns best describes the scenario shown? 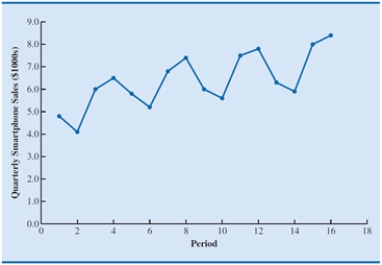
A)Linear trend and cyclical pattern
B)Linear trend and horizontal pattern
C)Seasonal and cyclical patterns
D)Seasonal pattern and linear trend
A)Linear trend and cyclical pattern
B)Linear trend and horizontal pattern
C)Seasonal and cyclical patterns
D)Seasonal pattern and linear trend
Question
A time series plot of a period of time (in months) verses sales (in number of units) is shown below. Which of the following data patterns best describes the scenario shown? 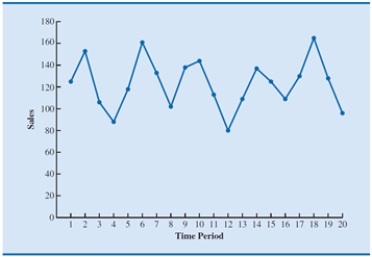
A)Linear trend pattern
B)Logarithmic trend
C)Exponential trend
D)Seasonal pattern
A)Linear trend pattern
B)Logarithmic trend
C)Exponential trend
D)Seasonal pattern
Question
Question
Question
Question
Question
A time series plot of a period of time (in years) verses revenue (in millions of dollars) is shown below .Which of the following data patterns best describes the scenario shown? 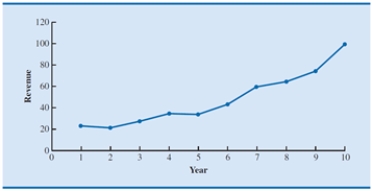
A)Linear trend pattern
B)Nonlinear trend pattern
C)Seasonal pattern
D)Cyclical pattern
A)Linear trend pattern
B)Nonlinear trend pattern
C)Seasonal pattern
D)Cyclical pattern
Question
Question
Question
A time series plot of a period of time (in weeks) verses sales (in 1,000's of gallons) is shown below. Which of the following data patterns best describes the scenario shown? 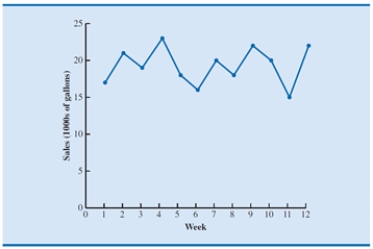
A)Time series with a linear trend pattern
B)Time series with a nonlinear trend pattern
C)Time series with no pattern
D)Time series with a horizontal pattern
A)Time series with a linear trend pattern
B)Time series with a nonlinear trend pattern
C)Time series with no pattern
D)Time series with a horizontal pattern
Question
Question
Question
Question
Question
Question
Question
Question
Question
Question
Question
Question
Question
Question
Question
Question
Question
Question
Question
Question
Question
Question
Question
Question
Question
Consider the following time series data. 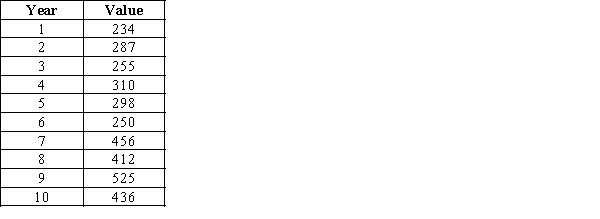 Using the naïve method (most recent value) as the forecast for the next year, compute the following measures of forecast accuracy.
a. Mean absolute error
b. Mean squared error
c. Mean absolute percentage error
d. What is the forecast for year 11?
Using the naïve method (most recent value) as the forecast for the next year, compute the following measures of forecast accuracy. a. Mean absolute error
b. Mean squared error
c. Mean absolute percentage error
d. What is the forecast for year 11?
Question
Consider the following time series. 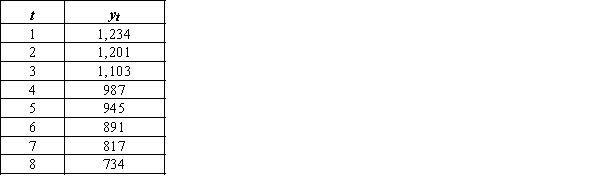
a. Construct a time series plot. What type of pattern exists in the data?
b. Use simple linear regression analysis to find the parameters for the line that minimizes MSE for this time series.
c. What is the forecast for t = 9?
a. Construct a time series plot. What type of pattern exists in the data?
b. Use simple linear regression analysis to find the parameters for the line that minimizes MSE for this time series.
c. What is the forecast for t = 9?
Question
The following data shows the quarterly profit (in thousands of dollars) made by a particular company in the past 3 years. 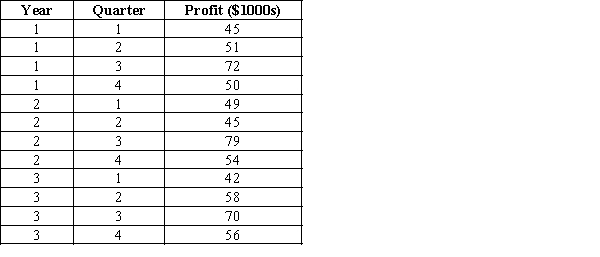
a. Use α = 0.3 to compute the exponential smoothing values for the time series. Compute MSE and the forecast of profit (in $1000s) for the next quarter.
b. Compare the three-period moving average forecast with the exponential smoothing forecast using α = 0.3. Which appears to provide the better forecast based on MSE?
Question
Consider the following time series data.  Using the average of all the historical data as a forecast for the next year, compute the following measures of forecast accuracy.
a. Mean absolute error
b. Mean squared error
c. Mean absolute percentage error
d. What is the forecast for year 11?
Using the average of all the historical data as a forecast for the next year, compute the following measures of forecast accuracy. a. Mean absolute error
b. Mean squared error
c. Mean absolute percentage error
d. What is the forecast for year 11?
Question
The below time series gives the indices of Industrial Production in U.S for 10 consecutive years. 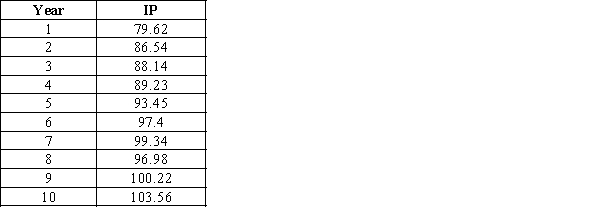
a. Construct a time series plot. What type of pattern exists in the data?
b. Use simple linear regression analysis to find the parameters for the line that minimizes MSE for this time series.
c. What is the forecast for t = 11?
a. Construct a time series plot. What type of pattern exists in the data?
b. Use simple linear regression analysis to find the parameters for the line that minimizes MSE for this time series.
c. What is the forecast for t = 11?
Question
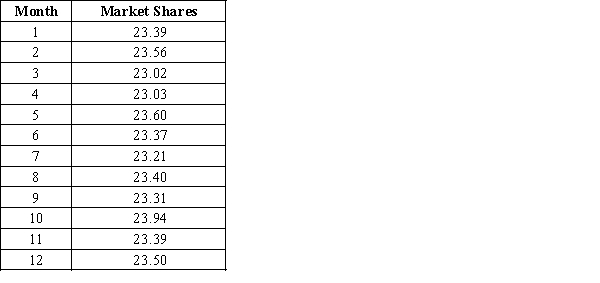
The monthly market shares of General Electric Company for 12 consecutive months follow. Develop three-month and four-month moving averages for this time series. Does the three-month or the four-month moving average provide the better forecasts based on MSE? Explain your reasoning.

Question
Question
Consider the following time series data. 
a. Construct a time series plot. What type of pattern exists in the data?
b. Develop a three-year moving average for this time series. Compute MSE and a forecast for the year 11.
a. Construct a time series plot. What type of pattern exists in the data?
b. Develop a three-year moving average for this time series. Compute MSE and a forecast for the year 11.
Question
The following times series shows the demand for a particular product over the past 10 months. 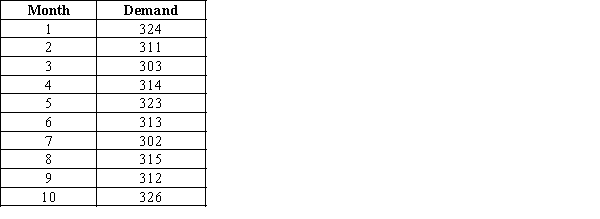
a. Construct a time series plot. What type of pattern exists in the data?
b. Develop a three-month moving average for this time series. Compute MSE and a forecast for month 11.
a. Construct a time series plot. What type of pattern exists in the data?
b. Develop a three-month moving average for this time series. Compute MSE and a forecast for month 11.
Question
Consider the following time series data: 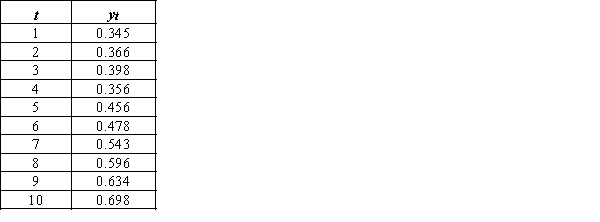
a. Construct a time series plot. What type of pattern exists in the data?
b. Use simple linear regression analysis to find the parameters for the line that minimizes MSE for this time series.
c. What is the forecast for t = 11?
a. Construct a time series plot. What type of pattern exists in the data?
b. Use simple linear regression analysis to find the parameters for the line that minimizes MSE for this time series.
c. What is the forecast for t = 11?
Question
The monthly sales (in hundreds of dollars) of a company are listed below. 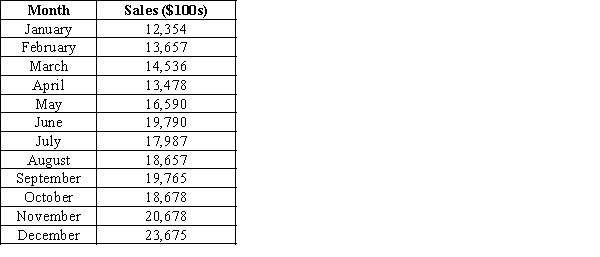
a. Construct a time series plot. What type of pattern exists in the data?
b. Use simple linear regression analysis to find the parameters for the line that minimizes MSE for this time series.
c. What is the sales forecast (in hundreds of dollars) for next month?
a. Construct a time series plot. What type of pattern exists in the data?
b. Use simple linear regression analysis to find the parameters for the line that minimizes MSE for this time series.
c. What is the sales forecast (in hundreds of dollars) for next month?
Question
Consider the following time series data. 
a. Use α = 0.2 to compute the exponential smoothing values for the time series. Compute MSE and a forecast for year 11.
b. Use trial and error to find a value of the exponential smoothing coefficient α (rounded to 2 decimal places) that results in a smaller MSE than what you calculated for α = 0.2.
c. Compute the forecast for year 11 using the smoothing coefficient α selected using trial error.
Question
The following times series shows the demand for a particular product over the past 10 months. 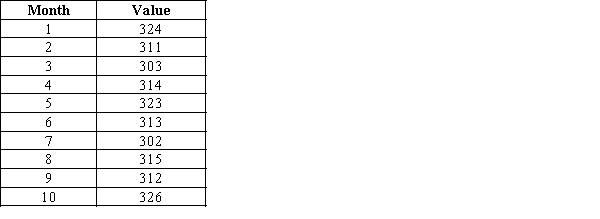
a. Use α = 0.2 to compute the exponential smoothing values for the time series. Compute MSE and a forecast for month 11.
b. Compare the three-month moving average forecast with the exponential smoothing forecast using α = 0.2. Which appears to provide the better forecast based on MSE?
a. Use α = 0.2 to compute the exponential smoothing values for the time series. Compute MSE and a forecast for month 11.
b. Compare the three-month moving average forecast with the exponential smoothing forecast using α = 0.2. Which appears to provide the better forecast based on MSE?
Question
The yearly sales (in millions of dollars) of an automobile manufacturing company during the period 2000-2011 are given below. 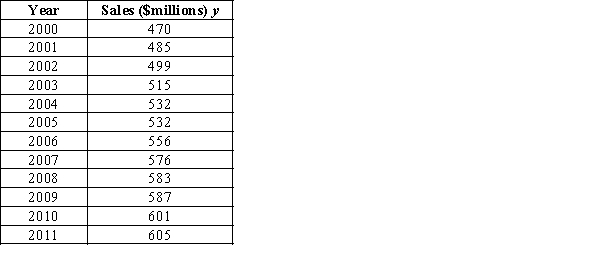
a. Construct a time series plot. What type of pattern exists in the data?
b. Use simple linear regression analysis to find the parameters for the line that minimizes MSE for this time series.
c. What is the sales forecast (in millions of dollars) for the year 2012?
a. Construct a time series plot. What type of pattern exists in the data?
b. Use simple linear regression analysis to find the parameters for the line that minimizes MSE for this time series.
c. What is the sales forecast (in millions of dollars) for the year 2012?
Question
The following data shows the quarterly profit (in thousands of dollars) made by a particular company in the past 3 years. 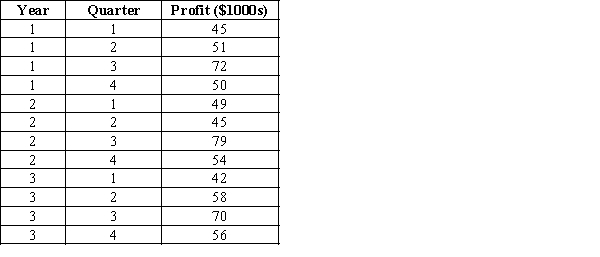
a. Construct a time series plot. What type of pattern exists in the data?
b. Develop a three-period moving average for this time series. Compute MSE and a forecast of profit (in $1000s) for the next quarter.
a. Construct a time series plot. What type of pattern exists in the data?
b. Develop a three-period moving average for this time series. Compute MSE and a forecast of profit (in $1000s) for the next quarter.
Question
The monthly sales revenue (in hundreds of dollars) of a company for one year is listed below. 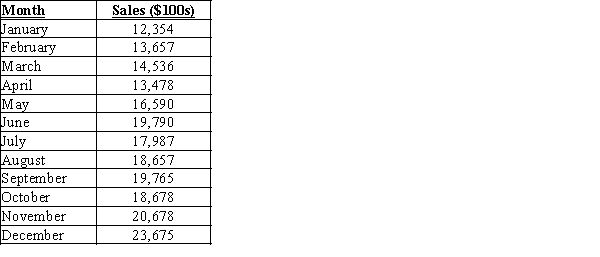
a. Compute MSE using the most recent value as the forecast for the next period. What is the forecast for the next month?
b. Compute MSE using the average of all the data available as the forecast for the next period. What is the forecast for the next month?
c. Which method appears to provide the better forecast?
Question
The following time series shows the sales of a particular commodity over the past 15 weeks. 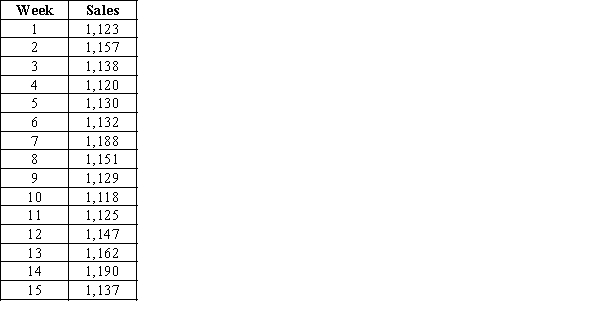
a. Construct a time series plot. What type of pattern exists in the data?
b. Use α = 0.3 to develop the exponential smoothing values for the time series and compute the forecast of demand for the next week.
c. Use trial and error to find a value of the exponential smoothing coefficient α that results in a relatively small MSE.
Question
The monthly market shares of General Electric Company for 12 consecutive months follow. Construct a time series plot. What type of pattern exists in the data?

Unlock Deck
Sign up to unlock the cards in this deck!
Unlock Deck
Unlock Deck
1/58
Play
Full screen (f)
Deck 8: Time Series Analysis and Forecasting
1
Which of the following is not present in a time series?
A)seasonality
B)operational variations
C)trend
D)cycles
A)seasonality
B)operational variations
C)trend
D)cycles
operational variations
2
A time series plot of a period of time (in years) verses sales (in thousands of dollars) is shown below Which of the following data patterns best describes the scenario shown?
A)Linear trend pattern
B)Nonlinear trend pattern
C)Seasonal pattern
D)Cyclical pattern
A)Linear trend pattern
B)Nonlinear trend pattern
C)Seasonal pattern
D)Cyclical pattern
Linear trend pattern
3
____________________ is the amount by which the predicted value differs from the observed value of the time series variable.
A)Mean forecast error
B)Mean absolute error
C)Smoothing constant
D)Forecast error
A)Mean forecast error
B)Mean absolute error
C)Smoothing constant
D)Forecast error
Forecast error
4
If a time series plot exhibits a horizontal pattern, then
A)it is evident that the time series is stationary.
B)the data fluctuates around the variable mean.
C)there is no relationship between time and the time series variable.
D)there is still not enough evidence to conclude that the time series is stationary.
A)it is evident that the time series is stationary.
B)the data fluctuates around the variable mean.
C)there is no relationship between time and the time series variable.
D)there is still not enough evidence to conclude that the time series is stationary.
Unlock Deck
Unlock for access to all 58 flashcards in this deck.
Unlock Deck
k this deck
5
Which of the following states the objective of time series analysis?
A)To predict the values of a time series based on one or more other variables.
B)To analyze the cause-and-effect relationship of a dependent variable with a time series and one or more other variables.
C)To use present variable values to study what should have been the ideal past values.
D)To uncover a pattern in a time series and then extrapolate the pattern into the future.
Unlock Deck
Unlock for access to all 58 flashcards in this deck.
Unlock Deck
k this deck
6
Which of the following is not true of a stationary time series?
A)The process generating the data has a constant mean.
B)The time series plot is a straight line.
C)The statistical properties are independent of time.
D)The variability is constant over time.
A)The process generating the data has a constant mean.
B)The time series plot is a straight line.
C)The statistical properties are independent of time.
D)The variability is constant over time.
Unlock Deck
Unlock for access to all 58 flashcards in this deck.
Unlock Deck
k this deck
7
A time series plot of a period of time period (quarterly) verses quarterly sales (in $1,000s) is shown below. Which of the following data patterns best describes the scenario shown?
A)Linear trend and cyclical pattern
B)Linear trend and horizontal pattern
C)Seasonal and cyclical patterns
D)Seasonal pattern and linear trend
A)Linear trend and cyclical pattern
B)Linear trend and horizontal pattern
C)Seasonal and cyclical patterns
D)Seasonal pattern and linear trend
Unlock Deck
Unlock for access to all 58 flashcards in this deck.
Unlock Deck
k this deck
8
A time series plot of a period of time (in months) verses sales (in number of units) is shown below. Which of the following data patterns best describes the scenario shown?
A)Linear trend pattern
B)Logarithmic trend
C)Exponential trend
D)Seasonal pattern
A)Linear trend pattern
B)Logarithmic trend
C)Exponential trend
D)Seasonal pattern
Unlock Deck
Unlock for access to all 58 flashcards in this deck.
Unlock Deck
k this deck
9
The mean absolute error, mean squared error, and mean absolute percentage error are all methods to measure the accuracy of a forecast.These methods measure forecast accuracy by
A)determining how well a particular forecasting method is able to reproduce the time series data that are already available.
B)using the current value to estimate how well the model generates previous values correctly.
C)predicting the future values and wait for a pre-defined time period to examine how accurate the predictions were.
D)adjusting the scale of the data.
Unlock Deck
Unlock for access to all 58 flashcards in this deck.
Unlock Deck
k this deck
10
Trend refers to
A)the long-run shift or movement in the time series observable over several periods of time.
B)the outcome of a random experiment.
C)the recurring patterns observed over successive periods of time.
D)the short-run shift or movement in the time series observable for some specific period of time.
A)the long-run shift or movement in the time series observable over several periods of time.
B)the outcome of a random experiment.
C)the recurring patterns observed over successive periods of time.
D)the short-run shift or movement in the time series observable for some specific period of time.
Unlock Deck
Unlock for access to all 58 flashcards in this deck.
Unlock Deck
k this deck
11
If the forecasted value of the time series variable for period 2 is 22.5 and the actual value observed for period 2 is 25, what is the forecast error in period 2?
A)3
B)2
C)2.5
D)-2.5
A)3
B)2
C)2.5
D)-2.5
Unlock Deck
Unlock for access to all 58 flashcards in this deck.
Unlock Deck
k this deck
12
Which is not true regarding trend patterns?
A)Can result when business conditions shift to a new level at some point in time.
B)Exist when there are gradual shifts of values over long periods of time.
C)Can result from factors such as improving technology or changes in consumer preferences.
D)Can represent non-linear relationships.
A)Can result when business conditions shift to a new level at some point in time.
B)Exist when there are gradual shifts of values over long periods of time.
C)Can result from factors such as improving technology or changes in consumer preferences.
D)Can represent non-linear relationships.
Unlock Deck
Unlock for access to all 58 flashcards in this deck.
Unlock Deck
k this deck
13
A time series plot of a period of time (in years) verses revenue (in millions of dollars) is shown below .Which of the following data patterns best describes the scenario shown?
A)Linear trend pattern
B)Nonlinear trend pattern
C)Seasonal pattern
D)Cyclical pattern
A)Linear trend pattern
B)Nonlinear trend pattern
C)Seasonal pattern
D)Cyclical pattern
Unlock Deck
Unlock for access to all 58 flashcards in this deck.
Unlock Deck
k this deck
14
A set of observations on a variable measured at successive points in time or over successive periods of time constitute a
A)geometric series.
B)time invariant set.
C)time series.
D)logarithmic series.
A)geometric series.
B)time invariant set.
C)time series.
D)logarithmic series.
Unlock Deck
Unlock for access to all 58 flashcards in this deck.
Unlock Deck
k this deck
15
A time series that shows a recurring pattern over one year or less is said to follow a
A)horizontal pattern.
B)stationary pattern.
C)cyclical pattern.
D)seasonal pattern.
A)horizontal pattern.
B)stationary pattern.
C)cyclical pattern.
D)seasonal pattern.
Unlock Deck
Unlock for access to all 58 flashcards in this deck.
Unlock Deck
k this deck
16
A time series plot of a period of time (in weeks) verses sales (in 1,000's of gallons) is shown below. Which of the following data patterns best describes the scenario shown?
A)Time series with a linear trend pattern
B)Time series with a nonlinear trend pattern
C)Time series with no pattern
D)Time series with a horizontal pattern
A)Time series with a linear trend pattern
B)Time series with a nonlinear trend pattern
C)Time series with no pattern
D)Time series with a horizontal pattern
Unlock Deck
Unlock for access to all 58 flashcards in this deck.
Unlock Deck
k this deck
17
An exponential trend pattern occurs when
A)the amount of increase between periods in the value of the variable is constant.
B)the percentage change between periods in the value of the variable is relatively constant.
C)there is a no relationship between the time series variable and time.
D)there are random fluctuations in the variable value with time.
Unlock Deck
Unlock for access to all 58 flashcards in this deck.
Unlock Deck
k this deck
18
A forecast is defined as a(n)
A)prediction of future values of a time series.
B)quantitative method used when historical data on the variable of interest are either unavailable or not applicable.
C)set of observations on a variable measured at successive points in time.
D)outcome of a random experiment.
A)prediction of future values of a time series.
B)quantitative method used when historical data on the variable of interest are either unavailable or not applicable.
C)set of observations on a variable measured at successive points in time.
D)outcome of a random experiment.
Unlock Deck
Unlock for access to all 58 flashcards in this deck.
Unlock Deck
k this deck
19
With reference to time series data patterns, a cyclical pattern is the component of the time series that
A)shows a periodic pattern lasting one year or less.
B)does not vary with respect to time.
C)shows a periodic pattern lasting more than one year.
D)is characterized by a linear variation of the dependent variable with respect to time.
A)shows a periodic pattern lasting one year or less.
B)does not vary with respect to time.
C)shows a periodic pattern lasting more than one year.
D)is characterized by a linear variation of the dependent variable with respect to time.
Unlock Deck
Unlock for access to all 58 flashcards in this deck.
Unlock Deck
k this deck
20
Forecast error
A)takes a positive value when the forecast is too high.
B)cannot be negative.
C)cannot be zero.
D)is associated with measuring forecast accuracy.
A)takes a positive value when the forecast is too high.
B)cannot be negative.
C)cannot be zero.
D)is associated with measuring forecast accuracy.
Unlock Deck
Unlock for access to all 58 flashcards in this deck.
Unlock Deck
k this deck
21
Suppose for a particular week, the forecasted sales were $4,000. The actual sales were $3,000. What is the value of the mean absolute percentage error?
A)-33.3%
B)-25%
C)25%
D)33.3%
A)-33.3%
B)-25%
C)25%
D)33.3%
Unlock Deck
Unlock for access to all 58 flashcards in this deck.
Unlock Deck
k this deck
22
Demand for a product and the forecasting department's forecast (naïve model) for a product are shown below. Compute the mean squared error. ?
?
A)3.33
B)4.67
C)5.33
D)6.67
?
A)3.33
B)4.67
C)5.33
D)6.67
Unlock Deck
Unlock for access to all 58 flashcards in this deck.
Unlock Deck
k this deck
23
Using a large value for order k in the moving averages method is effective in
A)tracking changes in a time series more quickly.
B)smoothing out random fluctuations.
C)providing a forecast when only the most recent time series are relevant.
D)eliminating the effect of seasonal variations in the time series.
A)tracking changes in a time series more quickly.
B)smoothing out random fluctuations.
C)providing a forecast when only the most recent time series are relevant.
D)eliminating the effect of seasonal variations in the time series.
Unlock Deck
Unlock for access to all 58 flashcards in this deck.
Unlock Deck
k this deck
24
Demand for a product and the forecasting department's forecast (naïve model) for a product are shown below. Compute the mean absolute error. ?
?
A)1
B)1.5
C)2
D)2.5
?
A)1
B)1.5
C)2
D)2.5
Unlock Deck
Unlock for access to all 58 flashcards in this deck.
Unlock Deck
k this deck
25
Autoregressive models
A)use the average of the most recent data values in the time series as the forecast for the next period.
B)are used to smooth out random fluctuations in time series.
C)relate a time series to other variables that are believed to explain or cause its behavior.
D)occur whenever all the independent variables are previous values of the time series.
Unlock Deck
Unlock for access to all 58 flashcards in this deck.
Unlock Deck
k this deck
26
______________________ uses a weighted average of past time series values as the forecast.
A)The qualitative method
B)Exponential smoothing
C)Correlation analysis
D)The causal model
A)The qualitative method
B)Exponential smoothing
C)Correlation analysis
D)The causal model
Unlock Deck
Unlock for access to all 58 flashcards in this deck.
Unlock Deck
k this deck
27
Which of the following is true of the exponential smoothing coefficient?
A)It is a randomly generated value between -1 and +1.
B)It is small for a time series that has relatively little random variability.
C)It is chosen as the value that minimizes a selected measure of forecast accuracy such as the mean squared error.
D)It is computed in relation with the order value, k, for the moving averages.
Unlock Deck
Unlock for access to all 58 flashcards in this deck.
Unlock Deck
k this deck
28
The process of ____________ might be used to determine the value of smoothing constant that minimizes the mean squared error.
A)quantization
B)nonlinear optimization
C)clustering
D)curve fitting
A)quantization
B)nonlinear optimization
C)clustering
D)curve fitting
Unlock Deck
Unlock for access to all 58 flashcards in this deck.
Unlock Deck
k this deck
29
Which of the following measures of forecast accuracy is susceptible to the problem of positive and negative forecast errors offsetting one another?
A)Mean absolute error
B)Mean forecast error
C)Mean squared error
D)Mean absolute percentage error
A)Mean absolute error
B)Mean forecast error
C)Mean squared error
D)Mean absolute percentage error
Unlock Deck
Unlock for access to all 58 flashcards in this deck.
Unlock Deck
k this deck
30
In the moving averages method, the order k determines the
A)error tolerance.
B)compensation for forecasting error.
C)number of time series values under consideration.
D)number of samples in each unit time period.
A)error tolerance.
B)compensation for forecasting error.
C)number of time series values under consideration.
D)number of samples in each unit time period.
Unlock Deck
Unlock for access to all 58 flashcards in this deck.
Unlock Deck
k this deck
31
The moving averages and exponential smoothing methods are appropriate for a time series exhibiting
A)a horizontal pattern.
B)a cyclical pattern.
C)trends.
D)seasonal effects.
A)a horizontal pattern.
B)a cyclical pattern.
C)trends.
D)seasonal effects.
Unlock Deck
Unlock for access to all 58 flashcards in this deck.
Unlock Deck
k this deck
32
A time series with a seasonal pattern can be modeled by treating the season as a
A)predictor variable.
B)dependent variable.
C)dummy variable.
D)quantitative variable.
A)predictor variable.
B)dependent variable.
C)dummy variable.
D)quantitative variable.
Unlock Deck
Unlock for access to all 58 flashcards in this deck.
Unlock Deck
k this deck
33
The moving averages method refers to a forecasting method that
A)is used when considerable trend, cyclical, or seasonal effects are present.
B)uses regression relationship based on past time series values to predict the future time series values.
C)relates a time series to other variables that are believed to explain or cause its behavior.
D)uses the average of the most recent data values in the time series as the forecast for the next period.
Unlock Deck
Unlock for access to all 58 flashcards in this deck.
Unlock Deck
k this deck
34
Which of the following statements is the objective of the moving averages and exponential smoothing methods?
A)To maximize forecast accuracy measures
B)To smooth out random fluctuations in the time series
C)To characterize the variable fluctuations by an exponential equation
D)To transform a nonstationary time series into a stationary series
A)To maximize forecast accuracy measures
B)To smooth out random fluctuations in the time series
C)To characterize the variable fluctuations by an exponential equation
D)To transform a nonstationary time series into a stationary series
Unlock Deck
Unlock for access to all 58 flashcards in this deck.
Unlock Deck
k this deck
35
The exponential smoothing forecast for period t + 1 is a weighted average of the
A)forecast value in period t with weight α and the actual value for period t with weight 1 - α.
B)actual value in period t + 1 with weight α and the forecast for period t with weight 1 - α.
C)forecast value in period t - 1 with weight α and the forecast for period t with weight 1 - α.
D)actual value in period t with weight α and the forecast for period t with weight 1 - α.
Unlock Deck
Unlock for access to all 58 flashcards in this deck.
Unlock Deck
k this deck
36
The value of an independent variable from the prior period is referred to as a
A)lagged variable.
B)dummy variable.
C)predictor variable.
D)categorical variable.
A)lagged variable.
B)dummy variable.
C)predictor variable.
D)categorical variable.
Unlock Deck
Unlock for access to all 58 flashcards in this deck.
Unlock Deck
k this deck
37
A causal model provides evidence of ______________ between an independent variable and the variable to be forecast.
A)a causal relationship
B)an association
C)no relationship
D)a seasonal relationship
A)a causal relationship
B)an association
C)no relationship
D)a seasonal relationship
Unlock Deck
Unlock for access to all 58 flashcards in this deck.
Unlock Deck
k this deck
38
A positive forecast error indicates that the forecasting method ________ the dependent variable.
A)overestimated
B)underestimated
C)accurately estimated
D)closely approximated
A)overestimated
B)underestimated
C)accurately estimated
D)closely approximated
Unlock Deck
Unlock for access to all 58 flashcards in this deck.
Unlock Deck
k this deck
39
With reference to exponential forecasting models, a parameter that provides the weight given to the most recent time series value in the calculation of the forecast value is known as the
A)moving average.
B)regression coefficient.
C)smoothing constant.
D)mean forecast error.
A)moving average.
B)regression coefficient.
C)smoothing constant.
D)mean forecast error.
Unlock Deck
Unlock for access to all 58 flashcards in this deck.
Unlock Deck
k this deck
40
Causal models
A)provide evidence of a causal relationship between an independent variable and the variable to be forecast.
B)use the average of the most recent data values in the time series as the forecast for the next period.
C)occur whenever all the independent variables are previous values of the same time series.
D)relate a time series to other variables that are believed to explain or cause its behavior.
Unlock Deck
Unlock for access to all 58 flashcards in this deck.
Unlock Deck
k this deck
41
Consider the following time series data. Using the naïve method (most recent value) as the forecast for the next year, compute the following measures of forecast accuracy.
a. Mean absolute error
b. Mean squared error
c. Mean absolute percentage error
d. What is the forecast for year 11?
Using the naïve method (most recent value) as the forecast for the next year, compute the following measures of forecast accuracy. a. Mean absolute error
b. Mean squared error
c. Mean absolute percentage error
d. What is the forecast for year 11?
Unlock Deck
Unlock for access to all 58 flashcards in this deck.
Unlock Deck
k this deck
42
Consider the following time series.
a. Construct a time series plot. What type of pattern exists in the data?
b. Use simple linear regression analysis to find the parameters for the line that minimizes MSE for this time series.
c. What is the forecast for t = 9?
a. Construct a time series plot. What type of pattern exists in the data?
b. Use simple linear regression analysis to find the parameters for the line that minimizes MSE for this time series.
c. What is the forecast for t = 9?
Unlock Deck
Unlock for access to all 58 flashcards in this deck.
Unlock Deck
k this deck
43
The following data shows the quarterly profit (in thousands of dollars) made by a particular company in the past 3 years.
a. Use α = 0.3 to compute the exponential smoothing values for the time series. Compute MSE and the forecast of profit (in $1000s) for the next quarter.
b. Compare the three-period moving average forecast with the exponential smoothing forecast using α = 0.3. Which appears to provide the better forecast based on MSE?
Unlock Deck
Unlock for access to all 58 flashcards in this deck.
Unlock Deck
k this deck
44
Consider the following time series data. Using the average of all the historical data as a forecast for the next year, compute the following measures of forecast accuracy.
a. Mean absolute error
b. Mean squared error
c. Mean absolute percentage error
d. What is the forecast for year 11?
Using the average of all the historical data as a forecast for the next year, compute the following measures of forecast accuracy. a. Mean absolute error
b. Mean squared error
c. Mean absolute percentage error
d. What is the forecast for year 11?
Unlock Deck
Unlock for access to all 58 flashcards in this deck.
Unlock Deck
k this deck
45
The below time series gives the indices of Industrial Production in U.S for 10 consecutive years.
a. Construct a time series plot. What type of pattern exists in the data?
b. Use simple linear regression analysis to find the parameters for the line that minimizes MSE for this time series.
c. What is the forecast for t = 11?
a. Construct a time series plot. What type of pattern exists in the data?
b. Use simple linear regression analysis to find the parameters for the line that minimizes MSE for this time series.
c. What is the forecast for t = 11?
Unlock Deck
Unlock for access to all 58 flashcards in this deck.
Unlock Deck
k this deck
46
The monthly market shares of General Electric Company for 12 consecutive months follow. Develop three-month and four-month moving averages for this time series. Does the three-month or the four-month moving average provide the better forecasts based on MSE? Explain your reasoning.
Unlock Deck
Unlock for access to all 58 flashcards in this deck.
Unlock Deck
k this deck
47
For causal modeling, _______________ are used to detect linear or nonlinear relationships between the independent and dependent variables.
A)descriptive statistics on the data
B)scatter charts
C)contingency tables
D)pie charts
A)descriptive statistics on the data
B)scatter charts
C)contingency tables
D)pie charts
Unlock Deck
Unlock for access to all 58 flashcards in this deck.
Unlock Deck
k this deck
48
Consider the following time series data.
a. Construct a time series plot. What type of pattern exists in the data?
b. Develop a three-year moving average for this time series. Compute MSE and a forecast for the year 11.
a. Construct a time series plot. What type of pattern exists in the data?
b. Develop a three-year moving average for this time series. Compute MSE and a forecast for the year 11.
Unlock Deck
Unlock for access to all 58 flashcards in this deck.
Unlock Deck
k this deck
49
The following times series shows the demand for a particular product over the past 10 months.
a. Construct a time series plot. What type of pattern exists in the data?
b. Develop a three-month moving average for this time series. Compute MSE and a forecast for month 11.
a. Construct a time series plot. What type of pattern exists in the data?
b. Develop a three-month moving average for this time series. Compute MSE and a forecast for month 11.
Unlock Deck
Unlock for access to all 58 flashcards in this deck.
Unlock Deck
k this deck
50
Consider the following time series data:
a. Construct a time series plot. What type of pattern exists in the data?
b. Use simple linear regression analysis to find the parameters for the line that minimizes MSE for this time series.
c. What is the forecast for t = 11?
a. Construct a time series plot. What type of pattern exists in the data?
b. Use simple linear regression analysis to find the parameters for the line that minimizes MSE for this time series.
c. What is the forecast for t = 11?
Unlock Deck
Unlock for access to all 58 flashcards in this deck.
Unlock Deck
k this deck
51
The monthly sales (in hundreds of dollars) of a company are listed below.
a. Construct a time series plot. What type of pattern exists in the data?
b. Use simple linear regression analysis to find the parameters for the line that minimizes MSE for this time series.
c. What is the sales forecast (in hundreds of dollars) for next month?
a. Construct a time series plot. What type of pattern exists in the data?
b. Use simple linear regression analysis to find the parameters for the line that minimizes MSE for this time series.
c. What is the sales forecast (in hundreds of dollars) for next month?
Unlock Deck
Unlock for access to all 58 flashcards in this deck.
Unlock Deck
k this deck
52
Consider the following time series data.
a. Use α = 0.2 to compute the exponential smoothing values for the time series. Compute MSE and a forecast for year 11.
b. Use trial and error to find a value of the exponential smoothing coefficient α (rounded to 2 decimal places) that results in a smaller MSE than what you calculated for α = 0.2.
c. Compute the forecast for year 11 using the smoothing coefficient α selected using trial error.
Unlock Deck
Unlock for access to all 58 flashcards in this deck.
Unlock Deck
k this deck
53
The following times series shows the demand for a particular product over the past 10 months.
a. Use α = 0.2 to compute the exponential smoothing values for the time series. Compute MSE and a forecast for month 11.
b. Compare the three-month moving average forecast with the exponential smoothing forecast using α = 0.2. Which appears to provide the better forecast based on MSE?
a. Use α = 0.2 to compute the exponential smoothing values for the time series. Compute MSE and a forecast for month 11.
b. Compare the three-month moving average forecast with the exponential smoothing forecast using α = 0.2. Which appears to provide the better forecast based on MSE?
Unlock Deck
Unlock for access to all 58 flashcards in this deck.
Unlock Deck
k this deck
54
The yearly sales (in millions of dollars) of an automobile manufacturing company during the period 2000-2011 are given below.
a. Construct a time series plot. What type of pattern exists in the data?
b. Use simple linear regression analysis to find the parameters for the line that minimizes MSE for this time series.
c. What is the sales forecast (in millions of dollars) for the year 2012?
a. Construct a time series plot. What type of pattern exists in the data?
b. Use simple linear regression analysis to find the parameters for the line that minimizes MSE for this time series.
c. What is the sales forecast (in millions of dollars) for the year 2012?
Unlock Deck
Unlock for access to all 58 flashcards in this deck.
Unlock Deck
k this deck
55
The following data shows the quarterly profit (in thousands of dollars) made by a particular company in the past 3 years.
a. Construct a time series plot. What type of pattern exists in the data?
b. Develop a three-period moving average for this time series. Compute MSE and a forecast of profit (in $1000s) for the next quarter.
a. Construct a time series plot. What type of pattern exists in the data?
b. Develop a three-period moving average for this time series. Compute MSE and a forecast of profit (in $1000s) for the next quarter.
Unlock Deck
Unlock for access to all 58 flashcards in this deck.
Unlock Deck
k this deck
56
The monthly sales revenue (in hundreds of dollars) of a company for one year is listed below.
a. Compute MSE using the most recent value as the forecast for the next period. What is the forecast for the next month?
b. Compute MSE using the average of all the data available as the forecast for the next period. What is the forecast for the next month?
c. Which method appears to provide the better forecast?
Unlock Deck
Unlock for access to all 58 flashcards in this deck.
Unlock Deck
k this deck
57
The following time series shows the sales of a particular commodity over the past 15 weeks.
a. Construct a time series plot. What type of pattern exists in the data?
b. Use α = 0.3 to develop the exponential smoothing values for the time series and compute the forecast of demand for the next week.
c. Use trial and error to find a value of the exponential smoothing coefficient α that results in a relatively small MSE.
Unlock Deck
Unlock for access to all 58 flashcards in this deck.
Unlock Deck
k this deck
58
The monthly market shares of General Electric Company for 12 consecutive months follow. Construct a time series plot. What type of pattern exists in the data?
Unlock Deck
Unlock for access to all 58 flashcards in this deck.
Unlock Deck
k this deck
Unlock Deck
Unlock for access to all 58 flashcards in this deck.


