Exam 8: Time Series Analysis and Forecasting
Exam 1: Introduction49 Questions
Exam 2: Descriptive Statistics84 Questions
Exam 3: Data Visualization69 Questions
Exam 4: Descriptive Data Mining56 Questions
Exam 5: Probability: an Introduction to Modeling Uncertainty62 Questions
Exam 6: Statistical Inference62 Questions
Exam 7: Linear Regression71 Questions
Exam 8: Time Series Analysis and Forecasting58 Questions
Exam 9: Predictive Data Mining40 Questions
Exam 10: Spreadsheet Models64 Questions
Exam 11: Linear Optimization Models58 Questions
Exam 12: Integer Linear Optimization Models56 Questions
Exam 13: Nonlinear Optimization Models55 Questions
Exam 14: Monte Carlo Simulation59 Questions
Exam 15: Decision Analysis58 Questions
Select questions type
Demand for a product and the forecasting department's forecast (naïve model) for a product are shown below. Compute the mean absolute error. ?
? Period Actual Demand Forecasted Demand 1 12 - 2 15 12 3 14 15 4 18 16
Free
(Multiple Choice)
4.9/5  (34)
(34)
Correct Answer: Verified
C
Consider the following time series data. Year Value 1 234 2 287 3 255 4 310 5 298 6 250 7 302 8 267 9 225 10 336
a. Use α = 0.2 to compute the exponential smoothing values for the time series. Compute MSE and a forecast for year 11.
b. Use trial and error to find a value of the exponential smoothing coefficient α (rounded to 2 decimal places) that results in a smaller MSE than what you calculated for α = 0.2.
c. Compute the forecast for year 11 using the smoothing coefficient α selected using trial error.
Free
(Essay)
4.8/5 (39)
Correct Answer:Verified
a. Smoothing constant α = 0.2 MSE = 17,837.58/9 = 1,981.95
The forecast for year 11 is = αy10 + (1- α) = (0.2)(336) + (1 - 0.2)(261.37) = 276.30.
b. Several values of α will yield an MSE smaller than the MSE associated with α = 0.2. The table below shows the resulting MSE from several different α. The value of α that yields the minimum MSE is α = 0.29, which yields an MSE of 1928.08. =0.29
MSE = 17,352.74/9 = 1,928.08
The forecast for year 11 is = αy10 + (1- α) = (0.29)(336) + (1 - 0.29)260.66 = 282.51.
An exponential trend pattern occurs when
Free
(Multiple Choice)
4.9/5 (38)
Correct Answer:Verified
B
The following times series shows the demand for a particular product over the past 10 months. Month Demand 1 324 2 311 3 303 4 314 5 323 6 313 7 302 8 315 9 312 10 326
a. Construct a time series plot. What type of pattern exists in the data?
b. Develop a three-month moving average for this time series. Compute MSE and a forecast for month 11.
(Essay)
4.8/5 (32)
The monthly market shares of General Electric Company for 12 consecutive months follow. Develop three-month and four-month moving averages for this time series. Does the three-month or the four-month moving average provide the better forecasts based on MSE? Explain your reasoning.
Month Market Shares 1 23.39 2 23.56 3 23.02 4 23.03 5 23.60 6 23.37 7 23.21 8 23.40 9 23.31 10 23.94 11 23.39 12 23.50
(Essay)
4.8/5 (38)
A time series plot of a period of time (in months) verses sales (in number of units) is shown below. Which of the following data patterns best describes the scenario shown? 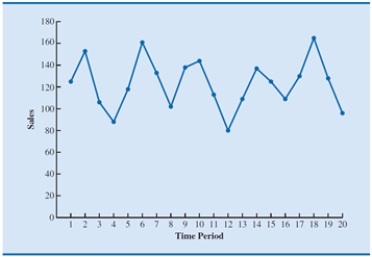
(Multiple Choice)
4.9/5 (33)
The following data shows the quarterly profit (in thousands of dollars) made by a particular company in the past 3 years. Year Quarter Profit ( \1 000s) 1 1 45 1 2 51 1 3 72 1 4 50 2 1 49 2 2 45 2 3 79 2 4 54 3 1 42 3 2 58 3 3 70 3 4 56
a. Construct a time series plot. What type of pattern exists in the data?
b. Develop a three-period moving average for this time series. Compute MSE and a forecast of profit (in $1000s) for the next quarter.
(Essay)
4.8/5 (33)
A time series with a seasonal pattern can be modeled by treating the season as a
(Multiple Choice)
4.9/5 (27)
A time series plot of a period of time (in weeks) verses sales (in 1,000's of gallons) is shown below. Which of the following data patterns best describes the scenario shown? 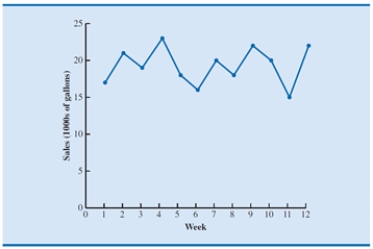
(Multiple Choice)
4.8/5 (37)
Which of the following states the objective of time series analysis?
(Multiple Choice)
4.8/5 (33)
The moving averages and exponential smoothing methods are appropriate for a time series exhibiting
(Multiple Choice)
4.9/5 (38)
If the forecasted value of the time series variable for period 2 is 22.5 and the actual value observed for period 2 is 25, what is the forecast error in period 2?
(Multiple Choice)
4.7/5 (28)
Consider the following time series. 1 1,234 2 1,201 3 1,103 4 987 5 945 6 891 7 817 8 734
a. Construct a time series plot. What type of pattern exists in the data?
b. Use simple linear regression analysis to find the parameters for the line that minimizes MSE for this time series.
c. What is the forecast for t = 9?
(Essay)
4.8/5 (43)
Consider the following time series data: 1 0.345 2 0.366 3 0.398 4 0.356 5 0.456 6 0.478 7 0.543 8 0.596 9 0.634 10 0.698
a. Construct a time series plot. What type of pattern exists in the data?
b. Use simple linear regression analysis to find the parameters for the line that minimizes MSE for this time series.
c. What is the forecast for t = 11?
(Essay)
4.9/5 (37)
The exponential smoothing forecast for period t + 1 is a weighted average of the
(Multiple Choice)
4.8/5 (39)
Consider the following time series data. Year Value 1 234 2 287 3 255 4 310 5 298 6 250 7 456 8 412 9 525 10 436 Using the average of all the historical data as a forecast for the next year, compute the following measures of forecast accuracy.
a. Mean absolute error
b. Mean squared error
c. Mean absolute percentage error
d. What is the forecast for year 11?
(Essay)
4.7/5 (34)
Which of the following measures of forecast accuracy is susceptible to the problem of positive and negative forecast errors offsetting one another?
(Multiple Choice)
4.8/5 (42)
A causal model provides evidence of ______________ between an independent variable and the variable to be forecast.
(Multiple Choice)
4.9/5 (33)
Filters
- Essay(0)
- Multiple Choice(0)
- Short Answer(0)
- True False(0)
- Matching(0)