Deck 18: Standard Costing and Variance Analysis 2: Further Aspects
Full screen (f)
Question
Question
Question
Question
Question
Question
Question
Question
Question
Question
Question
Davis Industries' activity-based performance report revealed that actual inspection costs totaled £225,000 at an actual activity level of 80 inspections. Further analysis of inspection costs revealed the following: 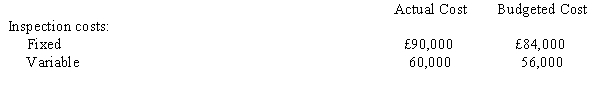 Fixed inspection costs consist of the salaries of four inspectors, paid £21,000 each. Each inspector is capable of efficiently conducting inspections of 50 batches. Variable inspection costs consist of materials used during the inspections.
a.Calculate the following fixed activity budget variances for inspection:Total fixed activity varianceFixed spending varianceVolume varianceUnused capacity variance
b.Calculate the following variable activity budget variances for inspection:Spending varianceEfficiency variance
Fixed inspection costs consist of the salaries of four inspectors, paid £21,000 each. Each inspector is capable of efficiently conducting inspections of 50 batches. Variable inspection costs consist of materials used during the inspections. a.Calculate the following fixed activity budget variances for inspection:Total fixed activity varianceFixed spending varianceVolume varianceUnused capacity variance
b.Calculate the following variable activity budget variances for inspection:Spending varianceEfficiency variance
Question

Unlock Deck
Sign up to unlock the cards in this deck!
Unlock Deck
Unlock Deck
1/12
Play
Full screen (f)
Deck 18: Standard Costing and Variance Analysis 2: Further Aspects
1
Figure 18-2
Allende Company has developed capacity standards. Information is as follows for a value-added activity:
-Refer to Figure 18-2. The unused capacity variance is
A)£20,000 favourable.
B)£40,000 favourable.
C)£60,000 favourable.
D)There is no variance.
Allende Company has developed capacity standards. Information is as follows for a value-added activity:
-Refer to Figure 18-2. The unused capacity variance is
A)£20,000 favourable.
B)£40,000 favourable.
C)£60,000 favourable.
D)There is no variance.
£60,000 favourable.
2
Figure 18-1
Froelech Company has developed capacity standards. Information is as follows:
-Refer to Figure 18-1. The unused capacity variance is
A)£20,000 favourable.
B)£30,000 favourable.
C)£50,000 favourable.
D)There is no variance.
Froelech Company has developed capacity standards. Information is as follows:
-Refer to Figure 18-1. The unused capacity variance is
A)£20,000 favourable.
B)£30,000 favourable.
C)£50,000 favourable.
D)There is no variance.
£30,000 favourable.
3
When should variances be investigated?
A)when they fall out of the accepted range or the control limit
B)when the variances are unfavourable
C)when the variances are over £10,000
D)All variances should be investigated.
A)when they fall out of the accepted range or the control limit
B)when the variances are unfavourable
C)when the variances are over £10,000
D)All variances should be investigated.
when they fall out of the accepted range or the control limit
4
Figure 18-4
Regis Ltd. uses two materials in the production of its product. The materials, X and Y, have the following standards: During April, the following actual production information was provided:
-Refer to Figure 18-4. What is the materials yield variance?
A)£4,000 (F)
B)£8,000 (F)
C)£8,000 (U)
D)£9,000 (U)
Unlock Deck
Unlock for access to all 12 flashcards in this deck.
Unlock Deck
k this deck
5
Roberts Company uses a standard costing system. The following information pertains to direct materials for the month of July: Roberts Company reports its material price variances at the time of purchase. What is the journal entry to record material purchases?
a.
b.
c.
d.
a.
b.
c.
d.
Unlock Deck
Unlock for access to all 12 flashcards in this deck.
Unlock Deck
k this deck
6
Figure 18-4
Regis Ltd. uses two materials in the production of its product. The materials, X and Y, have the following standards: During April, the following actual production information was provided:
-Refer to Figure 18-4. What is the materials mix variance?
A)£5,000 (F)
B)£10,000 (U)
C)£10,000 (F)
D)£15,000 (F)
Unlock Deck
Unlock for access to all 12 flashcards in this deck.
Unlock Deck
k this deck
7
Figure 18-4
Regis Ltd. uses two materials in the production of its product. The materials, X and Y, have the following standards: During April, the following actual production information was provided:
-Refer to Figure 18-4. What is the materials usage variance?
A)£10,000 (U)
B)£ 8,000 (U)
C)£ 8,000 (F)
D)£18,000 (U)
Unlock Deck
Unlock for access to all 12 flashcards in this deck.
Unlock Deck
k this deck
8
Laune Co.'s standard cost is £200,000, and its allowable deviation is £20,000. Laune's upper and lower control limits are
A)£220,000 and £200,000.
B)£200,000 and £180,000.
C)£220,000 and £180,000.
D)£210,000 and £190,000.
A)£220,000 and £200,000.
B)£200,000 and £180,000.
C)£220,000 and £180,000.
D)£210,000 and £190,000.
Unlock Deck
Unlock for access to all 12 flashcards in this deck.
Unlock Deck
k this deck
9
Figure 18-3
Pippen Company's activity-based performance report revealed that actual inspection costs totaled £100,000 at an actual activity level of 50 inspections. Further analysis of inspection costs revealed the following: Fixed inspection costs consist of the salaries of two inspectors, who are paid £14,250. Each inspector is capable of efficiently conducting inspections of 30 batches.
Variable inspection costs consist of materials used during the inspections.
-Refer to Figure 18-3. The fixed spending variance is
A)£1,500 U.
B)£1,500 F.
C)£2,100 U.
D)£2,100 F.
Unlock Deck
Unlock for access to all 12 flashcards in this deck.
Unlock Deck
k this deck
10
Figure 18-1
Froelech Company has developed capacity standards. Information is as follows:
-Refer to Figure 18-1. The volume variance is
A)£20,000 unfavourable.
B)£30,000 unfavourable.
C)£50,000 unfavourable.
D)There is no variance.
Froelech Company has developed capacity standards. Information is as follows:
-Refer to Figure 18-1. The volume variance is
A)£20,000 unfavourable.
B)£30,000 unfavourable.
C)£50,000 unfavourable.
D)There is no variance.
Unlock Deck
Unlock for access to all 12 flashcards in this deck.
Unlock Deck
k this deck
11
Davis Industries' activity-based performance report revealed that actual inspection costs totaled £225,000 at an actual activity level of 80 inspections. Further analysis of inspection costs revealed the following: Fixed inspection costs consist of the salaries of four inspectors, paid £21,000 each. Each inspector is capable of efficiently conducting inspections of 50 batches. Variable inspection costs consist of materials used during the inspections.
a.Calculate the following fixed activity budget variances for inspection:Total fixed activity varianceFixed spending varianceVolume varianceUnused capacity variance
b.Calculate the following variable activity budget variances for inspection:Spending varianceEfficiency variance
Fixed inspection costs consist of the salaries of four inspectors, paid £21,000 each. Each inspector is capable of efficiently conducting inspections of 50 batches. Variable inspection costs consist of materials used during the inspections. a.Calculate the following fixed activity budget variances for inspection:Total fixed activity varianceFixed spending varianceVolume varianceUnused capacity variance
b.Calculate the following variable activity budget variances for inspection:Spending varianceEfficiency variance
Unlock Deck
Unlock for access to all 12 flashcards in this deck.
Unlock Deck
k this deck
12
Figure 18-3
Pippen Company's activity-based performance report revealed that actual inspection costs totaled £100,000 at an actual activity level of 50 inspections. Further analysis of inspection costs revealed the following: Fixed inspection costs consist of the salaries of two inspectors, who are paid £14,250. Each inspector is capable of efficiently conducting inspections of 30 batches.
Variable inspection costs consist of materials used during the inspections.
-Refer to Figure 18-3. The volume variance is
A)£26,250 U.
B)£26,250 F.
C)£28,500 U.
D)£28,500 F.
Unlock Deck
Unlock for access to all 12 flashcards in this deck.
Unlock Deck
k this deck
Unlock Deck
Unlock for access to all 12 flashcards in this deck.


