Deck 11: Inferences About Population Variances
Full screen (f)
Question
Question
Question
Question
Question
Question
Question
Question
Question
Question
Question
Question
Question
Which of the following has an F distribution?
A) (n - 1)s/σ.
B) s1/s2.
C) (n - 1)s1/s2.
D) .
.
A) (n - 1)s/σ.
B) s1/s2.
C) (n - 1)s1/s2.
D)
. Question
Question
Question
Question
Question
Question
Question
Question
Question
Question
Question
Question
Question
Question
Question
Question
Question
Question
Question
Question
Question
Question
Question
Question
Question
Question
Question
Question
Consider the following hypothesis problem.  The test statistic has a value of
A) 20.91.
B) 24.20.
C) 24.00.
D) 20.00.
The test statistic has a value ofA) 20.91.
B) 24.20.
C) 24.00.
D) 20.00.
Question
Consider the following hypothesis problem. 
If the test is to be performed at the 5% level, the critical value(s) from the chi-square distribution table is(are)
A) 10.982 and 36.781.
B) 12.338 and 33.924.
C) 12.338.
D) 33.924.
If the test is to be performed at the 5% level, the critical value(s) from the chi-square distribution table is(are)
A) 10.982 and 36.781.
B) 12.338 and 33.924.
C) 12.338.
D) 33.924.
Question
There is a .90 probability of obtaining a  value such that
A)  <
<  <
<  .
.
B) ≤
≤  ≤
≤  .
.
C)  ≤
≤  ≤
≤  .
.
D)  <
<  <
<  .
.
value such that A)
< < .B)
≤ ≤ .C)
≤ ≤ .D)
< < . Question
Consider the following hypothesis problem. 
The p-value is
A) less than .025.
B) between .025 and .05.
C) between .05 and .10.
D) greater than .10.
The p-value is
A) less than .025.
B) between .025 and .05.
C) between .05 and .10.
D) greater than .10.
Question
Question
Consider the following sample information from Population A and Population B. 
We want to test the hypothesis that the population variances are equal. The test statistic for this problem equals
A) .67.
B) .84.
C) 1.19.
D) 1.50.
We want to test the hypothesis that the population variances are equal. The test statistic for this problem equals
A) .67.
B) .84.
C) 1.19.
D) 1.50.
Question
Consider the following sample information from Population A and Population B. 
We want to test the hypothesis that the population variances are equal. The null hypothesis is to be tested at the 10% level of significance. The critical value from the F distribution table is
A) 2.11.
B) 2.13.
C) 2.24.
D) 2.29.
We want to test the hypothesis that the population variances are equal. The null hypothesis is to be tested at the 10% level of significance. The critical value from the F distribution table is
A) 2.11.
B) 2.13.
C) 2.24.
D) 2.29.
Question
Consider the following sample information from Population A and Population B. 
We want to test the hypothesis that the population variances are equal. At the 10% level of significance, the null hypothesis
A) should be rejected.
B) should not be rejected.
C) should be revised.
D) should not be tested.
We want to test the hypothesis that the population variances are equal. At the 10% level of significance, the null hypothesis
A) should be rejected.
B) should not be rejected.
C) should be revised.
D) should not be tested.
Question
Consider the following hypothesis problem. 
If the test is to be performed at the .05 level of significance, the null hypothesis
A) should be rejected.
B) should not be rejected.
C) should be revised.
D) should not be tested.
If the test is to be performed at the .05 level of significance, the null hypothesis
A) should be rejected.
B) should not be rejected.
C) should be revised.
D) should not be tested.
Question
Question
Consider the following hypothesis problem.  The null hypothesis is to be tested at the 5% level of significance. The critical value(s) from the chi-square distribution table is(are)
A) 42.557.
B) 43.773.
C) 16.047 and 45.722.
D) 16.791 and 46.979.
The null hypothesis is to be tested at the 5% level of significance. The critical value(s) from the chi-square distribution table is(are)A) 42.557.
B) 43.773.
C) 16.047 and 45.722.
D) 16.791 and 46.979.
Question
Question
Consider the following hypothesis problem.  The null hypothesis is to be tested at the 5% level of significance. The critical value(s) from the chi-square distribution table is(are)
A) 22.362.
B) 23.685.
C) 5.009 and 24.736.
D) 5.629 and 26.119.
The null hypothesis is to be tested at the 5% level of significance. The critical value(s) from the chi-square distribution table is(are)A) 22.362.
B) 23.685.
C) 5.009 and 24.736.
D) 5.629 and 26.119.
Question
Consider the following hypothesis problem.  The test statistic equals
A) 23.20.
B) 24.00.
C) 36.25.
D) 37.50.
The test statistic equalsA) 23.20.
B) 24.00.
C) 36.25.
D) 37.50.
Question
Consider the following hypothesis problem.  At the 5% level of significance, the null hypothesis
A) should be rejected.
B) should not be rejected.
C) should be revised.
D) should not be tested.
At the 5% level of significance, the null hypothesisA) should be rejected.
B) should not be rejected.
C) should be revised.
D) should not be tested.
Question
Question
Based on the sample evidence below, we want to test the hypothesis that population A has a larger variance than population B. 
The p-value is approximately
A) .10.
B) .05.
C) .025.
D) .01.
The p-value is approximately
A) .10.
B) .05.
C) .025.
D) .01.
Question
Consider the following hypothesis problem.  The test statistic equals
A) .63.
B) 12.68.
C) 13.33.
D) 13.68.
The test statistic equalsA) .63.
B) 12.68.
C) 13.33.
D) 13.68.
Question
Based on the sample evidence below, we want to test the hypothesis that population A has a larger variance than population B.  The test statistic for this problem equals
A) .4132.
B) 1.1.
C) 2.42.
D) 2.
The test statistic for this problem equalsA) .4132.
B) 1.1.
C) 2.42.
D) 2.
Question
Question
At α = .1, test to see if the population variances from which the following samples were drawn are equal. 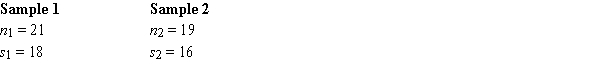
Question
Question
Question
Student advisors are interested in determining if the variances of the scores of day students and night students are the same. The following samples are drawn: 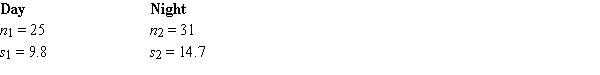
Test the equality of the variances of the populations. Let α = .05.
Test the equality of the variances of the populations. Let α = .05.
Question

Unlock Deck
Sign up to unlock the cards in this deck!
Unlock Deck
Unlock Deck
1/66
Play
Full screen (f)
Deck 11: Inferences About Population Variances
1
To avoid the problem of not having access to Tables of F distribution when F values are needed for the lower tail, the numerator of the test statistic for a two-tailed test should be the one with
A) the larger sample size.
B) the smaller sample size.
C) the larger sample variance.
D) the smaller sample variance.
A) the larger sample size.
B) the smaller sample size.
C) the larger sample variance.
D) the smaller sample variance.
the larger sample variance.
2
A sample of 61 elements is selected to estimate a 95% confidence interval for the variance of the population. The chi-square values to be used for this interval estimation are
A) 40.482 and 83.298.
B) 32.357 and 71.420.
C) 34.764 and 67.505.
D) 43.188 and 79.082.
A) 40.482 and 83.298.
B) 32.357 and 71.420.
C) 34.764 and 67.505.
D) 43.188 and 79.082.
40.482 and 83.298.
3
The producer of a certain medicine claims that their bottling equipment is very accurate and that the standard deviation of all their filled bottles is .2 ounces or less. A sample of 20 bottles showed a standard deviation of .12 ounces. The test statistic to test the claim is
A) 2.3.
B) 22.99.
C) 6.84.
D) 1.368.
A) 2.3.
B) 22.99.
C) 6.84.
D) 1.368.
6.84.
4
Which of the following has a chi-square distribution?
A) (n - 1)s2/σ2.
B) (n - 1)σ/s.
C) (n - 1.0)s/σ.
D) (n - 1.0)s2/σ2.
A) (n - 1)s2/σ2.
B) (n - 1)σ/s.
C) (n - 1.0)s/σ.
D) (n - 1.0)s2/σ2.
Unlock Deck
Unlock for access to all 66 flashcards in this deck.
Unlock Deck
k this deck
5
We are interested in testing whether the variance of a population is significantly less than 1.44. The null hypothesis for this test is
A) H0: σ2 < 1.44.
B) H0: s2 ≥ 1.44.
C) H0: σ < 1.20.
D) H0: σ2 ≥ 1.44.
A) H0: σ2 < 1.44.
B) H0: s2 ≥ 1.44.
C) H0: σ < 1.20.
D) H0: σ2 ≥ 1.44.
Unlock Deck
Unlock for access to all 66 flashcards in this deck.
Unlock Deck
k this deck
6
The bottler of a certain soft drink claims their equipment to be accurate and that the variance of all filled bottles is at most .05. The null hypothesis in a test to confirm the claim would be written as
A) H0: σ2 ≥ .05.
B) H0: s2 ≥ .05.
C) H0: s2 ≤ .05.
D) H0: σ2 ≤ .05.
A) H0: σ2 ≥ .05.
B) H0: s2 ≥ .05.
C) H0: s2 ≤ .05.
D) H0: σ2 ≤ .05.
Unlock Deck
Unlock for access to all 66 flashcards in this deck.
Unlock Deck
k this deck
7
The manager of the service department of a local car dealership has noted that the service times of a sample of 30 new automobiles has a standard deviation of 5 minutes. A 95% confidence interval estimate for the standard deviation of the service times (in minutes) for all their new automobiles is
A) 16.047 to 45.722.
B) 15.857 to 45.180.
C) 3.982 to 6.722.
D) 22.833 to 65.059.
A) 16.047 to 45.722.
B) 15.857 to 45.180.
C) 3.982 to 6.722.
D) 22.833 to 65.059.
Unlock Deck
Unlock for access to all 66 flashcards in this deck.
Unlock Deck
k this deck
8
The manager of the service department of a local car dealership has noted that the service times of a sample of 16 new automobiles has a standard deviation of 5 minutes. A 95% confidence interval estimate for the variance of service times for all their new automobiles is
A) 13.642 to 59.885.
B) 9.46 to 34.09.
C) 2.144 to 9.948.
D) 2.728 to 11.977.
A) 13.642 to 59.885.
B) 9.46 to 34.09.
C) 2.144 to 9.948.
D) 2.728 to 11.977.
Unlock Deck
Unlock for access to all 66 flashcards in this deck.
Unlock Deck
k this deck
9
The random variable for a chi-square distribution may assume
A) any value between -1 to 1.
B) any value between -∞ to +∞.
C) any negative value.
D) any value greater than zero.
A) any value between -1 to 1.
B) any value between -∞ to +∞.
C) any negative value.
D) any value greater than zero.
Unlock Deck
Unlock for access to all 66 flashcards in this deck.
Unlock Deck
k this deck
10
A sample of 20 cans of tomato juice showed a standard deviation of .4 ounces. A 95% confidence interval estimate of the variance for the population is
A) .2313 to .8533.
B) .2224 to .7924.
C) .3042 to .5843.
D) .0925 to .3413.
A) .2313 to .8533.
B) .2224 to .7924.
C) .3042 to .5843.
D) .0925 to .3413.
Unlock Deck
Unlock for access to all 66 flashcards in this deck.
Unlock Deck
k this deck
11
The symbol used for the variance of the sample is
A) σ.
B) σ2.
C) s.
D) s2.
A) σ.
B) σ2.
C) s.
D) s2.
Unlock Deck
Unlock for access to all 66 flashcards in this deck.
Unlock Deck
k this deck
12
For an F distribution, the number of degrees of freedom for the numerator
A) must be larger than the number of degrees of freedom for the denominator.
B) must be smaller than the number of degrees of freedom for the denominator.
C) must be equal to the number of degrees of freedom for the denominator.
D) can be larger, smaller, or equal to the number of degrees of freedom for the denominator.
Unlock Deck
Unlock for access to all 66 flashcards in this deck.
Unlock Deck
k this deck
13
Which of the following has an F distribution?
A) (n - 1)s/σ.
B) s1/s2.
C) (n - 1)s1/s2.
D) .
A) (n - 1)s/σ.
B) s1/s2.
C) (n - 1)s1/s2.
D)
. Unlock Deck
Unlock for access to all 66 flashcards in this deck.
Unlock Deck
k this deck
14
The producer of a certain bottling equipment claims that the variance of all their filled bottles is .027 or less. A sample of 30 bottles showed a standard deviation of .2 ounces. The p-value for the test is
A) between .025 to .05.
B) between .05 to .10.
C) .05.
D) .025.
A) between .025 to .05.
B) between .05 to .10.
C) .05.
D) .025.
Unlock Deck
Unlock for access to all 66 flashcards in this deck.
Unlock Deck
k this deck
15
The symbol used for the variance of the population is
A) σ.
B) σ2.
C) s.
D) s2.
A) σ.
B) σ2.
C) s.
D) s2.
Unlock Deck
Unlock for access to all 66 flashcards in this deck.
Unlock Deck
k this deck
16
A sample of 51 observations yielded a sample standard deviation of 5. If we want to test H0: σ2 = 20, the test statistic is
A) 62.5.
B) 12.5.
C) 51.25.
D) 50.
A) 62.5.
B) 12.5.
C) 51.25.
D) 50.
Unlock Deck
Unlock for access to all 66 flashcards in this deck.
Unlock Deck
k this deck
17
The sampling distribution used when making inferences about a single population's variance is
A) an F distribution.
B) a t distribution.
C) a chi-square distribution.
D) a normal distribution.
A) an F distribution.
B) a t distribution.
C) a chi-square distribution.
D) a normal distribution.
Unlock Deck
Unlock for access to all 66 flashcards in this deck.
Unlock Deck
k this deck
18
A sample of 31 observations yielded a sample variance of 16. If we want to test H0: σ2 = 16, the test statistic is
A) 20.
B) 21.
C) 30.
D) 7.5.
A) 20.
B) 21.
C) 30.
D) 7.5.
Unlock Deck
Unlock for access to all 66 flashcards in this deck.
Unlock Deck
k this deck
19
The value of F.05 with 8 numerator and 19 denominator degrees of freedom is
A) 2.48.
B) 2.58.
C) 3.63.
D) 2.96.
A) 2.48.
B) 2.58.
C) 3.63.
D) 2.96.
Unlock Deck
Unlock for access to all 66 flashcards in this deck.
Unlock Deck
k this deck
20
A sample of n observations is taken from a normal population. The appropriate chi-square distribution has
A) n degrees of freedom.
B) n - 1 degrees of freedom.
C) n - 2 degrees of freedom.
D) n - 3 degrees of freedom.
A) n degrees of freedom.
B) n - 1 degrees of freedom.
C) n - 2 degrees of freedom.
D) n - 3 degrees of freedom.
Unlock Deck
Unlock for access to all 66 flashcards in this deck.
Unlock Deck
k this deck
21
The contents of a sample of 26 cans of apple juice showed a standard deviation of .06 ounces. We are interested in testing whether the variance of the population is significantly more than .003. The null hypothesis is
A) s2 > .003.
B) s2 ≤ .003.
C) σ2 > .003.
D) σ2 ≤ .003.
A) s2 > .003.
B) s2 ≤ .003.
C) σ2 > .003.
D) σ2 ≤ .003.
Unlock Deck
Unlock for access to all 66 flashcards in this deck.
Unlock Deck
k this deck
22
The contents of a sample of 26 cans of apple juice showed a standard deviation of .06 ounces. We are interested in testing whether the variance of the population is significantly more than .003. The test statistic is
A) 1.2.
B) 31.2.
C) 30.
D) 500.
A) 1.2.
B) 31.2.
C) 30.
D) 500.
Unlock Deck
Unlock for access to all 66 flashcards in this deck.
Unlock Deck
k this deck
23
The contents of a sample of 26 cans of apple juice showed a standard deviation of .06 ounces. We are interested in testing whether the variance of the population is significantly more than .003. At the .05 level of significance, the null hypothesis
A) should be rejected.
B) should not be rejected.
C) should be revised.
D) should not be tested.
A) should be rejected.
B) should not be rejected.
C) should be revised.
D) should not be tested.
Unlock Deck
Unlock for access to all 66 flashcards in this deck.
Unlock Deck
k this deck
24
The value of F.01 with 9 numerator and 20 denominator degrees of freedom is
A) 2.39.
B) 2.94.
C) 2.91.
D) 3.46.
A) 2.39.
B) 2.94.
C) 2.91.
D) 3.46.
Unlock Deck
Unlock for access to all 66 flashcards in this deck.
Unlock Deck
k this deck
25
The chi-square value for a one-tailed (upper tail) hypothesis test at a 5% level of significance and a sample size of 25 is
A) 33.196.
B) 36.415.
C) 39.364.
D) 37.652.
A) 33.196.
B) 36.415.
C) 39.364.
D) 37.652.
Unlock Deck
Unlock for access to all 66 flashcards in this deck.
Unlock Deck
k this deck
26
A sample of 21 elements is selected to estimate a 90% confidence interval for the variance of the population. The chi-square value(s) to be used for this interval estimation is(are)
A) 31.410.
B) 12.443.
C) 10.851 and 31.410.
D) 12.443 and 28.412.
A) 31.410.
B) 12.443.
C) 10.851 and 31.410.
D) 12.443 and 28.412.
Unlock Deck
Unlock for access to all 66 flashcards in this deck.
Unlock Deck
k this deck
27
The sampling distribution of the ratio of independent sample variances extracted from two normal populations with equal variances is the
A) chi-square distribution.
B) normal distribution.
C) F distribution.
D) t distribution.
A) chi-square distribution.
B) normal distribution.
C) F distribution.
D) t distribution.
Unlock Deck
Unlock for access to all 66 flashcards in this deck.
Unlock Deck
k this deck
28
For a sample size of 21 at 95% confidence, the chi-square values needed for interval estimation are
A) 9.591 and 34.170.
B) 2.700 and 19.023.
C) 8.260 and 37.566.
D) 10.283 and 35.479.
A) 9.591 and 34.170.
B) 2.700 and 19.023.
C) 8.260 and 37.566.
D) 10.283 and 35.479.
Unlock Deck
Unlock for access to all 66 flashcards in this deck.
Unlock Deck
k this deck
29
We are interested in testing to see if the variance of a population is less than 7. The correct null hypothesis is
A) σ < 7.
B) σ2 ≥ 7.
C) σ < 49.
D) σ2 ≥ 49.
A) σ < 7.
B) σ2 ≥ 7.
C) σ < 49.
D) σ2 ≥ 49.
Unlock Deck
Unlock for access to all 66 flashcards in this deck.
Unlock Deck
k this deck
30
A sample of 60 items from population 1 has a sample variance of 12 while a sample of 50 items from population 2 has a sample variance of 15. If we want to test whether the variances of the two populations are equal, the test statistic will have a value of
A) .8.
B) 1.56.
C) 1.5.
D) 1.25.
A) .8.
B) 1.56.
C) 1.5.
D) 1.25.
Unlock Deck
Unlock for access to all 66 flashcards in this deck.
Unlock Deck
k this deck
31
The contents of a sample of 26 cans of apple juice showed a standard deviation of .06 ounces. We are interested in testing whether the variance of the population is significantly more than .003. The p-value for this test is
A) .05.
B) greater than .10.
C) less than .10.
D) zero.
A) .05.
B) greater than .10.
C) less than .10.
D) zero.
Unlock Deck
Unlock for access to all 66 flashcards in this deck.
Unlock Deck
k this deck
32
The sampling distribution of the quantity (n - 1)s2/σ2 is the
A) chi-square distribution.
B) normal distribution.
C) F distribution.
D) t distribution.
A) chi-square distribution.
B) normal distribution.
C) F distribution.
D) t distribution.
Unlock Deck
Unlock for access to all 66 flashcards in this deck.
Unlock Deck
k this deck
33
The chi-square value for a one-tailed (lower tail) test when the level of significance is .1 and the sample size is 15 is
A) 21.064.
B) 23.685.
C) 7.790.
D) 6.571.
A) 21.064.
B) 23.685.
C) 7.790.
D) 6.571.
Unlock Deck
Unlock for access to all 66 flashcards in this deck.
Unlock Deck
k this deck
34
The 90% confidence interval estimate of a population standard deviation when a sample variance of 50 is obtained from a sample of 15 items is
A) 26.8 to 124.356.
B) 5.177 to 11.152.
C) 5.436 to 10.321.
D) 29.555 to 106.529.
A) 26.8 to 124.356.
B) 5.177 to 11.152.
C) 5.436 to 10.321.
D) 29.555 to 106.529.
Unlock Deck
Unlock for access to all 66 flashcards in this deck.
Unlock Deck
k this deck
35
The 99% confidence interval estimate for a population variance when a sample standard deviation of 12 is obtained from a sample of 10 items is
A) 4.589 to 62.253.
B) 46.538 to 422.171.
C) 54.941 to 746.974.
D) 62.042 to 562.895.
A) 4.589 to 62.253.
B) 46.538 to 422.171.
C) 54.941 to 746.974.
D) 62.042 to 562.895.
Unlock Deck
Unlock for access to all 66 flashcards in this deck.
Unlock Deck
k this deck
36
The critical value of F using α = .05 when there is a sample size of 21 for the sample with the smaller variance, and there is a sample size of 9 for the sample with the larger sample variance is
A) 2.45.
B) 2.94.
C) 2.37.
D) 2.10.
A) 2.45.
B) 2.94.
C) 2.37.
D) 2.10.
Unlock Deck
Unlock for access to all 66 flashcards in this deck.
Unlock Deck
k this deck
37
We are interested in testing whether the variance of a population is significantly more than 625. The null hypothesis for this test is
A) H0: σ2 > 625.
B) H0: σ2 ≤ 625.
C) H0: σ2 ≥ 625.
D) H0: σ2 ≤ 25.
A) H0: σ2 > 625.
B) H0: σ2 ≤ 625.
C) H0: σ2 ≥ 625.
D) H0: σ2 ≤ 25.
Unlock Deck
Unlock for access to all 66 flashcards in this deck.
Unlock Deck
k this deck
38
The 95% confidence interval estimate of a population variance when a sample variance of 324 is obtained from a sample of 81 items is
A) 14.14 to 174.94.
B) 243.086 to 453.520.
C) 16.42 to 194.35.
D) 254.419 to 429.203.
A) 14.14 to 174.94.
B) 243.086 to 453.520.
C) 16.42 to 194.35.
D) 254.419 to 429.203.
Unlock Deck
Unlock for access to all 66 flashcards in this deck.
Unlock Deck
k this deck
39
A sample of 61 observations yielded a sample standard deviation of 6. If we want to test H0: σ2 = 40, the test statistic is
A) 54.
B) 9.15.
C) 54.90.
D) 9.
A) 54.
B) 9.15.
C) 54.90.
D) 9.
Unlock Deck
Unlock for access to all 66 flashcards in this deck.
Unlock Deck
k this deck
40
A random sample of 31 sales charge showed a sample standard deviation of $50. A 90% confidence interval estimate of the population standard deviation is
A) 1715.101 to 4055.589.
B) 1596.458 to 4466.679.
C) 39.956 to 66.833.
D) 41.393 to 63.684.
A) 1715.101 to 4055.589.
B) 1596.458 to 4466.679.
C) 39.956 to 66.833.
D) 41.393 to 63.684.
Unlock Deck
Unlock for access to all 66 flashcards in this deck.
Unlock Deck
k this deck
41
Consider the following hypothesis problem. The test statistic has a value of
A) 20.91.
B) 24.20.
C) 24.00.
D) 20.00.
The test statistic has a value ofA) 20.91.
B) 24.20.
C) 24.00.
D) 20.00.
Unlock Deck
Unlock for access to all 66 flashcards in this deck.
Unlock Deck
k this deck
42
Consider the following hypothesis problem.
If the test is to be performed at the 5% level, the critical value(s) from the chi-square distribution table is(are)
A) 10.982 and 36.781.
B) 12.338 and 33.924.
C) 12.338.
D) 33.924.
If the test is to be performed at the 5% level, the critical value(s) from the chi-square distribution table is(are)
A) 10.982 and 36.781.
B) 12.338 and 33.924.
C) 12.338.
D) 33.924.
Unlock Deck
Unlock for access to all 66 flashcards in this deck.
Unlock Deck
k this deck
43
There is a .90 probability of obtaining a value such that
A) < < .
B) ≤ ≤ .
C) ≤ ≤ .
D) < < .
value such that A)
< < .B)
≤ ≤ .C)
≤ ≤ .D)
< < . Unlock Deck
Unlock for access to all 66 flashcards in this deck.
Unlock Deck
k this deck
44
Consider the following hypothesis problem.
The p-value is
A) less than .025.
B) between .025 and .05.
C) between .05 and .10.
D) greater than .10.
The p-value is
A) less than .025.
B) between .025 and .05.
C) between .05 and .10.
D) greater than .10.
Unlock Deck
Unlock for access to all 66 flashcards in this deck.
Unlock Deck
k this deck
45
In practice, the most frequently encountered hypothesis test about a population variance is a
A) one-tailed test, with rejection region in the lower tail.
B) one-tailed test, with rejection region in the upper tail.
C) two-tailed test, with equal-size rejection regions.
D) two-tailed test, with unequal-size rejection regions.
A) one-tailed test, with rejection region in the lower tail.
B) one-tailed test, with rejection region in the upper tail.
C) two-tailed test, with equal-size rejection regions.
D) two-tailed test, with unequal-size rejection regions.
Unlock Deck
Unlock for access to all 66 flashcards in this deck.
Unlock Deck
k this deck
46
Consider the following sample information from Population A and Population B.
We want to test the hypothesis that the population variances are equal. The test statistic for this problem equals
A) .67.
B) .84.
C) 1.19.
D) 1.50.
We want to test the hypothesis that the population variances are equal. The test statistic for this problem equals
A) .67.
B) .84.
C) 1.19.
D) 1.50.
Unlock Deck
Unlock for access to all 66 flashcards in this deck.
Unlock Deck
k this deck
47
Consider the following sample information from Population A and Population B.
We want to test the hypothesis that the population variances are equal. The null hypothesis is to be tested at the 10% level of significance. The critical value from the F distribution table is
A) 2.11.
B) 2.13.
C) 2.24.
D) 2.29.
We want to test the hypothesis that the population variances are equal. The null hypothesis is to be tested at the 10% level of significance. The critical value from the F distribution table is
A) 2.11.
B) 2.13.
C) 2.24.
D) 2.29.
Unlock Deck
Unlock for access to all 66 flashcards in this deck.
Unlock Deck
k this deck
48
Consider the following sample information from Population A and Population B.
We want to test the hypothesis that the population variances are equal. At the 10% level of significance, the null hypothesis
A) should be rejected.
B) should not be rejected.
C) should be revised.
D) should not be tested.
We want to test the hypothesis that the population variances are equal. At the 10% level of significance, the null hypothesis
A) should be rejected.
B) should not be rejected.
C) should be revised.
D) should not be tested.
Unlock Deck
Unlock for access to all 66 flashcards in this deck.
Unlock Deck
k this deck
49
Consider the following hypothesis problem.
If the test is to be performed at the .05 level of significance, the null hypothesis
A) should be rejected.
B) should not be rejected.
C) should be revised.
D) should not be tested.
If the test is to be performed at the .05 level of significance, the null hypothesis
A) should be rejected.
B) should not be rejected.
C) should be revised.
D) should not be tested.
Unlock Deck
Unlock for access to all 66 flashcards in this deck.
Unlock Deck
k this deck
50
A sample of 28 elements is selected to estimate a 95% confidence interval for the variance of the population. The chi-square values to be used for this interval estimation are
A) 11.808 and 49.645.
B) 14.573 and 43.195.
C) 16.151 and 40.113.
D) 15.308 and 44.461.
A) 11.808 and 49.645.
B) 14.573 and 43.195.
C) 16.151 and 40.113.
D) 15.308 and 44.461.
Unlock Deck
Unlock for access to all 66 flashcards in this deck.
Unlock Deck
k this deck
51
Consider the following hypothesis problem. The null hypothesis is to be tested at the 5% level of significance. The critical value(s) from the chi-square distribution table is(are)
A) 42.557.
B) 43.773.
C) 16.047 and 45.722.
D) 16.791 and 46.979.
The null hypothesis is to be tested at the 5% level of significance. The critical value(s) from the chi-square distribution table is(are)A) 42.557.
B) 43.773.
C) 16.047 and 45.722.
D) 16.791 and 46.979.
Unlock Deck
Unlock for access to all 66 flashcards in this deck.
Unlock Deck
k this deck
52
To avoid the problem of not having access to tables of the F distribution when a one-tailed test is required and with F values given for the lower tail, let the
A) smaller sample variance be the numerator of the test statistic.
B) larger sample variance be the numerator of the test statistic.
C) sample variance from the population with the smaller hypothesized variance be the numerator of the test statistic.
D) sample variance from the population with the larger hypothesized variance be the numerator of the test statistic.
Unlock Deck
Unlock for access to all 66 flashcards in this deck.
Unlock Deck
k this deck
53
Consider the following hypothesis problem. The null hypothesis is to be tested at the 5% level of significance. The critical value(s) from the chi-square distribution table is(are)
A) 22.362.
B) 23.685.
C) 5.009 and 24.736.
D) 5.629 and 26.119.
The null hypothesis is to be tested at the 5% level of significance. The critical value(s) from the chi-square distribution table is(are)A) 22.362.
B) 23.685.
C) 5.009 and 24.736.
D) 5.629 and 26.119.
Unlock Deck
Unlock for access to all 66 flashcards in this deck.
Unlock Deck
k this deck
54
Consider the following hypothesis problem. The test statistic equals
A) 23.20.
B) 24.00.
C) 36.25.
D) 37.50.
The test statistic equalsA) 23.20.
B) 24.00.
C) 36.25.
D) 37.50.
Unlock Deck
Unlock for access to all 66 flashcards in this deck.
Unlock Deck
k this deck
55
Consider the following hypothesis problem. At the 5% level of significance, the null hypothesis
A) should be rejected.
B) should not be rejected.
C) should be revised.
D) should not be tested.
At the 5% level of significance, the null hypothesisA) should be rejected.
B) should not be rejected.
C) should be revised.
D) should not be tested.
Unlock Deck
Unlock for access to all 66 flashcards in this deck.
Unlock Deck
k this deck
56
Consider the following hypothesis problem. At the 5% level of significance, the null hypothesis
A) should be rejected.
B) should not be rejected.
C) should be revised.
D) should not be tested.
At the 5% level of significance, the null hypothesisA) should be rejected.
B) should not be rejected.
C) should be revised.
D) should not be tested.
Unlock Deck
Unlock for access to all 66 flashcards in this deck.
Unlock Deck
k this deck
57
?Which of the following rejection rules is proper?
A) ?Reject H0 if p-value ? F?.
B) ?Reject H0 if F ? F?/2.
C) ?Reject H0 if p-value ? ?/2.
D) ?Reject H0 if F ? F?.
A) ?Reject H0 if p-value ? F?.
B) ?Reject H0 if F ? F?/2.
C) ?Reject H0 if p-value ? ?/2.
D) ?Reject H0 if F ? F?.
Unlock Deck
Unlock for access to all 66 flashcards in this deck.
Unlock Deck
k this deck
58
Based on the sample evidence below, we want to test the hypothesis that population A has a larger variance than population B.
The p-value is approximately
A) .10.
B) .05.
C) .025.
D) .01.
The p-value is approximately
A) .10.
B) .05.
C) .025.
D) .01.
Unlock Deck
Unlock for access to all 66 flashcards in this deck.
Unlock Deck
k this deck
59
Consider the following hypothesis problem. The test statistic equals
A) .63.
B) 12.68.
C) 13.33.
D) 13.68.
The test statistic equalsA) .63.
B) 12.68.
C) 13.33.
D) 13.68.
Unlock Deck
Unlock for access to all 66 flashcards in this deck.
Unlock Deck
k this deck
60
Based on the sample evidence below, we want to test the hypothesis that population A has a larger variance than population B. The test statistic for this problem equals
A) .4132.
B) 1.1.
C) 2.42.
D) 2.
The test statistic for this problem equalsA) .4132.
B) 1.1.
C) 2.42.
D) 2.
Unlock Deck
Unlock for access to all 66 flashcards in this deck.
Unlock Deck
k this deck
61
A lumber company has claimed that the standard deviation for the lengths of their six-foot boards is .4 inches or less. To test their claim, a random sample of 16 six-foot boards is selected; and it is determined that the variance of the sample is .3. Do the results of the sample support the company's claim? Use α = .1.
Unlock Deck
Unlock for access to all 66 flashcards in this deck.
Unlock Deck
k this deck
62
At α = .1, test to see if the population variances from which the following samples were drawn are equal.
Unlock Deck
Unlock for access to all 66 flashcards in this deck.
Unlock Deck
k this deck
63
The standard deviation of the daily temperatures in Honolulu last year was 4 degrees Fahrenheit. A random sample of 25 days resulted in a standard deviation of 5.8 degrees Fahrenheit. Has there been a significant increase in the variance of the temperatures? Use α = .05.
Unlock Deck
Unlock for access to all 66 flashcards in this deck.
Unlock Deck
k this deck
64
A random sample of 20 observations showed a standard deviation of 8. At a .05 level of significance, test to see if the variance of the population is significantly less than 65. Use the critical value approach.
Unlock Deck
Unlock for access to all 66 flashcards in this deck.
Unlock Deck
k this deck
65
Student advisors are interested in determining if the variances of the scores of day students and night students are the same. The following samples are drawn:
Test the equality of the variances of the populations. Let α = .05.
Test the equality of the variances of the populations. Let α = .05.
Unlock Deck
Unlock for access to all 66 flashcards in this deck.
Unlock Deck
k this deck
66
At α = .1, test to see if the population variances from which the following samples were drawn are equal.
Unlock Deck
Unlock for access to all 66 flashcards in this deck.
Unlock Deck
k this deck
Unlock Deck
Unlock for access to all 66 flashcards in this deck.


