Deck 13: Simple Linear Regression and Correlation: Inferential Methods
Full screen (f)
Question
Question
Question
Question
Question
Question
Question
Question
Question
Question
Question
Question
Question
Question
Question
The standard deviation of a + bx* grows larger the farther x* is from  .
.
. Question
Question
Question
Question
Question
Question
The scatter plot and residual plot shown below are from a regression analysis of Prehistoric Native American projectile points. The lengths of the projectiles were regressed on the width of the projectile points. 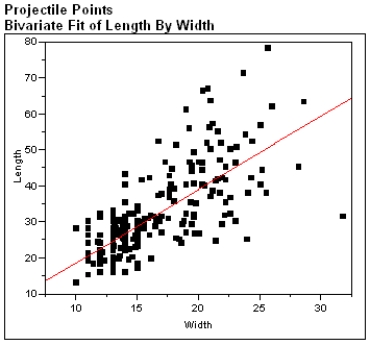
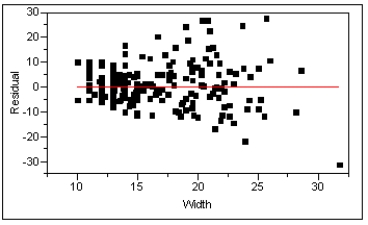 Using these plots categorize each of the Basic Assumptions of the simple linear regression model as one of the following:
a) Not checkable
b) Checked and met
c) Checked and not met
For all assumptions checked, explain what aspect of the graphs led you to your conclusion that the assumption was met or not met.
Using these plots categorize each of the Basic Assumptions of the simple linear regression model as one of the following: a) Not checkable
b) Checked and met
c) Checked and not met
For all assumptions checked, explain what aspect of the graphs led you to your conclusion that the assumption was met or not met.
Question
The computer output given below shows a regression of Body Mass (g) vs. Wing Length (mm) for sphinx moths. 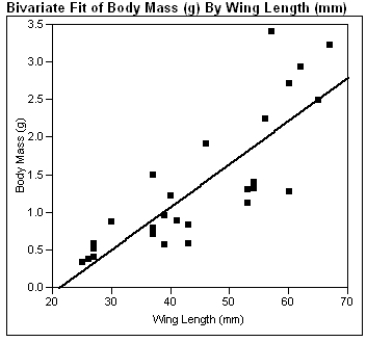
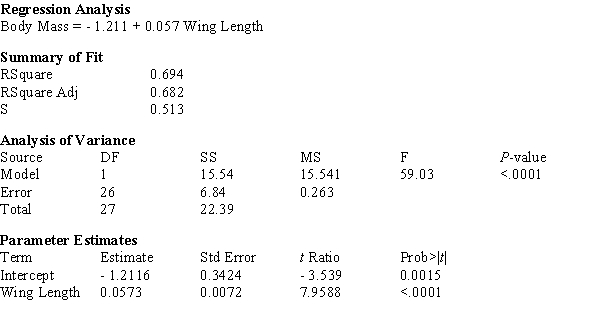
a) What is the estimated regression line?
b) What is the calculated value of sb?
c) What is the calculated value of se?
d) In a few sentences, interpret se in the context of this problem.
e) Using the computer output above, perform the Model Utility Test at the .05 level of significance.
f) Construct a 95% confidence interval for β.
Question
In a random sample of large cities around the world, the ozone level (in parts per million) and the population (in millions) were measured. Fitting the simple linear regression model gave the estimated regression equation 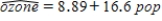 .
.
a) How would you interpret b = 16.6?
b) Substituting x = 3 gives = 58.69. Give two different interpretations of this number.
c) Do you think this equation should be used for predicting ozone in small towns in Iowa? Explain your response in a few sentences.
d) The value of r2 is not presented here, but explain how you would interpret r2 in the context of this problem.
. a) How would you interpret b = 16.6?
b) Substituting x = 3 gives
= 58.69. Give two different interpretations of this number. c) Do you think this equation should be used for predicting ozone in small towns in Iowa? Explain your response in a few sentences.
d) The value of r2 is not presented here, but explain how you would interpret r2 in the context of this problem.
Question
In a study of the surface temperatures of vital (living) and non-vital (dead) teeth in a random sample of 32 adults seeking dental care at a university clinic, temperatures of vital and non-vital teeth were measured for each individual. The computer output shown below was generated. 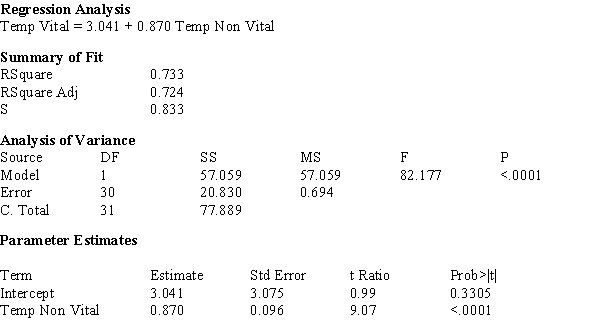
a) What proportion of observed variation in the surface temperature of vital teeth can be explained by the surface temperature of non-vital teeth?
b) Does the simple linear regression model appear to be useful? Justify your response with specific references to the computer output.
c) The estimated standard deviation of a + bx* for x* = 30 is calculated as: sa+b(30) = 0.2417. Calculate a 95% confidence interval for the true average vital tooth temperature when the non-vital tooth temperature is 30 degrees centigrade.
d) In one individual, a single surface temperature for a non-vital tooth is found to be 30 degrees centigrade. Use a 95% prediction interval to predict the resulting temperature of a vital tooth.
Question
The Iowa Tests of Educational Development are given each year to students around the country. Let x = the previous year's science scores and y = the current year's science scores for a sample of current sophomores who took the test both years. b = estimated slope of the regression line = 0.93 a = estimated y intercept of the regression line = 30.36
a) What is the equation of the estimated regression line?
b) On the graph below, sketch the estimated regression line using the information above. Be sure to label and scale your axes correctly.
c) For students with a score of 250 the previous year, what is the predicted score for the current year?
d) What is the average difference in science score that is associated with a 10-point difference in the previous year's science score?
e) The value of r2 is 0.71; interpret r2 in the context of this problem.
f) The value of se is 25.5. Interpret se in the context of this problem.
Question
In a study of gender-typing of toys, parents and non-parents were asked to rate the gender appropriateness of toys on a scale of 1 (Definitely for girls) to 5 (Definitely for boys). The investigators did a regression analysis of the parents mean scores vs. the non-parents mean scores for each toy. A computer-generated normal probability plot of the residuals is shown below. 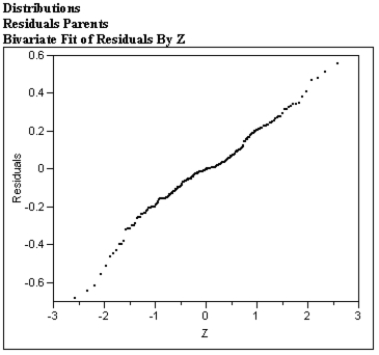 Write a brief paragraph describing the plot. Based on your description recommend to the investigators whether or not the appropriate assumption is met for simple linear regression.
Write a brief paragraph describing the plot. Based on your description recommend to the investigators whether or not the appropriate assumption is met for simple linear regression. Question
Let x be the number of pages in a geometry text book and y be the cost of the book (in dollars). Suppose that x and y are related according to the simple linear regression model with β = slope of the population regression line = 0.05 α = y intercept of population regression line = 30.0
a) What is the equation of the population regression line?
b) On the graph below, sketch the population regression line using the information above. Be sure to label and scale your axes correctly.
c) For a geometry book of 300 pages, what is the predicted cost in dollars?
d) What is the average change in price that is associated with a one-page increase in size of the geometry book?
e) What is the average change in price that is associated with a 20-page increase in size of the geometry book?
Question
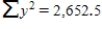
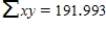
In a forensic study of the relation between time since death (hrs) and the thigh temperature in deer (F), a regression analysis of y = time since death on x = thigh temperature was performed. From their examination of the data the investigators felt that the assumptions of the linear regression model were satisfied. Summary quantities from this analysis yield: 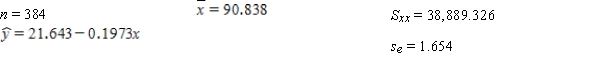
a) Calculate the estimated standard deviation of a + bx* for x* = 80.
b) For what value x* is the estimated standard deviation of a + bx* smallest, and why?
a) Calculate the estimated standard deviation of a + bx* for x* = 80.
b) For what value x* is the estimated standard deviation of a + bx* smallest, and why?
Question
A random sample of steelhead trout was selected; the length of the trout in inches and the weight of the trout in pounds were measured. Fitting the simple linear regression model gave the estimated regression equation 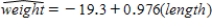 .
.
a) How would you interpret b = 0.976?
b) Substituting x = 30 gives = 9.98. Give two different interpretations of this number.
c) What happens if you predict the weight of an 18-inch trout? In a few sentences, explain why do you think this has occurred.
d) The value of r2 is not presented here, but explain how you would interpret r2 in the context of this problem.
. a) How would you interpret b = 0.976?
b) Substituting x = 30 gives
= 9.98. Give two different interpretations of this number. c) What happens if you predict the weight of an 18-inch trout? In a few sentences, explain why do you think this has occurred.
d) The value of r2 is not presented here, but explain how you would interpret r2 in the context of this problem.
Question
A veterinary graduate student is studying the relationship between the weight of one year-old golden retrievers in pounds (y) and the amount of dog food the dog is fed each day in pounds (x). A random sample of 10 golden retrievers yielded the following data and summary statistics. 
a) Write the estimated regression line below.
b) On the graph below, sketch the sample regression line using the information above. Be sure to label and scale your axes correctly.
c) What is your estimate of the average change in weight associated with a 1-pound increase in daily intake of dog food? d) What weight would you predict for a randomly selected golden retriever who is fed 1.2 pounds of dog food per day?
e) The value of se is 4.860. Interpret se in the context of this problem.
Question
In a forensic study of the relation between time since death (hrs) and the nostril temperature in deer (F) , a regression analysis of y = time since death on x = nostril temperature was performed. Summary quantities from this analysis yield: n = 384  Sxx = 49,999.464
 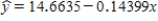 se = 1.997
a) Calculate the estimated standard deviation of a + bx* for x* = 80.
b) For what value x* is the estimated standard deviation of a + bx* smallest, and why?
Sxx = 49,999.464 se = 1.997 a) Calculate the estimated standard deviation of a + bx* for x* = 80.
b) For what value x* is the estimated standard deviation of a + bx* smallest, and why?
Question
The scatter plot and residual plot shown below is from a regression analysis of Prehistoric Native American projectile points. The widths of the projectiles were regressed on the length of the projectile points. 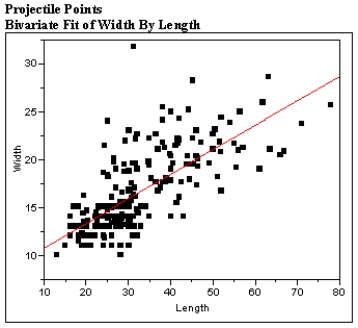
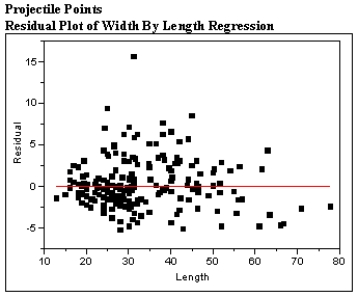 Using these plots categorize each of the Basic Assumptions of the simple linear regression model as one of the following:
a) Not checkable
b) Checked and met
c) Checked and not met
For all assumptions checked, explain what aspect of the graphs led you to your conclusion that the assumption was met or not met.
Using these plots categorize each of the Basic Assumptions of the simple linear regression model as one of the following: a) Not checkable
b) Checked and met
c) Checked and not met
For all assumptions checked, explain what aspect of the graphs led you to your conclusion that the assumption was met or not met.
Question
A study investigating the relationship between the major league batting average of non-pitching rookies (y) and their career minor league batting average (x) yields the following data: 
a) Write the estimated regression line below.
b) On the graph below, sketch the sample regression line using the information above. Be sure to label and scale your axes correctly.
c) What is your estimate of the average change in major-league batting average associated with an increase of 0.050 in the career minor-league batting average?
d) What major-league batting average would you predict for a randomly selected individual with a career minor-league batting average of 0.300?
e) The value of se is 0.015. Interpret se in the context of this problem.
Question
Question
When the four basic assumptions for a simple linear regression model are satisfied,
a) What is μb equal to?
b) What is σb equal to? c) What is the shape of the sampling distribution of b?
d) What is the probability distribution of the standardized variable, ?
?
a) What is μb equal to?
b) What is σb equal to? c) What is the shape of the sampling distribution of b?
d) What is the probability distribution of the standardized variable,
? Question
Let x be the number of pages in a statistics text book and y be the cost of the book (in dollars.) Suppose that x and y are related according to the simple linear regression model with β = slope of the population regression line = 0.075 α = y intercept of population regression line = 25.0
a) What is the equation of the population regression line?
b) On the graph below, sketch the population regression line using the information above. Be sure to label and scale your axes correctly.
c) For a statistics book of 900 pages, what is the predicted cost in dollars?
d) What is the average change in price that is associated with a one-page increase in size of a statistics book?
e) What is the average change in price that is associated with a 20-page increase in size of a statistics book?
Question
Question
The computer output given below shows a regression of Wing Length (mm) vs. Body Mass (g) for sphinx moths. 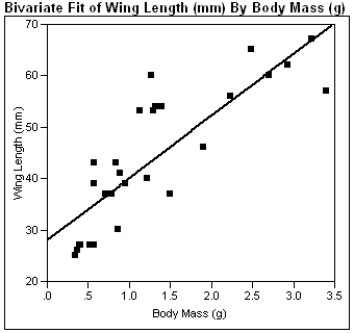
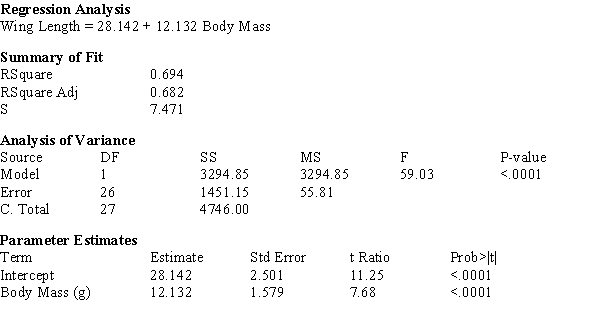
a) What is the estimated regression line?
b) What is the calculated value of sb?
c) What is the calculated value of se?
d) In a few sentences, interpret se in the context of this problem.
e) Using the computer output above, perform the Model Utility Test at the .05 level of significance.
f) Construct a 95% confidence interval for β.
Question
In a study of gender typing of toys, fathers and mothers were asked to rate the gender appropriateness of toys on a scale of 1 (Definitely for girls) to 5 (Definitely for boys). The investigators did a regression analysis of the fathers' mean ratings vs. the mothers mean ratings for each toy. A computer-generated normal probability plot of the residuals is shown below. 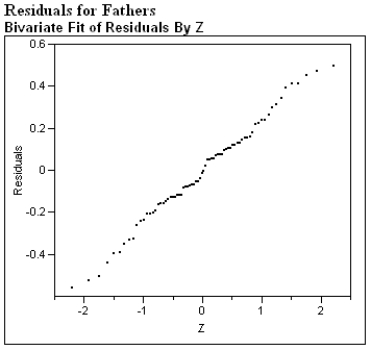 Write a brief paragraph describing the plot. Based on your description recommend to the investigators whether or not the appropriate assumption is met for simple linear regression.
Write a brief paragraph describing the plot. Based on your description recommend to the investigators whether or not the appropriate assumption is met for simple linear regression. Question
In a study of the surface temperatures of vital (living) and non-vital (dead) teeth in a random sample of 32 adults seeking dental care at a university clinic, temperatures of vital and non-vital teeth were measured for each individual. From their examination of the data the investigators felt that the assumptions of the linear regression model were satisfied. The computer output shown below was generated. 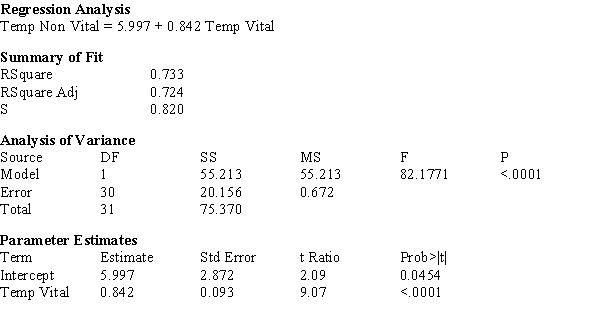
a) What proportion of observed variation in the surface temperature of non-vital teeth can be explained by the surface temperature of vital teeth?
b) Does the simple linear regression model appear to be useful? Justify your response with specific references to the computer output.
c) The estimated standard deviation of a + bx* for x* = 30 is calculated as: sa+b(30) = 0.1665. Calculate a 95% confidence interval for the true average non-vital tooth temperature when the vital tooth temperature is 30 degrees centigrade.
d) In one individual, a single surface temperature for a vital tooth is found to be 30 degrees centigrade. Use a 95% prediction interval to predict the resulting temperature of a non-vital tooth.
Question
In a study of the bidding behavior when antique grandfather clocks are sold at auction, investigators analyzed the selling price (y) and the age in years of the grandfather clock (x). Summary quantities from this analysis yield: n = 32  Sxx = 23625.9
  se = 273.03
a) Calculate the estimated standard deviation of a + bx* for x* = 150.
b) For what value x* is the estimated standard deviation of a + bx* smallest, and why?
Sxx = 23625.9 se = 273.03 a) Calculate the estimated standard deviation of a + bx* for x* = 150.
b) For what value x* is the estimated standard deviation of a + bx* smallest, and why?
Question
In a study of the bidding behavior when antique grandfather clocks are sold at auction, investigators analyzed the selling price (y) vs. the number of bidders at the auction of the grandfather clock (x). Summary quantities from this analysis yield: n = 32  Sxx = 249.97
 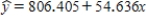 se = 367.197
a) Calculate the estimated standard deviation of a + bx* for x* = 10.
b) For what value x* is the estimated standard deviation of a + bx* smallest, and why?
Sxx = 249.97 se = 367.197 a) Calculate the estimated standard deviation of a + bx* for x* = 10.
b) For what value x* is the estimated standard deviation of a + bx* smallest, and why?
Question
A scatterplot, residual plot, and a boxplot of residuals from the Minitab output are based on summary quantities given for x = Weight of a fully-grown green iguana (in kilograms) and y = Length of its tail (in centimeters). Does it appear that the assumptions of the simple linear regression model are plausible? 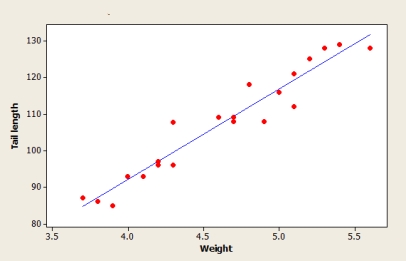
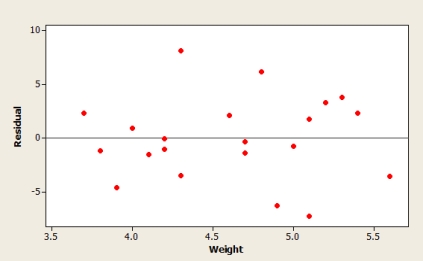
A) Yes, all the graphs show that a linear regression model is reasonable.
B) No, because the magnitude of residuals tends to decrease as the weight of species increases.
C) No, because the scatterplot shows that a curvilinear regression model is appropriate.
D) No, because the boxplot shows that vertical deviations are not normally distributed.
E) No, because some curvature is evident on the residual plot.
Question
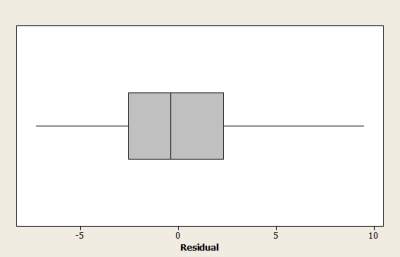
Researchers study the relationship between x = Average salary (in thousands of dollars) and y = Percent of total income spent on recreation and culture. The x values and the corresponding standardized residuals from a simple linear regression are as follows: 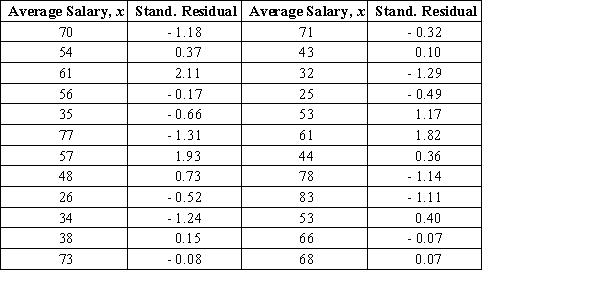 Construct a standardized residual plot. Based on this plot, does the simple linear regression model seems reasonable?
A) The plot suggests that the model is appropriate.
B) A potentially influential observation suggests that the model is not appropriate.
C) The outliers suggest that the model is not appropriate.
D) The curved pattern suggests that the model is not appropriate.
E) An estimated regression line is needed to make the assumptions.
Construct a standardized residual plot. Based on this plot, does the simple linear regression model seems reasonable? A) The plot suggests that the model is appropriate.
B) A potentially influential observation suggests that the model is not appropriate.
C) The outliers suggest that the model is not appropriate.
D) The curved pattern suggests that the model is not appropriate.
E) An estimated regression line is needed to make the assumptions.
Question
In a study of the bidding behavior when antique grandfather clocks are sold at auction, investigators analyzed the selling price (y) vs. the number of bidders at the auction of the grandfather clock (x). Summary quantities from this analysis yield: n = 32  Sxx = 249.97
  se = 367.197
a) Obtain a 95% confidence interval for α + β(10), the true mean selling price when the number of bidders is 10.
b) Obtain a 95% prediction interval for the price of a single grandfather clock when the number of bidders is 10.
Sxx = 249.97 se = 367.197 a) Obtain a 95% confidence interval for α + β(10), the true mean selling price when the number of bidders is 10.
b) Obtain a 95% prediction interval for the price of a single grandfather clock when the number of bidders is 10.
Question
The manufacturer of packaging materials examines the relationship between x = strength of the fiber and y = temperature during the production process. The obtained data are given in the table. 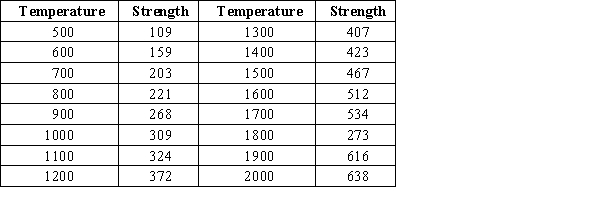 The accompanying fitted line plot is from Minitab.
 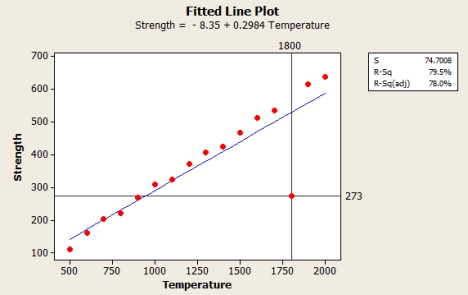 If the selected outlier (1800, 273) is deleted from the data set, how would it affect the R-squared value?
A) The changes in the R-squared value would be insignificant.
B) The R-squared value would increase.
C) The R-squared value can either increase or decrease, depending on other factors.
D) The R-squared value would decrease.
E) Removing outliers does not affect the R-squared value.
The accompanying fitted line plot is from Minitab. If the selected outlier (1800, 273) is deleted from the data set, how would it affect the R-squared value? A) The changes in the R-squared value would be insignificant.
B) The R-squared value would increase.
C) The R-squared value can either increase or decrease, depending on other factors.
D) The R-squared value would decrease.
E) Removing outliers does not affect the R-squared value.
Question
Question
The computer output given below shows a regression of Science Knowledge vs. Reading Comprehension scores for a random sample of sophomores. 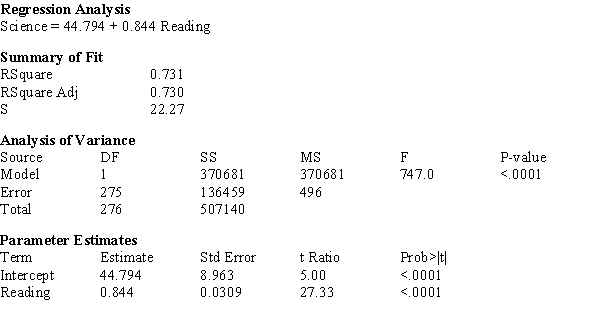
a) What is the estimated regression line?
b) What is the calculated value of sb?
c) What is the calculated value of se?
d) What is the calculated value of the t-ratio for the Model Utility Test?
e) Construct a 95% confidence interval for β.
a) What is the estimated regression line?
b) What is the calculated value of sb?
c) What is the calculated value of se?
d) What is the calculated value of the t-ratio for the Model Utility Test?
e) Construct a 95% confidence interval for β.
Question
The Iowa Tests of Educational Development are given each year to students around the country. Let x = the previous year's math scores and y = the current year's math scores for a sample of current sophomores who took the test both years. b = estimated slopw of the regression line = 0.9 a = estimated y intercept of the regression line = 35.0
a) What is the equation of the estimated regression line?
b) On the graph below, sketch the estimated regression line using the information above. Be sure to label and scale your axes correctly.
c) For a students with a score of 250 the previous year, what is the predicted score for the current year?
d) What is the average difference in math score that is associated with a 10-point difference in the previous year's math score?
e) The value of r2 is 0.74; interpret r2 in the context of this problem.
f) The value of se is 20.5. Interpret se in the context of this problem.
Question
An experiment was conducted to study the relationship between x = amount of new experimental fertilizer (kg/ha) and y = growth rate of the Madonna lilies stem (cm/week). Perform the Model Utility Test at the 0.05 level of significance using the Minitab output. 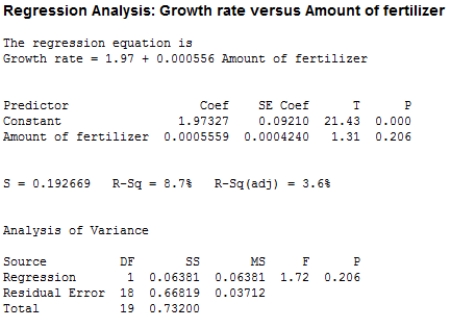
A) P-value < 0.05, thus the simple linear regression model is useful for predicting the growth rate of the Madonna lilies stem.
B) P-value < 0.05, thus there is no useful linear relationship between the amount of new experimental fertilizer and the growth rate of the Madonna lilies stem.
C) 0.05 < P-value, thus the simple linear regression model is useful for predicting the growth rate of the Madonna lilies stem.
D) 0.05 < P-value, thus there is no useful linear relationship between the amount of new experimental fertilizer and the growth rate of the Madonna lilies stem.
Question
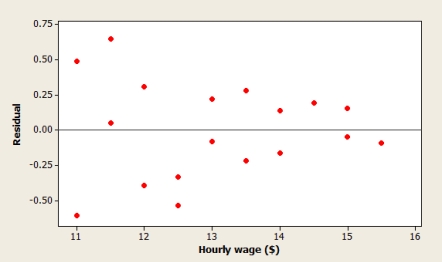
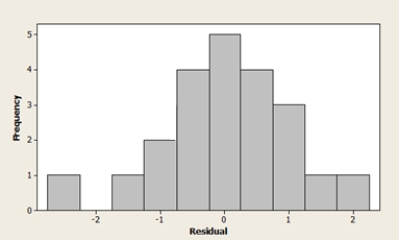
A manager of the restaurant chain examines how waiters' hourly wages affect the average service rating from visitors. A scatterplot of the data, a residual plot, and a histogram of standardized residuals are shown below. Are the assumptions of the simple linear regression model reasonable? 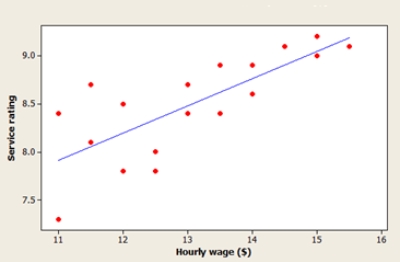
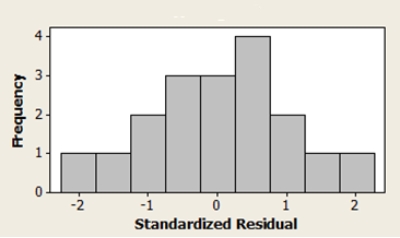
A) No, because the histogram of standardized residuals is skewed.
B) No, because the residual plot shows a curved pattern.
C) No, because the spread around the line on the residual plot does not appear to be constant.
D) No, because the residual plot indicates a large residual.
E) Yes, all the conditions for a linear regression are met.
Question
The computer output given below shows a regression of Social Studies Concepts vs. Reading Comprehension scores for a random sample of sophomores. Regression Analysis Social Studies = 76.56 + 0.731Reading 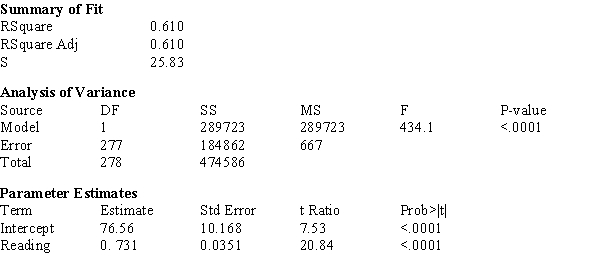
a) What is the estimated regression line?
b) What is the calculated value of sb?
c) What is the calculated value of se?
d) What is the calculated value of the t-ratio for the Model Utility Test?
e) Construct a 95% confidence interval for β.
a) What is the estimated regression line?
b) What is the calculated value of sb?
c) What is the calculated value of se?
d) What is the calculated value of the t-ratio for the Model Utility Test?
e) Construct a 95% confidence interval for β.
Question
In a study of the bidding behavior when antique grandfather clocks are sold at auction, investigators analyzed the selling price (y) and the age in years of the grandfather clock (x). Summary quantities from this analysis yield: n = 32  Sxx = 23625.9
 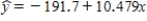 se = 273.03
a) Obtain a 95% confidence interval for α + β(150), the true mean selling price when the age of the grandfather clock is 150.
b) Obtain a 95% prediction interval for the price of a single grandfather clock when the age of the grandfather clock is 150.
Sxx = 23625.9 se = 273.03 a) Obtain a 95% confidence interval for α + β(150), the true mean selling price when the age of the grandfather clock is 150.
b) Obtain a 95% prediction interval for the price of a single grandfather clock when the age of the grandfather clock is 150.
Question
A simple linear regression model was used to describe the relationship between concentration y (measured in the scores of a specially designed test) and the room temperature x (in °F). A random sample of 15 observations was used to produce the accompanying Minitab output. Calculate a 95% confidence interval for β, the average change in the test score associated with a 1 °F increase in room temperature, using the output. Round your answers to three decimal places. 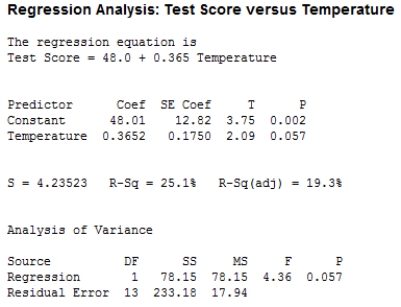
A) (−0.008, 0.738)
B) (−0.413, 1.143)
C) (−0.423, 1.154)
D) (−0.013, 0.743)
E) (−0.024, 0.749)
A) (−0.008, 0.738)
B) (−0.413, 1.143)
C) (−0.423, 1.154)
D) (−0.013, 0.743)
E) (−0.024, 0.749)
Question
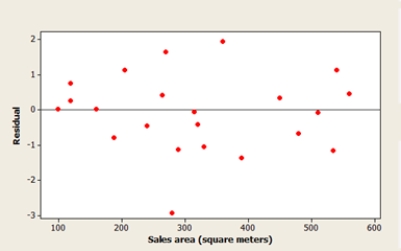
The Head of Special Projects and Planning of a network of shops develops a plan for opening new stores. He suggests that the annual revenue of a supermarket depends mainly on the size of the sales area. A scatterplot of the data, a residual plot, and a histogram of the residuals are shown below. What do the graphs suggest about the adequacy of the simple linear regression model? 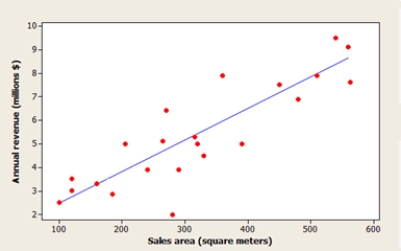
A) The model is not appropriate, because the histogram shows that the residuals are not normally distributed.
B) The model is not appropriate, because the residual plot shows a curved pattern.
C) The model is not appropriate, because the residual plot shows a potentially influential observation.
D) The model is not appropriate, because the residual plot indicates an outlier.
E) The model is appropriate, all the conditions for a linear regression are met.
Question
An experiment to study the relationship between x = head wind speed (m/s) and y = 100-m sprint time (seconds) resulted in the following summary statistics. n = 20 


 Calculate a 99% confidence interval for β, the average change in the 100-m finish time associated with a 0.1 (that is, 1 unit) increase in wind speed. Round your answers to four decimal places.
A) (−0.0379, 0.0722)
B) (0.172, 0.2573)
C) (0.0402, 0.153)
D) (0.0438, 0.1615)
E) (0.0635, 0.1741)
Calculate a 99% confidence interval for β, the average change in the 100-m finish time associated with a 0.1 (that is, 1 unit) increase in wind speed. Round your answers to four decimal places. A) (−0.0379, 0.0722)
B) (0.172, 0.2573)
C) (0.0402, 0.153)
D) (0.0438, 0.1615)
E) (0.0635, 0.1741)

Unlock Deck
Sign up to unlock the cards in this deck!
Unlock Deck
Unlock Deck
1/56
Play
Full screen (f)
Deck 13: Simple Linear Regression and Correlation: Inferential Methods
1
The test of independence involves testing H0 : ρ = 1 vs. H0 : ρ ≠ 1.
False
2
The simple linear regression model is a deterministic model.
False
3
The estimated standard deviation, se, is roughly the magnitude of a typical deviation from the least squares regression line.
True
4
The general form of additive probabilistic model is y = deterministic function + random deviation.
Unlock Deck
Unlock for access to all 56 flashcards in this deck.
Unlock Deck
k this deck
5
The estimated mean value of y is a + bx* when x has the value x*.
Unlock Deck
Unlock for access to all 56 flashcards in this deck.
Unlock Deck
k this deck
6
In the simple linear regression model, the point estimate and the point prediction are identical for a particular value of x.
Unlock Deck
Unlock for access to all 56 flashcards in this deck.
Unlock Deck
k this deck
7
The mean value of the statistic b is β.
Unlock Deck
Unlock for access to all 56 flashcards in this deck.
Unlock Deck
k this deck
8
In the simple linear regression model, α and β are fixed numbers that are usually unknown.
Unlock Deck
Unlock for access to all 56 flashcards in this deck.
Unlock Deck
k this deck
9
In the simple linear regression, the standard deviation of y is the same as the standard deviation of the random deviation e.
Unlock Deck
Unlock for access to all 56 flashcards in this deck.
Unlock Deck
k this deck
10
In the simple linear regression mode, σe depends on the value of x.
Unlock Deck
Unlock for access to all 56 flashcards in this deck.
Unlock Deck
k this deck
11
The expected change in the value of y for one unit change in x is α.
Unlock Deck
Unlock for access to all 56 flashcards in this deck.
Unlock Deck
k this deck
12
The standard deviation of the statistic b, σb, is small when σe and Sxx are both small.
Unlock Deck
Unlock for access to all 56 flashcards in this deck.
Unlock Deck
k this deck
13
The estimated standard deviation, se, has n − 1 degrees freedom.
Unlock Deck
Unlock for access to all 56 flashcards in this deck.
Unlock Deck
k this deck
14
The population correlation ρ is always between 0 and 1.
Unlock Deck
Unlock for access to all 56 flashcards in this deck.
Unlock Deck
k this deck
15
The standard deviation of a + bx* grows larger the farther x* is from .
. Unlock Deck
Unlock for access to all 56 flashcards in this deck.
Unlock Deck
k this deck
16
In the simple linear regression model, the randomness of e implies that y itself is subject to uncertainty.
Unlock Deck
Unlock for access to all 56 flashcards in this deck.
Unlock Deck
k this deck
17
The t-ratio for testing ρ = 0 is equivalent to the t-ratio for testing β = 0.
Unlock Deck
Unlock for access to all 56 flashcards in this deck.
Unlock Deck
k this deck
18
There is more uncertainty in predicting a single value of y than with estimating a mean value of α + βx*.
Unlock Deck
Unlock for access to all 56 flashcards in this deck.
Unlock Deck
k this deck
19
A standardized residual plot with spread increasing from left to right suggests that the variance of y is not the same at each x value.
Unlock Deck
Unlock for access to all 56 flashcards in this deck.
Unlock Deck
k this deck
20
The point estimate a + bx* is an unbiased statistic that can be used to estimate the mean value of y when x = x*.
Unlock Deck
Unlock for access to all 56 flashcards in this deck.
Unlock Deck
k this deck
21
The scatter plot and residual plot shown below are from a regression analysis of Prehistoric Native American projectile points. The lengths of the projectiles were regressed on the width of the projectile points. Using these plots categorize each of the Basic Assumptions of the simple linear regression model as one of the following:
a) Not checkable
b) Checked and met
c) Checked and not met
For all assumptions checked, explain what aspect of the graphs led you to your conclusion that the assumption was met or not met.
Using these plots categorize each of the Basic Assumptions of the simple linear regression model as one of the following: a) Not checkable
b) Checked and met
c) Checked and not met
For all assumptions checked, explain what aspect of the graphs led you to your conclusion that the assumption was met or not met.
Unlock Deck
Unlock for access to all 56 flashcards in this deck.
Unlock Deck
k this deck
22
The computer output given below shows a regression of Body Mass (g) vs. Wing Length (mm) for sphinx moths.
a) What is the estimated regression line?
b) What is the calculated value of sb?
c) What is the calculated value of se?
d) In a few sentences, interpret se in the context of this problem.
e) Using the computer output above, perform the Model Utility Test at the .05 level of significance.
f) Construct a 95% confidence interval for β.
Unlock Deck
Unlock for access to all 56 flashcards in this deck.
Unlock Deck
k this deck
23
In a random sample of large cities around the world, the ozone level (in parts per million) and the population (in millions) were measured. Fitting the simple linear regression model gave the estimated regression equation .
a) How would you interpret b = 16.6?
b) Substituting x = 3 gives = 58.69. Give two different interpretations of this number.
c) Do you think this equation should be used for predicting ozone in small towns in Iowa? Explain your response in a few sentences.
d) The value of r2 is not presented here, but explain how you would interpret r2 in the context of this problem.
. a) How would you interpret b = 16.6?
b) Substituting x = 3 gives
= 58.69. Give two different interpretations of this number. c) Do you think this equation should be used for predicting ozone in small towns in Iowa? Explain your response in a few sentences.
d) The value of r2 is not presented here, but explain how you would interpret r2 in the context of this problem.
Unlock Deck
Unlock for access to all 56 flashcards in this deck.
Unlock Deck
k this deck
24
In a study of the surface temperatures of vital (living) and non-vital (dead) teeth in a random sample of 32 adults seeking dental care at a university clinic, temperatures of vital and non-vital teeth were measured for each individual. The computer output shown below was generated.
a) What proportion of observed variation in the surface temperature of vital teeth can be explained by the surface temperature of non-vital teeth?
b) Does the simple linear regression model appear to be useful? Justify your response with specific references to the computer output.
c) The estimated standard deviation of a + bx* for x* = 30 is calculated as: sa+b(30) = 0.2417. Calculate a 95% confidence interval for the true average vital tooth temperature when the non-vital tooth temperature is 30 degrees centigrade.
d) In one individual, a single surface temperature for a non-vital tooth is found to be 30 degrees centigrade. Use a 95% prediction interval to predict the resulting temperature of a vital tooth.
Unlock Deck
Unlock for access to all 56 flashcards in this deck.
Unlock Deck
k this deck
25
The Iowa Tests of Educational Development are given each year to students around the country. Let x = the previous year's science scores and y = the current year's science scores for a sample of current sophomores who took the test both years. b = estimated slope of the regression line = 0.93 a = estimated y intercept of the regression line = 30.36
a) What is the equation of the estimated regression line?
b) On the graph below, sketch the estimated regression line using the information above. Be sure to label and scale your axes correctly.
c) For students with a score of 250 the previous year, what is the predicted score for the current year?
d) What is the average difference in science score that is associated with a 10-point difference in the previous year's science score?
e) The value of r2 is 0.71; interpret r2 in the context of this problem.
f) The value of se is 25.5. Interpret se in the context of this problem.
a) What is the equation of the estimated regression line?
b) On the graph below, sketch the estimated regression line using the information above. Be sure to label and scale your axes correctly.
c) For students with a score of 250 the previous year, what is the predicted score for the current year?
d) What is the average difference in science score that is associated with a 10-point difference in the previous year's science score?
e) The value of r2 is 0.71; interpret r2 in the context of this problem.
f) The value of se is 25.5. Interpret se in the context of this problem.
Unlock Deck
Unlock for access to all 56 flashcards in this deck.
Unlock Deck
k this deck
26
In a study of gender-typing of toys, parents and non-parents were asked to rate the gender appropriateness of toys on a scale of 1 (Definitely for girls) to 5 (Definitely for boys). The investigators did a regression analysis of the parents mean scores vs. the non-parents mean scores for each toy. A computer-generated normal probability plot of the residuals is shown below. Write a brief paragraph describing the plot. Based on your description recommend to the investigators whether or not the appropriate assumption is met for simple linear regression.
Write a brief paragraph describing the plot. Based on your description recommend to the investigators whether or not the appropriate assumption is met for simple linear regression. Unlock Deck
Unlock for access to all 56 flashcards in this deck.
Unlock Deck
k this deck
27
Let x be the number of pages in a geometry text book and y be the cost of the book (in dollars). Suppose that x and y are related according to the simple linear regression model with β = slope of the population regression line = 0.05 α = y intercept of population regression line = 30.0
a) What is the equation of the population regression line?
b) On the graph below, sketch the population regression line using the information above. Be sure to label and scale your axes correctly.
c) For a geometry book of 300 pages, what is the predicted cost in dollars?
d) What is the average change in price that is associated with a one-page increase in size of the geometry book?
e) What is the average change in price that is associated with a 20-page increase in size of the geometry book?
a) What is the equation of the population regression line?
b) On the graph below, sketch the population regression line using the information above. Be sure to label and scale your axes correctly.
c) For a geometry book of 300 pages, what is the predicted cost in dollars?
d) What is the average change in price that is associated with a one-page increase in size of the geometry book?
e) What is the average change in price that is associated with a 20-page increase in size of the geometry book?
Unlock Deck
Unlock for access to all 56 flashcards in this deck.
Unlock Deck
k this deck
28
In a forensic study of the relation between time since death (hrs) and the thigh temperature in deer (F), a regression analysis of y = time since death on x = thigh temperature was performed. From their examination of the data the investigators felt that the assumptions of the linear regression model were satisfied. Summary quantities from this analysis yield:
a) Calculate the estimated standard deviation of a + bx* for x* = 80.
b) For what value x* is the estimated standard deviation of a + bx* smallest, and why?
a) Calculate the estimated standard deviation of a + bx* for x* = 80.
b) For what value x* is the estimated standard deviation of a + bx* smallest, and why?
Unlock Deck
Unlock for access to all 56 flashcards in this deck.
Unlock Deck
k this deck
29
A random sample of steelhead trout was selected; the length of the trout in inches and the weight of the trout in pounds were measured. Fitting the simple linear regression model gave the estimated regression equation .
a) How would you interpret b = 0.976?
b) Substituting x = 30 gives = 9.98. Give two different interpretations of this number.
c) What happens if you predict the weight of an 18-inch trout? In a few sentences, explain why do you think this has occurred.
d) The value of r2 is not presented here, but explain how you would interpret r2 in the context of this problem.
. a) How would you interpret b = 0.976?
b) Substituting x = 30 gives
= 9.98. Give two different interpretations of this number. c) What happens if you predict the weight of an 18-inch trout? In a few sentences, explain why do you think this has occurred.
d) The value of r2 is not presented here, but explain how you would interpret r2 in the context of this problem.
Unlock Deck
Unlock for access to all 56 flashcards in this deck.
Unlock Deck
k this deck
30
A veterinary graduate student is studying the relationship between the weight of one year-old golden retrievers in pounds (y) and the amount of dog food the dog is fed each day in pounds (x). A random sample of 10 golden retrievers yielded the following data and summary statistics.
a) Write the estimated regression line below.
b) On the graph below, sketch the sample regression line using the information above. Be sure to label and scale your axes correctly.
c) What is your estimate of the average change in weight associated with a 1-pound increase in daily intake of dog food? d) What weight would you predict for a randomly selected golden retriever who is fed 1.2 pounds of dog food per day?
e) The value of se is 4.860. Interpret se in the context of this problem.
Unlock Deck
Unlock for access to all 56 flashcards in this deck.
Unlock Deck
k this deck
31
In a forensic study of the relation between time since death (hrs) and the nostril temperature in deer (F) , a regression analysis of y = time since death on x = nostril temperature was performed. Summary quantities from this analysis yield: n = 384 Sxx = 49,999.464 se = 1.997
a) Calculate the estimated standard deviation of a + bx* for x* = 80.
b) For what value x* is the estimated standard deviation of a + bx* smallest, and why?
Sxx = 49,999.464 se = 1.997 a) Calculate the estimated standard deviation of a + bx* for x* = 80.
b) For what value x* is the estimated standard deviation of a + bx* smallest, and why?
Unlock Deck
Unlock for access to all 56 flashcards in this deck.
Unlock Deck
k this deck
32
The scatter plot and residual plot shown below is from a regression analysis of Prehistoric Native American projectile points. The widths of the projectiles were regressed on the length of the projectile points. Using these plots categorize each of the Basic Assumptions of the simple linear regression model as one of the following:
a) Not checkable
b) Checked and met
c) Checked and not met
For all assumptions checked, explain what aspect of the graphs led you to your conclusion that the assumption was met or not met.
Using these plots categorize each of the Basic Assumptions of the simple linear regression model as one of the following: a) Not checkable
b) Checked and met
c) Checked and not met
For all assumptions checked, explain what aspect of the graphs led you to your conclusion that the assumption was met or not met.
Unlock Deck
Unlock for access to all 56 flashcards in this deck.
Unlock Deck
k this deck
33
A study investigating the relationship between the major league batting average of non-pitching rookies (y) and their career minor league batting average (x) yields the following data:
a) Write the estimated regression line below.
b) On the graph below, sketch the sample regression line using the information above. Be sure to label and scale your axes correctly.
c) What is your estimate of the average change in major-league batting average associated with an increase of 0.050 in the career minor-league batting average?
d) What major-league batting average would you predict for a randomly selected individual with a career minor-league batting average of 0.300?
e) The value of se is 0.015. Interpret se in the context of this problem.
Unlock Deck
Unlock for access to all 56 flashcards in this deck.
Unlock Deck
k this deck
34
What are the four "Basic Assumptions" of the simple linear regression model?
Unlock Deck
Unlock for access to all 56 flashcards in this deck.
Unlock Deck
k this deck
35
When the four basic assumptions for a simple linear regression model are satisfied,
a) What is μb equal to?
b) What is σb equal to? c) What is the shape of the sampling distribution of b?
d) What is the probability distribution of the standardized variable, ?
a) What is μb equal to?
b) What is σb equal to? c) What is the shape of the sampling distribution of b?
d) What is the probability distribution of the standardized variable,
? Unlock Deck
Unlock for access to all 56 flashcards in this deck.
Unlock Deck
k this deck
36
Let x be the number of pages in a statistics text book and y be the cost of the book (in dollars.) Suppose that x and y are related according to the simple linear regression model with β = slope of the population regression line = 0.075 α = y intercept of population regression line = 25.0
a) What is the equation of the population regression line?
b) On the graph below, sketch the population regression line using the information above. Be sure to label and scale your axes correctly.
c) For a statistics book of 900 pages, what is the predicted cost in dollars?
d) What is the average change in price that is associated with a one-page increase in size of a statistics book?
e) What is the average change in price that is associated with a 20-page increase in size of a statistics book?
a) What is the equation of the population regression line?
b) On the graph below, sketch the population regression line using the information above. Be sure to label and scale your axes correctly.
c) For a statistics book of 900 pages, what is the predicted cost in dollars?
d) What is the average change in price that is associated with a one-page increase in size of a statistics book?
e) What is the average change in price that is associated with a 20-page increase in size of a statistics book?
Unlock Deck
Unlock for access to all 56 flashcards in this deck.
Unlock Deck
k this deck
37
A residual is a deviation from the population regression line.
Unlock Deck
Unlock for access to all 56 flashcards in this deck.
Unlock Deck
k this deck
38
The computer output given below shows a regression of Wing Length (mm) vs. Body Mass (g) for sphinx moths.
a) What is the estimated regression line?
b) What is the calculated value of sb?
c) What is the calculated value of se?
d) In a few sentences, interpret se in the context of this problem.
e) Using the computer output above, perform the Model Utility Test at the .05 level of significance.
f) Construct a 95% confidence interval for β.
Unlock Deck
Unlock for access to all 56 flashcards in this deck.
Unlock Deck
k this deck
39
In a study of gender typing of toys, fathers and mothers were asked to rate the gender appropriateness of toys on a scale of 1 (Definitely for girls) to 5 (Definitely for boys). The investigators did a regression analysis of the fathers' mean ratings vs. the mothers mean ratings for each toy. A computer-generated normal probability plot of the residuals is shown below. Write a brief paragraph describing the plot. Based on your description recommend to the investigators whether or not the appropriate assumption is met for simple linear regression.
Write a brief paragraph describing the plot. Based on your description recommend to the investigators whether or not the appropriate assumption is met for simple linear regression. Unlock Deck
Unlock for access to all 56 flashcards in this deck.
Unlock Deck
k this deck
40
In a study of the surface temperatures of vital (living) and non-vital (dead) teeth in a random sample of 32 adults seeking dental care at a university clinic, temperatures of vital and non-vital teeth were measured for each individual. From their examination of the data the investigators felt that the assumptions of the linear regression model were satisfied. The computer output shown below was generated.
a) What proportion of observed variation in the surface temperature of non-vital teeth can be explained by the surface temperature of vital teeth?
b) Does the simple linear regression model appear to be useful? Justify your response with specific references to the computer output.
c) The estimated standard deviation of a + bx* for x* = 30 is calculated as: sa+b(30) = 0.1665. Calculate a 95% confidence interval for the true average non-vital tooth temperature when the vital tooth temperature is 30 degrees centigrade.
d) In one individual, a single surface temperature for a vital tooth is found to be 30 degrees centigrade. Use a 95% prediction interval to predict the resulting temperature of a non-vital tooth.
Unlock Deck
Unlock for access to all 56 flashcards in this deck.
Unlock Deck
k this deck
41
In a study of the bidding behavior when antique grandfather clocks are sold at auction, investigators analyzed the selling price (y) and the age in years of the grandfather clock (x). Summary quantities from this analysis yield: n = 32 Sxx = 23625.9 se = 273.03
a) Calculate the estimated standard deviation of a + bx* for x* = 150.
b) For what value x* is the estimated standard deviation of a + bx* smallest, and why?
Sxx = 23625.9 se = 273.03 a) Calculate the estimated standard deviation of a + bx* for x* = 150.
b) For what value x* is the estimated standard deviation of a + bx* smallest, and why?
Unlock Deck
Unlock for access to all 56 flashcards in this deck.
Unlock Deck
k this deck
42
In a study of the bidding behavior when antique grandfather clocks are sold at auction, investigators analyzed the selling price (y) vs. the number of bidders at the auction of the grandfather clock (x). Summary quantities from this analysis yield: n = 32 Sxx = 249.97 se = 367.197
a) Calculate the estimated standard deviation of a + bx* for x* = 10.
b) For what value x* is the estimated standard deviation of a + bx* smallest, and why?
Sxx = 249.97 se = 367.197 a) Calculate the estimated standard deviation of a + bx* for x* = 10.
b) For what value x* is the estimated standard deviation of a + bx* smallest, and why?
Unlock Deck
Unlock for access to all 56 flashcards in this deck.
Unlock Deck
k this deck
43
A scatterplot, residual plot, and a boxplot of residuals from the Minitab output are based on summary quantities given for x = Weight of a fully-grown green iguana (in kilograms) and y = Length of its tail (in centimeters). Does it appear that the assumptions of the simple linear regression model are plausible?
A) Yes, all the graphs show that a linear regression model is reasonable.
B) No, because the magnitude of residuals tends to decrease as the weight of species increases.
C) No, because the scatterplot shows that a curvilinear regression model is appropriate.
D) No, because the boxplot shows that vertical deviations are not normally distributed.
E) No, because some curvature is evident on the residual plot.
Unlock Deck
Unlock for access to all 56 flashcards in this deck.
Unlock Deck
k this deck
44
Researchers study the relationship between x = Average salary (in thousands of dollars) and y = Percent of total income spent on recreation and culture. The x values and the corresponding standardized residuals from a simple linear regression are as follows: Construct a standardized residual plot. Based on this plot, does the simple linear regression model seems reasonable?
A) The plot suggests that the model is appropriate.
B) A potentially influential observation suggests that the model is not appropriate.
C) The outliers suggest that the model is not appropriate.
D) The curved pattern suggests that the model is not appropriate.
E) An estimated regression line is needed to make the assumptions.
Construct a standardized residual plot. Based on this plot, does the simple linear regression model seems reasonable? A) The plot suggests that the model is appropriate.
B) A potentially influential observation suggests that the model is not appropriate.
C) The outliers suggest that the model is not appropriate.
D) The curved pattern suggests that the model is not appropriate.
E) An estimated regression line is needed to make the assumptions.
Unlock Deck
Unlock for access to all 56 flashcards in this deck.
Unlock Deck
k this deck
45
In a study of the bidding behavior when antique grandfather clocks are sold at auction, investigators analyzed the selling price (y) vs. the number of bidders at the auction of the grandfather clock (x). Summary quantities from this analysis yield: n = 32 Sxx = 249.97 se = 367.197
a) Obtain a 95% confidence interval for α + β(10), the true mean selling price when the number of bidders is 10.
b) Obtain a 95% prediction interval for the price of a single grandfather clock when the number of bidders is 10.
Sxx = 249.97 se = 367.197 a) Obtain a 95% confidence interval for α + β(10), the true mean selling price when the number of bidders is 10.
b) Obtain a 95% prediction interval for the price of a single grandfather clock when the number of bidders is 10.
Unlock Deck
Unlock for access to all 56 flashcards in this deck.
Unlock Deck
k this deck
46
The manufacturer of packaging materials examines the relationship between x = strength of the fiber and y = temperature during the production process. The obtained data are given in the table. The accompanying fitted line plot is from Minitab. If the selected outlier (1800, 273) is deleted from the data set, how would it affect the R-squared value?
A) The changes in the R-squared value would be insignificant.
B) The R-squared value would increase.
C) The R-squared value can either increase or decrease, depending on other factors.
D) The R-squared value would decrease.
E) Removing outliers does not affect the R-squared value.
The accompanying fitted line plot is from Minitab. If the selected outlier (1800, 273) is deleted from the data set, how would it affect the R-squared value? A) The changes in the R-squared value would be insignificant.
B) The R-squared value would increase.
C) The R-squared value can either increase or decrease, depending on other factors.
D) The R-squared value would decrease.
E) Removing outliers does not affect the R-squared value.
Unlock Deck
Unlock for access to all 56 flashcards in this deck.
Unlock Deck
k this deck
47
In which case is the confidence interval for β narrow?
A) When b is large, implying a relatively precise knowledge of the value of β.
B) When sb is large, implying a relatively precise knowledge of the value of t.
C) When b is small, implying a relatively precise knowledge of the value of β.
D) When n is large, implying a relatively precise knowledge of the value of t.
E) When sb is small, implying a relatively precise knowledge of the value of β.
Unlock Deck
Unlock for access to all 56 flashcards in this deck.
Unlock Deck
k this deck
48
The computer output given below shows a regression of Science Knowledge vs. Reading Comprehension scores for a random sample of sophomores.
a) What is the estimated regression line?
b) What is the calculated value of sb?
c) What is the calculated value of se?
d) What is the calculated value of the t-ratio for the Model Utility Test?
e) Construct a 95% confidence interval for β.
a) What is the estimated regression line?
b) What is the calculated value of sb?
c) What is the calculated value of se?
d) What is the calculated value of the t-ratio for the Model Utility Test?
e) Construct a 95% confidence interval for β.
Unlock Deck
Unlock for access to all 56 flashcards in this deck.
Unlock Deck
k this deck
49
The Iowa Tests of Educational Development are given each year to students around the country. Let x = the previous year's math scores and y = the current year's math scores for a sample of current sophomores who took the test both years. b = estimated slopw of the regression line = 0.9 a = estimated y intercept of the regression line = 35.0
a) What is the equation of the estimated regression line?
b) On the graph below, sketch the estimated regression line using the information above. Be sure to label and scale your axes correctly.
c) For a students with a score of 250 the previous year, what is the predicted score for the current year?
d) What is the average difference in math score that is associated with a 10-point difference in the previous year's math score?
e) The value of r2 is 0.74; interpret r2 in the context of this problem.
f) The value of se is 20.5. Interpret se in the context of this problem.
a) What is the equation of the estimated regression line?
b) On the graph below, sketch the estimated regression line using the information above. Be sure to label and scale your axes correctly.
c) For a students with a score of 250 the previous year, what is the predicted score for the current year?
d) What is the average difference in math score that is associated with a 10-point difference in the previous year's math score?
e) The value of r2 is 0.74; interpret r2 in the context of this problem.
f) The value of se is 20.5. Interpret se in the context of this problem.
Unlock Deck
Unlock for access to all 56 flashcards in this deck.
Unlock Deck
k this deck
50
An experiment was conducted to study the relationship between x = amount of new experimental fertilizer (kg/ha) and y = growth rate of the Madonna lilies stem (cm/week). Perform the Model Utility Test at the 0.05 level of significance using the Minitab output.
A) P-value < 0.05, thus the simple linear regression model is useful for predicting the growth rate of the Madonna lilies stem.
B) P-value < 0.05, thus there is no useful linear relationship between the amount of new experimental fertilizer and the growth rate of the Madonna lilies stem.
C) 0.05 < P-value, thus the simple linear regression model is useful for predicting the growth rate of the Madonna lilies stem.
D) 0.05 < P-value, thus there is no useful linear relationship between the amount of new experimental fertilizer and the growth rate of the Madonna lilies stem.
Unlock Deck
Unlock for access to all 56 flashcards in this deck.
Unlock Deck
k this deck
51
A manager of the restaurant chain examines how waiters' hourly wages affect the average service rating from visitors. A scatterplot of the data, a residual plot, and a histogram of standardized residuals are shown below. Are the assumptions of the simple linear regression model reasonable?
A) No, because the histogram of standardized residuals is skewed.
B) No, because the residual plot shows a curved pattern.
C) No, because the spread around the line on the residual plot does not appear to be constant.
D) No, because the residual plot indicates a large residual.
E) Yes, all the conditions for a linear regression are met.
Unlock Deck
Unlock for access to all 56 flashcards in this deck.
Unlock Deck
k this deck
52
The computer output given below shows a regression of Social Studies Concepts vs. Reading Comprehension scores for a random sample of sophomores. Regression Analysis Social Studies = 76.56 + 0.731Reading
a) What is the estimated regression line?
b) What is the calculated value of sb?
c) What is the calculated value of se?
d) What is the calculated value of the t-ratio for the Model Utility Test?
e) Construct a 95% confidence interval for β.
a) What is the estimated regression line?
b) What is the calculated value of sb?
c) What is the calculated value of se?
d) What is the calculated value of the t-ratio for the Model Utility Test?
e) Construct a 95% confidence interval for β.
Unlock Deck
Unlock for access to all 56 flashcards in this deck.
Unlock Deck
k this deck
53
In a study of the bidding behavior when antique grandfather clocks are sold at auction, investigators analyzed the selling price (y) and the age in years of the grandfather clock (x). Summary quantities from this analysis yield: n = 32 Sxx = 23625.9 se = 273.03
a) Obtain a 95% confidence interval for α + β(150), the true mean selling price when the age of the grandfather clock is 150.
b) Obtain a 95% prediction interval for the price of a single grandfather clock when the age of the grandfather clock is 150.
Sxx = 23625.9 se = 273.03 a) Obtain a 95% confidence interval for α + β(150), the true mean selling price when the age of the grandfather clock is 150.
b) Obtain a 95% prediction interval for the price of a single grandfather clock when the age of the grandfather clock is 150.
Unlock Deck
Unlock for access to all 56 flashcards in this deck.
Unlock Deck
k this deck
54
A simple linear regression model was used to describe the relationship between concentration y (measured in the scores of a specially designed test) and the room temperature x (in °F). A random sample of 15 observations was used to produce the accompanying Minitab output. Calculate a 95% confidence interval for β, the average change in the test score associated with a 1 °F increase in room temperature, using the output. Round your answers to three decimal places.
A) (−0.008, 0.738)
B) (−0.413, 1.143)
C) (−0.423, 1.154)
D) (−0.013, 0.743)
E) (−0.024, 0.749)
A) (−0.008, 0.738)
B) (−0.413, 1.143)
C) (−0.423, 1.154)
D) (−0.013, 0.743)
E) (−0.024, 0.749)
Unlock Deck
Unlock for access to all 56 flashcards in this deck.
Unlock Deck
k this deck
55
The Head of Special Projects and Planning of a network of shops develops a plan for opening new stores. He suggests that the annual revenue of a supermarket depends mainly on the size of the sales area. A scatterplot of the data, a residual plot, and a histogram of the residuals are shown below. What do the graphs suggest about the adequacy of the simple linear regression model?
A) The model is not appropriate, because the histogram shows that the residuals are not normally distributed.
B) The model is not appropriate, because the residual plot shows a curved pattern.
C) The model is not appropriate, because the residual plot shows a potentially influential observation.
D) The model is not appropriate, because the residual plot indicates an outlier.
E) The model is appropriate, all the conditions for a linear regression are met.
Unlock Deck
Unlock for access to all 56 flashcards in this deck.
Unlock Deck
k this deck
56
An experiment to study the relationship between x = head wind speed (m/s) and y = 100-m sprint time (seconds) resulted in the following summary statistics. n = 20 Calculate a 99% confidence interval for β, the average change in the 100-m finish time associated with a 0.1 (that is, 1 unit) increase in wind speed. Round your answers to four decimal places.
A) (−0.0379, 0.0722)
B) (0.172, 0.2573)
C) (0.0402, 0.153)
D) (0.0438, 0.1615)
E) (0.0635, 0.1741)
Calculate a 99% confidence interval for β, the average change in the 100-m finish time associated with a 0.1 (that is, 1 unit) increase in wind speed. Round your answers to four decimal places. A) (−0.0379, 0.0722)
B) (0.172, 0.2573)
C) (0.0402, 0.153)
D) (0.0438, 0.1615)
E) (0.0635, 0.1741)
Unlock Deck
Unlock for access to all 56 flashcards in this deck.
Unlock Deck
k this deck
Unlock Deck
Unlock for access to all 56 flashcards in this deck.


