Exam 13: Simple Linear Regression and Correlation: Inferential Methods
Exam 1: The Role of Statistics and the Data Analysis Process17 Questions
Exam 2: Collecting Data Sensibly39 Questions
Exam 3: Graphical Methods for Describing Data25 Questions
Exam 4: Numerical Methods for Describing Data26 Questions
Exam 5: Summarizing Bivariate Data37 Questions
Exam 6: Probability34 Questions
Exam 7: Random Variables and Probability Distributions45 Questions
Exam 8: Sampling Variability and Sampling Distributions27 Questions
Exam 9: Estimation Using a Single Sample46 Questions
Exam 10: Hypothesis Testing Using a Single Sample37 Questions
Exam 11: Comparing Two Populations or Treatments42 Questions
Exam 12: The Analysis of Categorical Data and Goodness-Of-Fit Tests21 Questions
Exam 13: Simple Linear Regression and Correlation: Inferential Methods56 Questions
Exam 14: Multiple Regression Analysis38 Questions
Exam 15: Analysis of Variance40 Questions
Exam 16: Nonparametric Distribution-Free Statistical Methods15 Questions
Select questions type
The expected change in the value of y for one unit change in x is α.
Free
(True/False)
4.9/5  (35)
(35)
Correct Answer: Verified
False
A standardized residual plot with spread increasing from left to right suggests that the variance of y is not the same at each x value.
Free
(True/False)
4.8/5 (27)
Correct Answer:Verified
True
The Iowa Tests of Educational Development are given each year to students around the country. Let x = the previous year's science scores and y = the current year's science scores for a sample of current sophomores who took the test both years. b = estimated slope of the regression line = 0.93 a = estimated y intercept of the regression line = 30.36
a) What is the equation of the estimated regression line?
b) On the graph below, sketch the estimated regression line using the information above. Be sure to label and scale your axes correctly.  c) For students with a score of 250 the previous year, what is the predicted score for the current year?
d) What is the average difference in science score that is associated with a 10-point difference in the previous year's science score?
e) The value of r2 is 0.71; interpret r2 in the context of this problem.
f) The value of se is 25.5. Interpret se in the context of this problem.
c) For students with a score of 250 the previous year, what is the predicted score for the current year?
d) What is the average difference in science score that is associated with a 10-point difference in the previous year's science score?
e) The value of r2 is 0.71; interpret r2 in the context of this problem.
f) The value of se is 25.5. Interpret se in the context of this problem.
Free
(Essay)
4.9/5 (37)
Correct Answer:Verified
a) 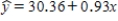
b) See graph: 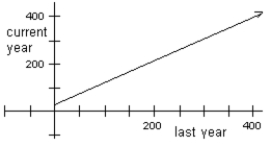
c) 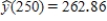
d) 10b = 9.3 points
e) about 71 percent of the variation in this year's science scores can be attributed to differences from last year.
f) se measures typical variation about the regression line. For a given score on last year's test, students this year will typically vary about 25.5 points from the predicted value.
In a study of the surface temperatures of vital (living) and non-vital (dead) teeth in a random sample of 32 adults seeking dental care at a university clinic, temperatures of vital and non-vital teeth were measured for each individual. The computer output shown below was generated. 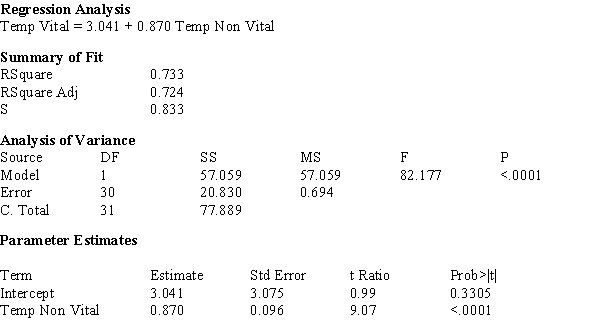
a) What proportion of observed variation in the surface temperature of vital teeth can be explained by the surface temperature of non-vital teeth?
b) Does the simple linear regression model appear to be useful? Justify your response with specific references to the computer output.
c) The estimated standard deviation of a + bx* for x* = 30 is calculated as: sa+b(30) = 0.2417. Calculate a 95% confidence interval for the true average vital tooth temperature when the non-vital tooth temperature is 30 degrees centigrade.
d) In one individual, a single surface temperature for a non-vital tooth is found to be 30 degrees centigrade. Use a 95% prediction interval to predict the resulting temperature of a vital tooth.
(Essay)
4.8/5 (37)
In a forensic study of the relation between time since death (hrs) and the nostril temperature in deer (F) , a regression analysis of y = time since death on x = nostril temperature was performed. Summary quantities from this analysis yield: n = 384  Sxx = 49,999.464
  se = 1.997
a) Calculate the estimated standard deviation of a + bx* for x* = 80.
b) For what value x* is the estimated standard deviation of a + bx* smallest, and why?
se = 1.997
a) Calculate the estimated standard deviation of a + bx* for x* = 80.
b) For what value x* is the estimated standard deviation of a + bx* smallest, and why?
(Essay)
4.7/5 (38)
In a study of the surface temperatures of vital (living) and non-vital (dead) teeth in a random sample of 32 adults seeking dental care at a university clinic, temperatures of vital and non-vital teeth were measured for each individual. From their examination of the data the investigators felt that the assumptions of the linear regression model were satisfied. The computer output shown below was generated. 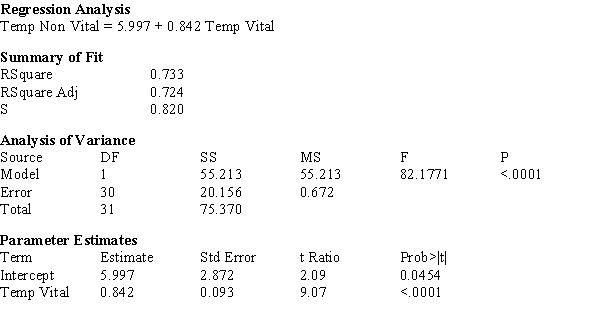
a) What proportion of observed variation in the surface temperature of non-vital teeth can be explained by the surface temperature of vital teeth?
b) Does the simple linear regression model appear to be useful? Justify your response with specific references to the computer output.
c) The estimated standard deviation of a + bx* for x* = 30 is calculated as: sa+b(30) = 0.1665. Calculate a 95% confidence interval for the true average non-vital tooth temperature when the vital tooth temperature is 30 degrees centigrade.
d) In one individual, a single surface temperature for a vital tooth is found to be 30 degrees centigrade. Use a 95% prediction interval to predict the resulting temperature of a non-vital tooth.
(Essay)
4.8/5 (34)
The standard deviation of a + bx* grows larger the farther x* is from  .
.
(True/False)
4.7/5 (37)
What are the four "Basic Assumptions" of the simple linear regression model?
(Essay)
4.8/5 (27)
An experiment to study the relationship between x = head wind speed (m/s) and y = 100-m sprint time (seconds) resulted in the following summary statistics. n = 20 


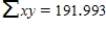 Calculate a 99% confidence interval for β, the average change in the 100-m finish time associated with a 0.1 (that is, 1 unit) increase in wind speed. Round your answers to four decimal places.
(Multiple Choice)
4.7/5 (35)
The test of independence involves testing H0 : ρ = 1 vs. H0 : ρ ≠ 1.
(True/False)
4.8/5 (30)
The point estimate a + bx* is an unbiased statistic that can be used to estimate the mean value of y when x = x*.
(True/False)
4.8/5 (27)
A simple linear regression model was used to describe the relationship between concentration y (measured in the scores of a specially designed test) and the room temperature x (in °F). A random sample of 15 observations was used to produce the accompanying Minitab output. Calculate a 95% confidence interval for β, the average change in the test score associated with a 1 °F increase in room temperature, using the output. Round your answers to three decimal places. 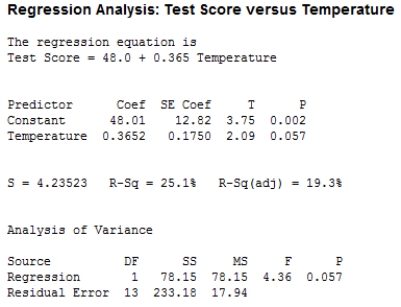
(Multiple Choice)
4.7/5 (39)
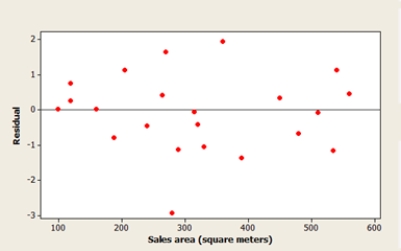
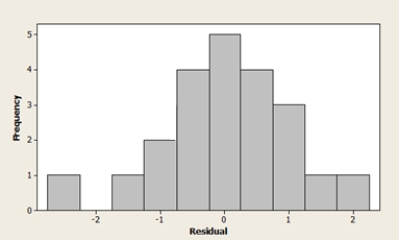
The Head of Special Projects and Planning of a network of shops develops a plan for opening new stores. He suggests that the annual revenue of a supermarket depends mainly on the size of the sales area. A scatterplot of the data, a residual plot, and a histogram of the residuals are shown below. What do the graphs suggest about the adequacy of the simple linear regression model? 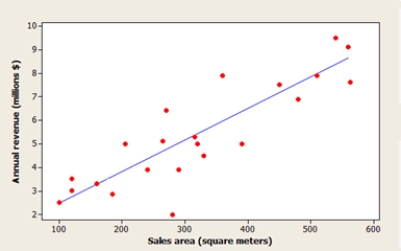
(Multiple Choice)
4.7/5 (36)
Let x be the number of pages in a statistics text book and y be the cost of the book (in dollars.) Suppose that x and y are related according to the simple linear regression model with β = slope of the population regression line = 0.075 α = y intercept of population regression line = 25.0
a) What is the equation of the population regression line?
b) On the graph below, sketch the population regression line using the information above. Be sure to label and scale your axes correctly.  c) For a statistics book of 900 pages, what is the predicted cost in dollars?
d) What is the average change in price that is associated with a one-page increase in size of a statistics book?
e) What is the average change in price that is associated with a 20-page increase in size of a statistics book?
c) For a statistics book of 900 pages, what is the predicted cost in dollars?
d) What is the average change in price that is associated with a one-page increase in size of a statistics book?
e) What is the average change in price that is associated with a 20-page increase in size of a statistics book?
(Essay)
4.9/5 (37)
The computer output given below shows a regression of Body Mass (g) vs. Wing Length (mm) for sphinx moths. 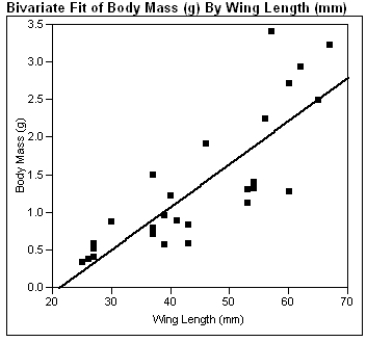
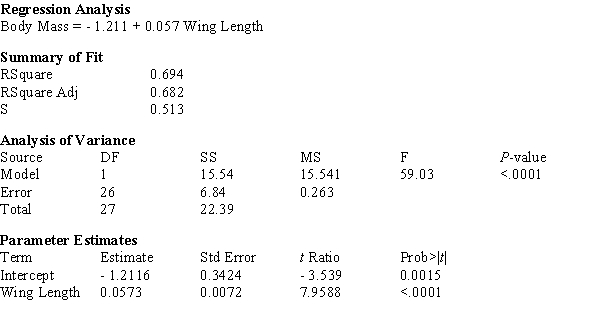
a) What is the estimated regression line?
b) What is the calculated value of sb?
c) What is the calculated value of se?
d) In a few sentences, interpret se in the context of this problem.
e) Using the computer output above, perform the Model Utility Test at the .05 level of significance.
f) Construct a 95% confidence interval for β.
(Essay)
4.9/5 (35)
The standard deviation of the statistic b, σb, is small when σe and Sxx are both small.
(True/False)
4.8/5 (33)
In the simple linear regression model, the randomness of e implies that y itself is subject to uncertainty.
(True/False)
4.8/5 (33)
The Iowa Tests of Educational Development are given each year to students around the country. Let x = the previous year's math scores and y = the current year's math scores for a sample of current sophomores who took the test both years. b = estimated slopw of the regression line = 0.9 a = estimated y intercept of the regression line = 35.0
a) What is the equation of the estimated regression line?
b) On the graph below, sketch the estimated regression line using the information above. Be sure to label and scale your axes correctly.  c) For a students with a score of 250 the previous year, what is the predicted score for the current year?
d) What is the average difference in math score that is associated with a 10-point difference in the previous year's math score?
e) The value of r2 is 0.74; interpret r2 in the context of this problem.
f) The value of se is 20.5. Interpret se in the context of this problem.
c) For a students with a score of 250 the previous year, what is the predicted score for the current year?
d) What is the average difference in math score that is associated with a 10-point difference in the previous year's math score?
e) The value of r2 is 0.74; interpret r2 in the context of this problem.
f) The value of se is 20.5. Interpret se in the context of this problem.
(Essay)
5.0/5 (35)
Filters
- Essay(0)
- Multiple Choice(0)
- Short Answer(0)
- True False(0)
- Matching(0)