Deck 14: Descriptive Statistics
Full screen (f)
Question
Question
Question
Question
Question
Use the following frequency distribution to answer questions
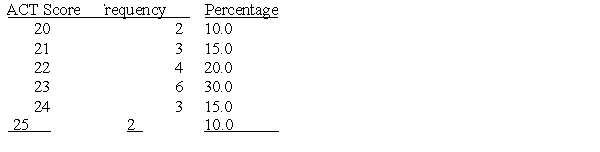
Which of the following is the lowest score in the frequency distribution?
A) 23
B) 10
C) 20
D) 25
Which of the following is the lowest score in the frequency distribution?
A) 23
B) 10
C) 20
D) 25
Question
Question
Question
Use the following frequency distribution to answer questions
What is the most frequently occurring score in the frequency distribution?
A) 23
B) 10
C) 20
D) 25
What is the most frequently occurring score in the frequency distribution?
A) 23
B) 10
C) 20
D) 25
Question
Question
Use the following frequency distribution to answer questions
Which of the following graphs is most appropriate when displaying categorical data?
A) scatterplot
B) bar graph
C) histogram
D) any of the above
Which of the following graphs is most appropriate when displaying categorical data?
A) scatterplot
B) bar graph
C) histogram
D) any of the above
Question
Use the following frequency distribution to answer questions
Which of the following ACT scores is the mode for the data shown in the frequency distribution?
A) 23
B) 10
C) 20
D) 25
Which of the following ACT scores is the mode for the data shown in the frequency distribution?
A) 23
B) 10
C) 20
D) 25
Question
Question
Question
What type of graph would be appropriate to display the frequency table of cat ownership shown below? 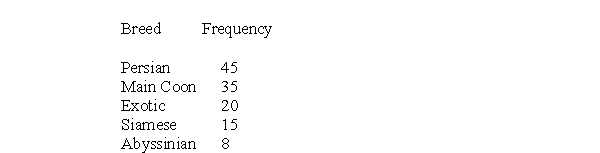
A) bar graph
B) histogram
C) scatterplot
D) line graph
A) bar graph
B) histogram
C) scatterplot
D) line graph
Question
Use the following frequency distribution to answer questions
An ACT score of 22 made up what percentage of cases in the frequency distribution?
A) 10
B) 15
C) 20
D) 30
An ACT score of 22 made up what percentage of cases in the frequency distribution?
A) 10
B) 15
C) 20
D) 30
Question
Question
Use the following frequency distribution to answer questions
Dr. Gomez would like to graph the scores from a recent exam a quantitative variable), what type of graph should she use and what should be on the horizontal axis?
A) pie chart; modal values
B) histogram; exam score values
C) bar graph; frequency values
D) bar graph; exam scores
Dr. Gomez would like to graph the scores from a recent exam a quantitative variable), what type of graph should she use and what should be on the horizontal axis?
A) pie chart; modal values
B) histogram; exam score values
C) bar graph; frequency values
D) bar graph; exam scores
Question
Question
Use the following frequency distribution to answer questions
What ACT score occurred 20% of the time?
A) 20
B) 30
C) 4
D) 22
What ACT score occurred 20% of the time?
A) 20
B) 30
C) 4
D) 22
Question
Question
Question
Question
Question
Question
Question
Question
Question
Question
Question
Question
Question
Question
The statistical symbol for a sample mean is
A) μ
B) α
C) X
D) Σ
A) μ
B) α
C) X
D) Σ
Question
Question
Question
Question
Question
Question
Question
Question
Question
Question
Question
Question
Question
Question
Question
Question
Question
Question
Question
Question
Question
Question
Question
Question
Question
Question
Question
Question
Question
Question
Question
Question
Question

Unlock Deck
Sign up to unlock the cards in this deck!
Unlock Deck
Unlock Deck
1/66
Play
Full screen (f)
Deck 14: Descriptive Statistics
1
What kind of graph uses bars that are separated by spaces?
A) a bar graph
B) a histogram
C) both a and b
D) neither a nor b
A) a bar graph
B) a histogram
C) both a and b
D) neither a nor b
A
2
A is a systematic arrangement of data values in which the unique data values are rank ordered and the frequencies are provided for each of these values.
A) scatter plot
B) frequency distribution
C) line graph
D) mean plot
A) scatter plot
B) frequency distribution
C) line graph
D) mean plot
B
3
SPSS is
A) measure of effect size.
B) a method of randomly selecting participants from a population.
C) a statistical software package commonly used by psychologists.
D) used for descriptive statistics but not inferential statistics.
A) measure of effect size.
B) a method of randomly selecting participants from a population.
C) a statistical software package commonly used by psychologists.
D) used for descriptive statistics but not inferential statistics.
C
4
The type of graph that would best display an interaction effect is:
A) pie graph.
B) histogram.
C) scatterplot.
D) line graph
A) pie graph.
B) histogram.
C) scatterplot.
D) line graph
Unlock Deck
Unlock for access to all 66 flashcards in this deck.
Unlock Deck
k this deck
5
Use the following frequency distribution to answer questions
Which of the following is the lowest score in the frequency distribution?
A) 23
B) 10
C) 20
D) 25
Which of the following is the lowest score in the frequency distribution?
A) 23
B) 10
C) 20
D) 25
Unlock Deck
Unlock for access to all 66 flashcards in this deck.
Unlock Deck
k this deck
6
When drawing a line graph, the dependent variable normally belongs on
A) the horizontal axis.
B) the vertical axis.
C) either the horizontal or vertical axis.
D) horizontal axis unless the variable is nominal.
A) the horizontal axis.
B) the vertical axis.
C) either the horizontal or vertical axis.
D) horizontal axis unless the variable is nominal.
Unlock Deck
Unlock for access to all 66 flashcards in this deck.
Unlock Deck
k this deck
7
A correlation coefficient is used to:
A) examine the relationship between two quantitative variables
B) examine the relationship between three categorical variables
C) make a statement of causation in nonexperimental research
D) establish the time ordering of variables n.
A) examine the relationship between two quantitative variables
B) examine the relationship between three categorical variables
C) make a statement of causation in nonexperimental research
D) establish the time ordering of variables n.
Unlock Deck
Unlock for access to all 66 flashcards in this deck.
Unlock Deck
k this deck
8
Use the following frequency distribution to answer questions
What is the most frequently occurring score in the frequency distribution?
A) 23
B) 10
C) 20
D) 25
What is the most frequently occurring score in the frequency distribution?
A) 23
B) 10
C) 20
D) 25
Unlock Deck
Unlock for access to all 66 flashcards in this deck.
Unlock Deck
k this deck
9
The relationship between number of friends and happiness is weaker in adulthood than in childhood. You make a scatter plot for children and a scatter plot for adults. In each scatter plot, you have SPSS insert the best fitting straight line. The cluster of dots for adults compared to that for children):
A) will be less spread out surrounding the best fitting straight line i.e., they will be closer to the line).
B) will be more spread out surrounding the best fitting straight line.
C) all dots will always fall on the straight line.
D) there will be a lack any apparent tilt in the line.
A) will be less spread out surrounding the best fitting straight line i.e., they will be closer to the line).
B) will be more spread out surrounding the best fitting straight line.
C) all dots will always fall on the straight line.
D) there will be a lack any apparent tilt in the line.
Unlock Deck
Unlock for access to all 66 flashcards in this deck.
Unlock Deck
k this deck
10
Use the following frequency distribution to answer questions
Which of the following graphs is most appropriate when displaying categorical data?
A) scatterplot
B) bar graph
C) histogram
D) any of the above
Which of the following graphs is most appropriate when displaying categorical data?
A) scatterplot
B) bar graph
C) histogram
D) any of the above
Unlock Deck
Unlock for access to all 66 flashcards in this deck.
Unlock Deck
k this deck
11
Use the following frequency distribution to answer questions
Which of the following ACT scores is the mode for the data shown in the frequency distribution?
A) 23
B) 10
C) 20
D) 25
Which of the following ACT scores is the mode for the data shown in the frequency distribution?
A) 23
B) 10
C) 20
D) 25
Unlock Deck
Unlock for access to all 66 flashcards in this deck.
Unlock Deck
k this deck
12
Inferential statistics involve the use of to draw conclusions about .
A) populations; samples
B) samples; populations
C) data sets; descriptive statistics
D) z scores; normal distributions
A) populations; samples
B) samples; populations
C) data sets; descriptive statistics
D) z scores; normal distributions
Unlock Deck
Unlock for access to all 66 flashcards in this deck.
Unlock Deck
k this deck
13
The use of descriptive statistics involves
A) summarizing your data so that it is easier for others to understand.
B) making inferences from your data to a population.
C) the use of both point and interval estimation.
D) hypothesis testing.
A) summarizing your data so that it is easier for others to understand.
B) making inferences from your data to a population.
C) the use of both point and interval estimation.
D) hypothesis testing.
Unlock Deck
Unlock for access to all 66 flashcards in this deck.
Unlock Deck
k this deck
14
What type of graph would be appropriate to display the frequency table of cat ownership shown below?
A) bar graph
B) histogram
C) scatterplot
D) line graph
A) bar graph
B) histogram
C) scatterplot
D) line graph
Unlock Deck
Unlock for access to all 66 flashcards in this deck.
Unlock Deck
k this deck
15
Use the following frequency distribution to answer questions
An ACT score of 22 made up what percentage of cases in the frequency distribution?
A) 10
B) 15
C) 20
D) 30
An ACT score of 22 made up what percentage of cases in the frequency distribution?
A) 10
B) 15
C) 20
D) 30
Unlock Deck
Unlock for access to all 66 flashcards in this deck.
Unlock Deck
k this deck
16
What kind of graph is used to display frequencies as bars without spaces between them?
A) a bar graph
B) a histogram
C) a scatterplot
D) all of the above
A) a bar graph
B) a histogram
C) a scatterplot
D) all of the above
Unlock Deck
Unlock for access to all 66 flashcards in this deck.
Unlock Deck
k this deck
17
Use the following frequency distribution to answer questions
Dr. Gomez would like to graph the scores from a recent exam a quantitative variable), what type of graph should she use and what should be on the horizontal axis?
A) pie chart; modal values
B) histogram; exam score values
C) bar graph; frequency values
D) bar graph; exam scores
Dr. Gomez would like to graph the scores from a recent exam a quantitative variable), what type of graph should she use and what should be on the horizontal axis?
A) pie chart; modal values
B) histogram; exam score values
C) bar graph; frequency values
D) bar graph; exam scores
Unlock Deck
Unlock for access to all 66 flashcards in this deck.
Unlock Deck
k this deck
18
Elizabeth wants to graph the relation between the number of hours spent studying and major psychology, biology, education, etc.). What type of graph should she use?
A) line graph
B) scatterplot
C) bar graph
D) frequency polygon
A) line graph
B) scatterplot
C) bar graph
D) frequency polygon
Unlock Deck
Unlock for access to all 66 flashcards in this deck.
Unlock Deck
k this deck
19
Use the following frequency distribution to answer questions
What ACT score occurred 20% of the time?
A) 20
B) 30
C) 4
D) 22
What ACT score occurred 20% of the time?
A) 20
B) 30
C) 4
D) 22
Unlock Deck
Unlock for access to all 66 flashcards in this deck.
Unlock Deck
k this deck
20
In a histogram, frequencies are presented on the and the score variable is presented on the .
A) vertical axis; horizontal axis
B) horizontal axis; vertical axis
C) either axis; either axis
D)-axis; Y-axis
A) vertical axis; horizontal axis
B) horizontal axis; vertical axis
C) either axis; either axis
D)-axis; Y-axis
Unlock Deck
Unlock for access to all 66 flashcards in this deck.
Unlock Deck
k this deck
21
What is the median for the following set of scores? 2, 6, 2, 11, 14
A) 2
B) 4 :
C) 6
D) 8.5
A) 2
B) 4 :
C) 6
D) 8.5
Unlock Deck
Unlock for access to all 66 flashcards in this deck.
Unlock Deck
k this deck
22
If we were interested in predicting grade point average from the number of hours students spend on the internet what should we place on the vertical axis?
A) grade point average
B) number of hours on the internet
C) students
D) either variable
A) grade point average
B) number of hours on the internet
C) students
D) either variable
Unlock Deck
Unlock for access to all 66 flashcards in this deck.
Unlock Deck
k this deck
23
After taking 23, 5-point, quizzes during the semester, both Jabari and Elaine have an average quiz score of 4.00. However, the standard deviation of Jabari's scores was .76 and Elaine's standard deviation was .25. What does it mean that Jabari and Elaine had the same quiz average but very different standard deviations?
A) Jabari was above the class average but Elaine was below the class mean
B) Jabari was more consistent than Elaine
C) Elaine's individual quiz scores were closer to her average while Jabari's scores were more variable
D) Jabari performed better than Elaine
A) Jabari was above the class average but Elaine was below the class mean
B) Jabari was more consistent than Elaine
C) Elaine's individual quiz scores were closer to her average while Jabari's scores were more variable
D) Jabari performed better than Elaine
Unlock Deck
Unlock for access to all 66 flashcards in this deck.
Unlock Deck
k this deck
24
What is the median for the following set of scores? 1, 3, 3, 5, 8, 10
A) 3
B) 4
C) 5
D) 6
A) 3
B) 4
C) 5
D) 6
Unlock Deck
Unlock for access to all 66 flashcards in this deck.
Unlock Deck
k this deck
25
The least informative measure of central tendency is the
A) mode.
B) median.
C) range.
D) variance.
A) mode.
B) median.
C) range.
D) variance.
Unlock Deck
Unlock for access to all 66 flashcards in this deck.
Unlock Deck
k this deck
26
For her senior research project Jerri collects survey data on the number of hours spent on social networking and grade point average GPA). She creates a scatterplot to graph her results. If the pattern of dots on her scatterplot goes from lower left to upper right, what would this indicate?
A) that the relationship is strong
B) that it is a positive relationship
C) that it is a negative relationship
D) that people who spend a lot of time social networking tend to have a lower GPA
A) that the relationship is strong
B) that it is a positive relationship
C) that it is a negative relationship
D) that people who spend a lot of time social networking tend to have a lower GPA
Unlock Deck
Unlock for access to all 66 flashcards in this deck.
Unlock Deck
k this deck
27
A raw score above the mean of the distribution will result in a z score
A) greater than zero
B) of zero
C) less than zero
D) equal to the mean of the distribution
A) greater than zero
B) of zero
C) less than zero
D) equal to the mean of the distribution
Unlock Deck
Unlock for access to all 66 flashcards in this deck.
Unlock Deck
k this deck
28
What is the mode for the following sample of n = 8 scores? Scores: 0, 0, 1, 2, 2, 2, 2, 3
A) 2
B) 2.5
C) 12/8 = 1.50
D) 12
A) 2
B) 2.5
C) 12/8 = 1.50
D) 12
Unlock Deck
Unlock for access to all 66 flashcards in this deck.
Unlock Deck
k this deck
29
A z score of 1.00 is located:
A) one standard deviation below the mean.
B) below the mean but we cannot tell how far below.
C) above the mean but we cannot tell how far above.
D) one standard deviation above the mean.
A) one standard deviation below the mean.
B) below the mean but we cannot tell how far below.
C) above the mean but we cannot tell how far above.
D) one standard deviation above the mean.
Unlock Deck
Unlock for access to all 66 flashcards in this deck.
Unlock Deck
k this deck
30
is the exact average deviation of data values from the mean in squared units, and is the approximate average deviation of data values from the mean in regular units.
A) Standard deviation; variance
B) Effect size; correlation
C) Variance; standard deviation
D) Negative correlation; positive correlation
A) Standard deviation; variance
B) Effect size; correlation
C) Variance; standard deviation
D) Negative correlation; positive correlation
Unlock Deck
Unlock for access to all 66 flashcards in this deck.
Unlock Deck
k this deck
31
What is the relationship between the standard deviation and variance?
A) standard deviation equals squared variance
B) variance is the square root of standard deviation
C) standard deviation is the square root of variance
D) these two measures are unrelated
A) standard deviation equals squared variance
B) variance is the square root of standard deviation
C) standard deviation is the square root of variance
D) these two measures are unrelated
Unlock Deck
Unlock for access to all 66 flashcards in this deck.
Unlock Deck
k this deck
32
The mean of a set of numbers converted to z scores is and the standard deviation is .
A) 0; 1
B) 1; 0
C) 2; 1
D) equal to population mean; impossible to determine
A) 0; 1
B) 1; 0
C) 2; 1
D) equal to population mean; impossible to determine
Unlock Deck
Unlock for access to all 66 flashcards in this deck.
Unlock Deck
k this deck
33
The statistical symbol for a sample mean is
A) μ
B) α
C) X
D) Σ
A) μ
B) α
C) X
D) Σ
Unlock Deck
Unlock for access to all 66 flashcards in this deck.
Unlock Deck
k this deck
34
What is Σ X for the following group of scores? 1, 2, 3, 4, 5
A) 3
B) 5
C) 15
D) 30
A) 3
B) 5
C) 15
D) 30
Unlock Deck
Unlock for access to all 66 flashcards in this deck.
Unlock Deck
k this deck
35
If the pattern of dots on a scatterplot runs from upper left to lower right what does this indicate?
A) that the relationship is strong
B) that the relationship is weak
C) that it is a positive relationship
D) that it is a negative relationship
A) that the relationship is strong
B) that the relationship is weak
C) that it is a positive relationship
D) that it is a negative relationship
Unlock Deck
Unlock for access to all 66 flashcards in this deck.
Unlock Deck
k this deck
36
To display the relationship between two quantitative variables, one should use
A) a bar graph.
B) a histogram.
C) a scatterplot.
D) z scores.
A) a bar graph.
B) a histogram.
C) a scatterplot.
D) z scores.
Unlock Deck
Unlock for access to all 66 flashcards in this deck.
Unlock Deck
k this deck
37
A sample consists of n = 25 scores. How many of the scores are used to calculate the range?
A) 0
B) 2
C) 5
D) 25
A) 0
B) 2
C) 5
D) 25
Unlock Deck
Unlock for access to all 66 flashcards in this deck.
Unlock Deck
k this deck
38
What is the mean for the following sample of scores? 2, 4, 6, 8
A) 20
B) 10
C) 5
D) 4
A) 20
B) 10
C) 5
D) 4
Unlock Deck
Unlock for access to all 66 flashcards in this deck.
Unlock Deck
k this deck
39
Which set of scores has the smallest standard deviation no calculations allowed or needed)?
A) 11, 17, 31, 53
B) 5, 11, 42, 22
C) 155, 153, 155, 157
D)27, 105, 10, 80
A) 11, 17, 31, 53
B) 5, 11, 42, 22
C) 155, 153, 155, 157
D)27, 105, 10, 80
Unlock Deck
Unlock for access to all 66 flashcards in this deck.
Unlock Deck
k this deck
40
The mean, median, and mode are all considered to be measures of
A) inferential statistics.
B) effect size.
C) variability.
D) central tendency.
A) inferential statistics.
B) effect size.
C) variability.
D) central tendency.
Unlock Deck
Unlock for access to all 66 flashcards in this deck.
Unlock Deck
k this deck
41
Research has indicated that there is a curvilinear relationship between the number of drinks a person has per day and their likelihood of developing heart disease. Calculating a regular correlation coefficient on these data would likely result in
A) an artificially low value.
B) a value close to +1.00.
C) a value close to -1.00.
D) a value larger than 1.00.
A) an artificially low value.
B) a value close to +1.00.
C) a value close to -1.00.
D) a value larger than 1.00.
Unlock Deck
Unlock for access to all 66 flashcards in this deck.
Unlock Deck
k this deck
42
A positive value for a correlation indicates
A) increases in one variable tend to be accompanied by increases in the second variable.
B) increases in one variable tend to be accompanied by decreases in the second variable.
C) a stronger relationship than if the correlation were negative.
D) nothing; all correlation values are positive.
A) increases in one variable tend to be accompanied by increases in the second variable.
B) increases in one variable tend to be accompanied by decreases in the second variable.
C) a stronger relationship than if the correlation were negative.
D) nothing; all correlation values are positive.
Unlock Deck
Unlock for access to all 66 flashcards in this deck.
Unlock Deck
k this deck
43
The absolute value of a correlation coefficient indicates the of the relationship and the sign indicates the of the relationship.
A) causality; magnitude
B) direction; causality
C) strength; direction
D) strength; whether or not a relationship exists
A) causality; magnitude
B) direction; causality
C) strength; direction
D) strength; whether or not a relationship exists
Unlock Deck
Unlock for access to all 66 flashcards in this deck.
Unlock Deck
k this deck
44
For a data set with a mean = 10 and standard deviation = 2, what is the z score corresponding to a raw score of 7?
A) +1.5
B) -1.5
C) 2
D) -2
A) +1.5
B) -1.5
C) 2
D) -2
Unlock Deck
Unlock for access to all 66 flashcards in this deck.
Unlock Deck
k this deck
45
When calculating a correlation coefficient, can only be used when the data are related in a linear fashion.
A) Cohen's d
B) Pearson's correlation
C) z score
D) F test
A) Cohen's d
B) Pearson's correlation
C) z score
D) F test
Unlock Deck
Unlock for access to all 66 flashcards in this deck.
Unlock Deck
k this deck
46
How does multiple regression differ from simple regression?
A) it contains multiple data points
B) it involves multiple dependent variables
C) it includes multiple independent/predictor variables
D) it can always be used to establish causality
A) it contains multiple data points
B) it involves multiple dependent variables
C) it includes multiple independent/predictor variables
D) it can always be used to establish causality
Unlock Deck
Unlock for access to all 66 flashcards in this deck.
Unlock Deck
k this deck
47
An effect size is a measure of
A) the magnitude of the relationship between two variables.
B) whether the result reached statistical significance.
C) the validity of our result.
D) the probability that we made a correct decision.
A) the magnitude of the relationship between two variables.
B) whether the result reached statistical significance.
C) the validity of our result.
D) the probability that we made a correct decision.
Unlock Deck
Unlock for access to all 66 flashcards in this deck.
Unlock Deck
k this deck
48
A perfect relationship will results in a correlation coefficient value of
A) 1.00.
B) -1.00.
C) both a and b
D) neither a nor b
A) 1.00.
B) -1.00.
C) both a and b
D) neither a nor b
Unlock Deck
Unlock for access to all 66 flashcards in this deck.
Unlock Deck
k this deck
49
Assume that the correlation coefficient between class attendance and number of problems missed on an exam is -.77). Which of the following statements regarding this finding is correct?
A) students who had fewer absences answered more questions correctly
B) students who had more absences answered more questions correctly
C) a negative correlation value is impossible; there must be a mistake in the calculations
D) the number of problems answered correctly is below the class mean
A) students who had fewer absences answered more questions correctly
B) students who had more absences answered more questions correctly
C) a negative correlation value is impossible; there must be a mistake in the calculations
D) the number of problems answered correctly is below the class mean
Unlock Deck
Unlock for access to all 66 flashcards in this deck.
Unlock Deck
k this deck
50
Which of the following is a measure of the standardized difference between two means?
A) Cohen's d
B)-bar
C) SD
D) Σr
A) Cohen's d
B)-bar
C) SD
D) Σr
Unlock Deck
Unlock for access to all 66 flashcards in this deck.
Unlock Deck
k this deck
51
Assume that within one study the regression equation relating daily saturated fat intake in grams x) to blood cholesterol level y) is Y-hat = 130 + 5X. What is the value of the y-intercept for this problem?
A) 1
B) 5
C) 130
D) impossible to determine
A) 1
B) 5
C) 130
D) impossible to determine
Unlock Deck
Unlock for access to all 66 flashcards in this deck.
Unlock Deck
k this deck
52
In a normal distribution, the percentage of raw scores falling within one standard deviation of the mean equals
A) 34.11%.
B) 68.26%.
C) 95.44%.
D) 99.74%.
A) 34.11%.
B) 68.26%.
C) 95.44%.
D) 99.74%.
Unlock Deck
Unlock for access to all 66 flashcards in this deck.
Unlock Deck
k this deck
53
What position in a distribution of numbers corresponds to a z score of z = -2.00?
A) two standard deviation units above the mean
B) two points above the mean
C) two standard deviation units below the mean
D) two points below the mean
A) two standard deviation units above the mean
B) two points above the mean
C) two standard deviation units below the mean
D) two points below the mean
Unlock Deck
Unlock for access to all 66 flashcards in this deck.
Unlock Deck
k this deck
54
What is the median of these numbers: 2, 7, 6, 8, 10 ?
A) 7
B) 6
C) 8
D) 10
A) 7
B) 6
C) 8
D) 10
Unlock Deck
Unlock for access to all 66 flashcards in this deck.
Unlock Deck
k this deck
55
The amount of change in Y for every one unit increase in X is indicated by the
A) magnitude of the correlation coefficient.
B) correlation coefficient sign.
C) y-intercept.
D) slope regression coefficient).
A) magnitude of the correlation coefficient.
B) correlation coefficient sign.
C) y-intercept.
D) slope regression coefficient).
Unlock Deck
Unlock for access to all 66 flashcards in this deck.
Unlock Deck
k this deck
56
Vanessa Kanaan, an Associate Professor at the University of Louisville, creates a new "empathy" test and administers it to business majors and biology majors. She finds that the two groups differ significantly from each other with an effect size Cohen's d) equal to .85. Based on this information which of the following statements is accurate?
A) although her results are statistically significant, the effect size would be considered "small" meaning that it has little practical importance
B) the effect size in this study would be considered "moderate"
C) the effect size in this study would be considered "large"
D) it is impossible to obtain an effect size of .85; she must have calculated it incorrectly
Unlock Deck
Unlock for access to all 66 flashcards in this deck.
Unlock Deck
k this deck
57
The normal distribution follows within rounding) which of the following rules?
A) the symmetrical rule
B) the central limit theorem
C) the 68, 95, 99.7 rule
D) the normal distribution rule
A) the symmetrical rule
B) the central limit theorem
C) the 68, 95, 99.7 rule
D) the normal distribution rule
Unlock Deck
Unlock for access to all 66 flashcards in this deck.
Unlock Deck
k this deck
58
Dr. Wilson conducts an experiment and finds that the difference between the experimental and control group means is 45.3 units. This can be referred to as the
A) effect size indicator
B) unstandardized difference between means
C) standardized difference between means
D) z score
A) effect size indicator
B) unstandardized difference between means
C) standardized difference between means
D) z score
Unlock Deck
Unlock for access to all 66 flashcards in this deck.
Unlock Deck
k this deck
59
Professor Ganji jokes that there is a -.85 correlation between the number of courses a student takes with him and the student's grade point average. Which of the following is the best interpretation of this statement?
A) in general, the more courses that students take from professor Ganji the lower their grade point average
B) the more courses students take from professor Ganji the higher their grade point average
C) professor Ganji is an easy instructor
D) students who take more of professor Ganji's class are guaranteed to have a higher grade point average
Unlock Deck
Unlock for access to all 66 flashcards in this deck.
Unlock Deck
k this deck
60
Which correlation coefficient represents the strongest association between X and Y?
A) +.20
B) +.60
C) -.80
D) -1.5
A) +.20
B) +.60
C) -.80
D) -1.5
Unlock Deck
Unlock for access to all 66 flashcards in this deck.
Unlock Deck
k this deck
61
The regression coefficient in a multiple regression equation is called
A) partial correlation coefficient
B) correlation coefficient
C) partial regression coefficient
D) simple regression coefficient
A) partial correlation coefficient
B) correlation coefficient
C) partial regression coefficient
D) simple regression coefficient
Unlock Deck
Unlock for access to all 66 flashcards in this deck.
Unlock Deck
k this deck
62
An) coefficient predicts the change in a dependent variable given a one unit change in the independent variable.
A) regression
B) correlation
C) ANOVA
D) ANCOVA
A) regression
B) correlation
C) ANOVA
D) ANCOVA
Unlock Deck
Unlock for access to all 66 flashcards in this deck.
Unlock Deck
k this deck
63
If you would like to display the relationship between two categorical variables you should use a
A) bar graph.
B) contingency table.
C) scatterplot.
D) histogram.
A) bar graph.
B) contingency table.
C) scatterplot.
D) histogram.
Unlock Deck
Unlock for access to all 66 flashcards in this deck.
Unlock Deck
k this deck
64
Partial correlation
A) is calculated when you have incomplete data.
B) allows the researcher to control for the influence of one or more variables.
C) is less useful than complete correlation.
D) allows the researcher to make strong cause and effect statements when based on nonexperimental data .
A) is calculated when you have incomplete data.
B) allows the researcher to control for the influence of one or more variables.
C) is less useful than complete correlation.
D) allows the researcher to make strong cause and effect statements when based on nonexperimental data .
Unlock Deck
Unlock for access to all 66 flashcards in this deck.
Unlock Deck
k this deck
65
regression involves the use of only one independent or predictor variable while regression involves two or more independent or predictor variable.
A) Pearson's; partial
B) Easy; hard
C) Simple; multiple
D) Alpha; omega
A) Pearson's; partial
B) Easy; hard
C) Simple; multiple
D) Alpha; omega
Unlock Deck
Unlock for access to all 66 flashcards in this deck.
Unlock Deck
k this deck
66
Assume that within one study the regression equation relating daily saturated fat intake in grams x) to blood cholesterol level y) is Y-hat = 130 + 5X. What is the value of the regression coefficient?
A) 1
B) 5
C) 130
D) impossible to determine
A) 1
B) 5
C) 130
D) impossible to determine
Unlock Deck
Unlock for access to all 66 flashcards in this deck.
Unlock Deck
k this deck
Unlock Deck
Unlock for access to all 66 flashcards in this deck.


