Exam 14: Descriptive Statistics
Exam 1: Introduction to Scientific Research73 Questions
Exam 2: Research Approaches and Methods of Data Collection60 Questions
Exam 3: Problem Identification and Hypothesis Formation56 Questions
Exam 4: Ethics67 Questions
Exam 5: Measuring Variables and Sampling62 Questions
Exam 6: Research Validity61 Questions
Exam 7: Control Techniques in Experimental Research54 Questions
Exam 8: Experimental Research Design62 Questions
Exam 9: Procedure for Conducting an Experiment54 Questions
Exam 10: Quasi-Experimental Designs49 Questions
Exam 11: Single-Case Research Designs50 Questions
Exam 12: Survey Research63 Questions
Exam 13: Qualitative and Mixed Methods Research64 Questions
Exam 14: Descriptive Statistics66 Questions
Exam 15: Inferential Statistics59 Questions
Exam 16: Preparing the Research Report for Presentation or Publication62 Questions
Select questions type
If the pattern of dots on a scatterplot runs from upper left to lower right what does this indicate?
Free
(Multiple Choice)
4.9/5  (32)
(32)
Correct Answer: Verified
D
Which set of scores has the smallest standard deviation no calculations allowed or needed)?
Free
(Multiple Choice)
4.9/5 (32)
Correct Answer:Verified
C
The regression coefficient in a multiple regression equation is called
Free
(Multiple Choice)
4.9/5 (30)
Correct Answer:Verified
C
The amount of change in Y for every one unit increase in X is indicated by the
(Multiple Choice)
4.8/5 (37)
For her senior research project Jerri collects survey data on the number of hours spent on social networking and grade point average GPA). She creates a scatterplot to graph her results. If the pattern of dots on her scatterplot goes from lower left to upper right, what would this indicate?
(Multiple Choice)
4.8/5 (35)
Which correlation coefficient represents the strongest association between X and Y?
(Multiple Choice)
4.8/5 (27)
A perfect relationship will results in a correlation coefficient value of
(Multiple Choice)
4.9/5 (30)
The mean of a set of numbers converted to z scores is________ and the standard deviation is__________ .
(Multiple Choice)
4.9/5 (27)
Assume that within one study the regression equation relating daily saturated fat intake in grams x) to blood cholesterol level y) is Y-hat = 130 + 5X. What is the value of the y-intercept for this problem?
(Multiple Choice)
4.7/5 (41)
What is the relationship between the standard deviation and variance?
(Multiple Choice)
4.8/5 (43)
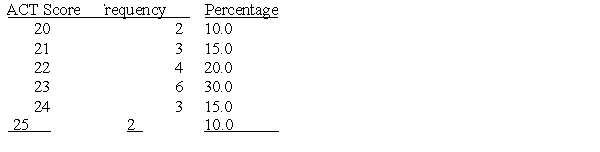
Use the following frequency distribution to answer questions
 -Dr. Gomez would like to graph the scores from a recent exam a quantitative variable), what type of graph should she use and what should be on the horizontal axis?
(Multiple Choice)
4.7/5 (45)
__________regression involves the use of only one independent or predictor variable while __________regression involves two or more independent or predictor variable.
(Multiple Choice)
4.8/5 (37)
Which of the following is a measure of the standardized difference between two means?
(Multiple Choice)
4.8/5 (32)
What is the median for the following set of scores? 2, 6, 2, 11, 14
(Multiple Choice)
4.8/5 (33)
Use the following frequency distribution to answer questions
-What ACT score occurred 20% of the time?
(Multiple Choice)
4.8/5 (34)
If you would like to display the relationship between two categorical variables you should use a
(Multiple Choice)
4.8/5 (42)
Vanessa Kanaan, an Associate Professor at the University of Louisville, creates a new "empathy" test and administers it to business majors and biology majors. She finds that the two groups differ significantly from each other with an effect size Cohen's d) equal to .85. Based on this information which of the following statements is accurate?
(Multiple Choice)
4.9/5 (28)
Filters
- Essay(0)
- Multiple Choice(0)
- Short Answer(0)
- True False(0)
- Matching(0)