Deck 2: Graphical Methods for Describing Data Distributions
Full screen (f)
Question
Question
Question
Question
Question
Question
Question
Question
The following relative frequency distribution summarizes student responses to the question "If you could make your college choice over, would you still choose to enroll at your current college?"  Which of the following is the correct bar chart for the response data?
A)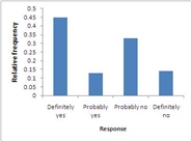
B)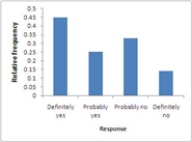
C)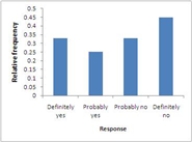
D)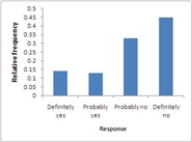
E)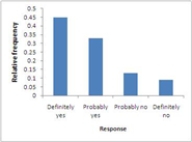
Which of the following is the correct bar chart for the response data?A)
B)
C)
D)
E)
Question
Question
Question
Question
A survey asked adult respondents how dependent they were on various electronic devices. The accompanying table summarizes the responses. 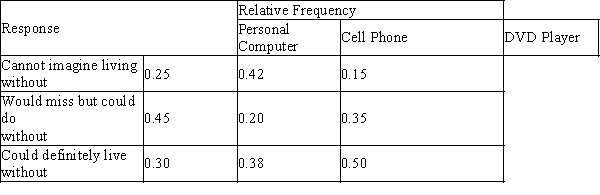 Select a comparative bar chart that shows the distributions of responses for the three different technologies.
A)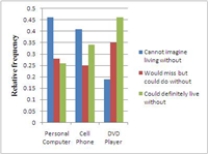
B)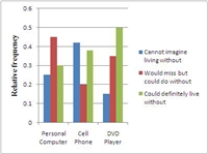
C)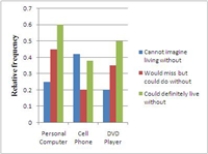
D)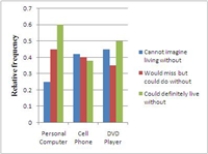
E)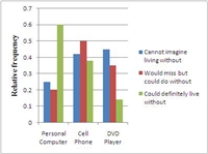
Select a comparative bar chart that shows the distributions of responses for the three different technologies.A)
B)
C)
D)
E)
Question
Question
Question
Question
The quantity  often gives a rough estimate of the appropriate number of intervals in a histogram.
often gives a rough estimate of the appropriate number of intervals in a histogram. Question
Question
Question
Question
Question
A statewide survey released by the University of Iowa Injury Prevention Research Center was designed to assess compliance with Iowa seatbelt law. The table below shows the results for 5 Iowa cities. 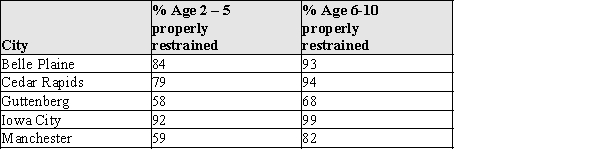
(a)Display these data in a comparative bar chart so that the different ages can be compared for the different cities.
(b)Write a brief description of the differences and similarities in the patterns you observe in your bar chart for part (a).
(a)Display these data in a comparative bar chart so that the different ages can be compared for the different cities.
(b)Write a brief description of the differences and similarities in the patterns you observe in your bar chart for part (a).
Question
The frequency distribution shown summarizes data on the percentage of college students enrolled in public institutions for the 50 U.S. states.  What is the relative frequency for the 70 to < 80 interval?
A)0.05
B)0.10
C)0.22
D)11
E)50
What is the relative frequency for the 70 to < 80 interval?A)0.05
B)0.10
C)0.22
D)11
E)50
Question
Question
The annual household incomes, in thousands of dollars, for 150 households in a small community are summarized in the histogram below. 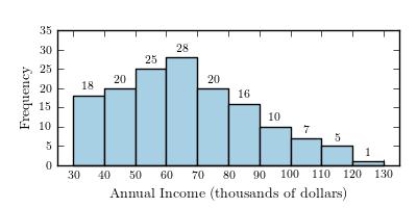 What proportion of households have annual incomes of $90,000 or more?
A)0.85
B)0.67
C)0.08
D)0.15
E)0.11
What proportion of households have annual incomes of $90,000 or more?A)0.85
B)0.67
C)0.08
D)0.15
E)0.11
Question
The annual household incomes, in thousands of dollars, for 500 households in a small community are summarized in the histogram below. 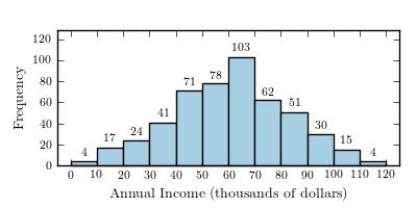 Which of the following values best describes a typical household income for this community?
A)$40,000
B)$50,000
C)$60,000
D)$70,000
E)$80,000
Which of the following values best describes a typical household income for this community?A)$40,000
B)$50,000
C)$60,000
D)$70,000
E)$80,000
Question
Ruminants are hoofed animals such as cattle and sheep. Two categories of ruminants are browsers (leaf eaters) and grazers (grass eaters). Some biologists believe that the incisor arcade, that part of the mouth between the incisors, is shaped differently for browsers and grazers, and that might explain their food selection. The "curvature" of an incisor arcade is a measure of its shape, with large values indicating a long, thin mouth, and small values a shorter, wider mouth. The back-to-back stem plot below compares the curvatures of incisor arcades of a sample of species of browsers and grazers in the ruminant family. 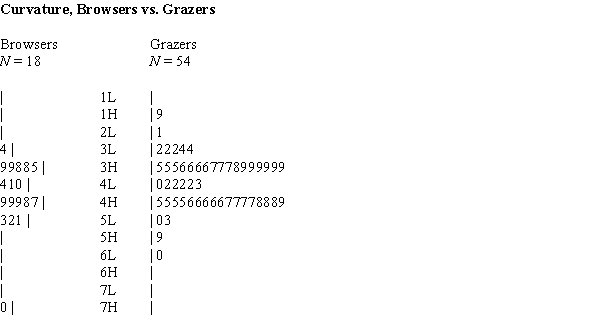
(a)Briefly describe each of the two curvature distributions, browsers and grazers, noting any unusual features of the data.
(b)The theory of some biologists is that browsers have thinner mouths because the browse plants frequently have thorns and spines; browsers have evolved to have thinner mouths to get beyond the thorns and spines to the food part of the plant. Is the data in the back-to-back stem plot consistent with this theory? What aspect of the data would you consider when answering this question?
Question
The cumulative relative frequency plot shown was constructed using data on the percentage of college students enrolled in public institutions for the 50 U.S. states. Which of the following is closest to the approximate proportion of states that have more than 90 percent of college students enrolled in public institutions? 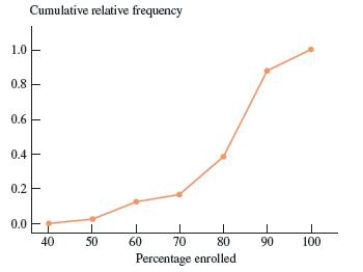
A)0.6
B)0.1
C)0.0
D)0.4
E)0.9
A)0.6
B)0.1
C)0.0
D)0.4
E)0.9
Question
Exhibit 2-4
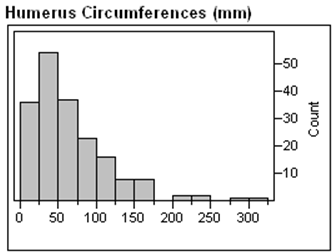
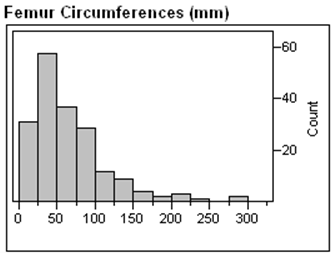
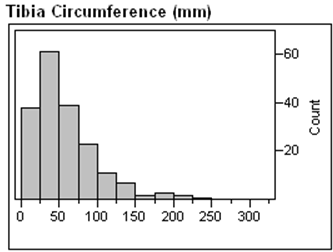
In the article, "Scaling of Mammalian Long Bones: Small and Large Mammals Compared," the average circumferences (distances around) in mm of the humerus, femur, and tibia of different species of mammals were reported. These are the long bones that primarily support the body mass in mammals. Each data value is the mean circumference for the available measures for a single species.
Refer to Exhibit 2-4.
Describe the differences and similarities in the distributions of these different mammalian bones.
Question
The most important right and responsibility of citizens in a democratic society is voting. The bar chart below shows, for different age groups in the 2000 presidential election in the United States, the percentage of individuals in that age group who are registered to vote. 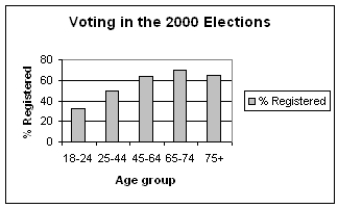 (a)Describe in a few sentences the registration pattern that you see in the data above.
(b)Some individuals argue that the reason for the current level of registration in the 18-24 year-old group is that many of them are college students and would have to vote absentee. In your opinion, would that explain the registration level for the 18 - 24 age-group? Why or why not?
(a)Describe in a few sentences the registration pattern that you see in the data above.(b)Some individuals argue that the reason for the current level of registration in the 18-24 year-old group is that many of them are college students and would have to vote absentee. In your opinion, would that explain the registration level for the 18 - 24 age-group? Why or why not?
Question
Artificial nest have often been used when biologists study predation on birds. It is usually assumed that predators will respond to artificial nests in the same way they do to real birds' nests. A recent experiment was performed to check this assumption for predators of the American robin (Turdus migratorius) by comparing the egg loss in three experimental treatments: (1) natural robin's nests, (2) artificial wicker-basket nests placed 30 meters in a random direction from natural robin's nests, and (3) artificial wicker-basket nests placed in a 180 m by 240 m grid around robin's nests. The data below are cumulative counts of eggs predated (stolen or broken and eaten) at 5, 10, and 15 day points of the experiment. 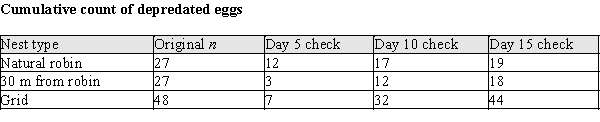
(a)Construct a bar chart to display the cumulative counts for the natural robin nests at their 5-, 10-, and 15-day checks.
(b)Fill in the relative frequency distribution (table) representing the cumulative counts for the artificial nests in the grid. (Do not convert the table to a graph.)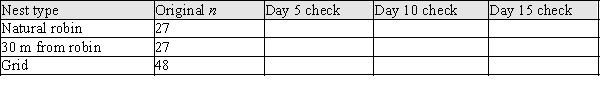
(a)Construct a bar chart to display the cumulative counts for the natural robin nests at their 5-, 10-, and 15-day checks.
(b)Fill in the relative frequency distribution (table) representing the cumulative counts for the artificial nests in the grid. (Do not convert the table to a graph.)
Question
Exhibit 2-2
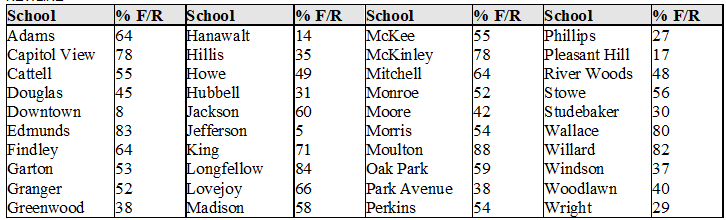
In a story written in December 2002, the Des Moines Register reported on the percentages of students who qualify for Free/Reduced lunch programs in the elementary schools in Des Moines, Iowa. The data, by elementary school, appears in the table below.
Refer to Exhibit 2-2.
(a)Construct a histogram for these data, using the following class intervals:
0 to < 20
20 to < 40, etc.
(b)Describe the distribution of Free/Reduced eligibility percents, and note any unusual features.
Question
Question
Question
Question
Question
The stem plot below displays the weights (in ounces) of a random sample of tomatoes grown on a local farm 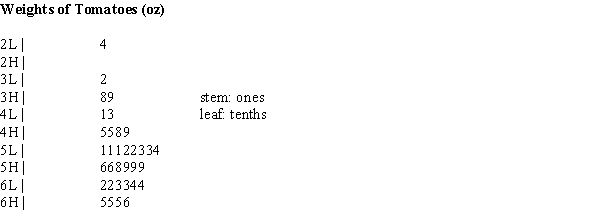
(a)Briefly describe the distribution of tomato weights.
(b)What is the weight of the heaviest tomato in the sample?
(a)Briefly describe the distribution of tomato weights.
(b)What is the weight of the heaviest tomato in the sample?
Question
Question
One interesting aspect of surveys is that the order of the questions can affect the results. This is thought to occur because one question can alter the response to a subsequent question. In 1948 many people in the United States were concerned about the spread of communism as a political and economic philosophy. A survey given that year contained both of the following questions:
1. Do you think the United States should let Communist newspaper reporters from other countries come in here and send back to their papers the news as they see it?
2. Do you think a Communist country like Russia should let American newspaper reporters come in and send back to America the news as they see it?
The following table contains the percentages of the Yes/No answers given by respondents when asked these questions in different orders.

a) Construct a comparative bar chart for these response percentages.
b) Interpret the results of the 1948 survey. Do you think the order of the questions made a difference in the responses? Explain.
1. Do you think the United States should let Communist newspaper reporters from other countries come in here and send back to their papers the news as they see it?
2. Do you think a Communist country like Russia should let American newspaper reporters come in and send back to America the news as they see it?
The following table contains the percentages of the Yes/No answers given by respondents when asked these questions in different orders.
a) Construct a comparative bar chart for these response percentages.
b) Interpret the results of the 1948 survey. Do you think the order of the questions made a difference in the responses? Explain.
Question
Which of the following stem and leaf plots corresponds a data distribution that is positively (right) skewed? I. 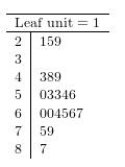 II.
II. 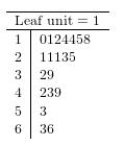 III.
III. 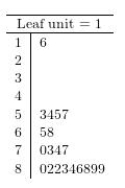
A)I only
B)II only
C)III only
D)I and III only
E)None of the distributions is positively skewed.
II. III. A)I only
B)II only
C)III only
D)I and III only
E)None of the distributions is positively skewed.
Question
According to the stem-and-leaf display below, how many times does the number 58 appear in the data set? 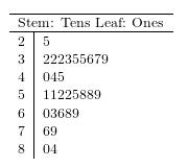
A)0
B)1
C)2
D)5
E)58
A)0
B)1
C)2
D)5
E)58
Question
Question
Bird-plane collisions
Collisions between birds and airplanes are a major problem, threatening passenger safety and resulting in costly repairs. During the years 1990 - 1994, researchers gathered bird remains from runways at Lihue Airport on the island of Kauai, Hawaii. The data below are counts of birds found on the runway used for takeoffs and the runway used for landings from the 4 most frequently involved species: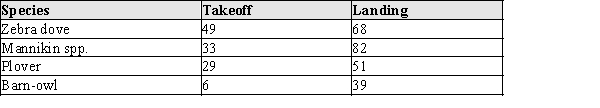
(a)Construct a bar chart to display the bird species data for the landing runway.
(b)Construct a relative frequency distribution (table) representing the bird species data for the takeoff runway.
Question
In a survey of 30 working adults who earn less than $6,000 per year, investigators asked about job satisfaction and income. The responses are summarized in the following table:  Construct and sketch a pie chart for these data.
Construct and sketch a pie chart for these data. Question
Artificial bird nests have been used extensively when studying predator behavior. The assumption is that predators will find and respond to artificial nests in the same way they do to the natural nests. In a study to test this hypothesis the predation of 27 American Robin (Turdus migratorius) nests and 27 artificial wicker-basket nests were compared. Artificial nests were placed 30m from existing robin's nests in a randomly chosen direction. The natural nests and artificial nests were checked at 5-day intervals, and the number of nests (out of 27) that had been disturbed by predators in the interval was noted. The results are as follows: 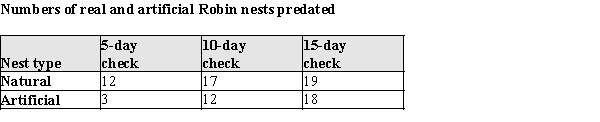
(a)Construct a time series plot for the number of natural nests disturbed by predators. Use the same set of axes to plot the number of artificial nests disturbed by predators.
(b)Does it appear that the artificial and natural nests have the same pattern of predation? Justify your answer by appealing to specific aspects of your plot in part (a).
Question
Investigators studying the relation between gender and the interests of early adolescents asked boys and girls in grades 5-9 to indicate on a 7-point scale their degree of interest in topics such as Life, Sports, and Cars.
The data in the scatter plot represent average levels of interest for boys and girls in grades 5 - 9. Each point represents one topic listed by the investigators. For example, boys average rating for "Opposite sex" as a 6.2, while girls on average rated their interest in this topic as 6.0 on the 7 point interest scale. This is recorded as the point (6.2, 6.0).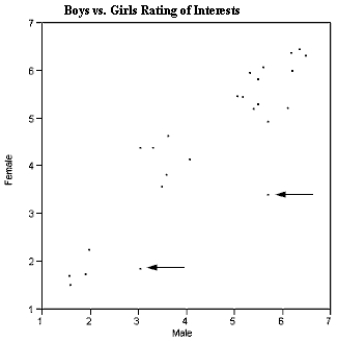 There are three interesting features of this scatter plot that you are to interpret below. What can you infer from each of these features of the scatterplot?
(a)The points generally seem to scatter around the line, y = x.
(b)There seem to be three clusters of points, one in the lower left, one in the middle, and one in the upper right of the graph.
(c)There are two points (as indicated by the arrows) that do not seem to fit the overall pattern. What can be said about the topics these points represent?
The data in the scatter plot represent average levels of interest for boys and girls in grades 5 - 9. Each point represents one topic listed by the investigators. For example, boys average rating for "Opposite sex" as a 6.2, while girls on average rated their interest in this topic as 6.0 on the 7 point interest scale. This is recorded as the point (6.2, 6.0).
There are three interesting features of this scatter plot that you are to interpret below. What can you infer from each of these features of the scatterplot?(a)The points generally seem to scatter around the line, y = x.
(b)There seem to be three clusters of points, one in the lower left, one in the middle, and one in the upper right of the graph.
(c)There are two points (as indicated by the arrows) that do not seem to fit the overall pattern. What can be said about the topics these points represent?
Question
As part of the United States Census, data is also collected on the number of persons in each household. The census data for four decades is summarized below. 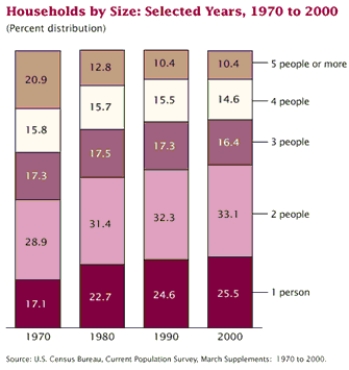 (a)In a few sentences describe how the proportion of households with 4 people has changed from 1970 to 2000.
(b)What size of household appears to have decreased the most from 1970 to 2000?
(a)In a few sentences describe how the proportion of households with 4 people has changed from 1970 to 2000.(b)What size of household appears to have decreased the most from 1970 to 2000?
Question
Exhibit 2-3
There has been a recent increase in the popularity of caffeine-containing "energy drinks" or "functional beverages"--substances that are considered to be food that may provide some health benefit. However, caffeine in these drinks presents an important health concern, especially for women of childbearing age. Studies have shown an increased risk of spontaneous abortion and low birth weight children to women consuming more than 150 mg/day of caffeine. In a recent study, eighteen 12-oz servings of different brands of carbonated sodas were analyzed to ascertain their caffeine content, with the results presented below. The data are in mg/12-oz serving; if no caffeine was detected, this is reported as "* mg/serving."
Caffeine (mg) in 12 oz servings of Carbonated Sodas
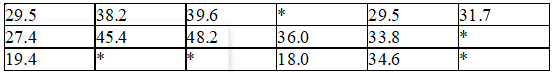
Refer to Exhibit 2-3.
a)Construct a comparative (back to back) stem & leaf plot for the container vs. fountain amounts of caffeine. (Do not use the data for carbonated sodas where caffeine was not detected.) Describe how the two distributions compare.
(b)What do you think might explain the differences between the two distributions?
There has been a recent increase in the popularity of caffeine-containing "energy drinks" or "functional beverages"--substances that are considered to be food that may provide some health benefit. However, caffeine in these drinks presents an important health concern, especially for women of childbearing age. Studies have shown an increased risk of spontaneous abortion and low birth weight children to women consuming more than 150 mg/day of caffeine. In a recent study, eighteen 12-oz servings of different brands of carbonated sodas were analyzed to ascertain their caffeine content, with the results presented below. The data are in mg/12-oz serving; if no caffeine was detected, this is reported as "* mg/serving."
Caffeine (mg) in 12 oz servings of Carbonated Sodas
Refer to Exhibit 2-3.
a)Construct a comparative (back to back) stem & leaf plot for the container vs. fountain amounts of caffeine. (Do not use the data for carbonated sodas where caffeine was not detected.) Describe how the two distributions compare.
(b)What do you think might explain the differences between the two distributions?
Question
Exhibit 2-3
There has been a recent increase in the popularity of caffeine-containing "energy drinks" or "functional beverages"--substances that are considered to be food that may provide some health benefit. However, caffeine in these drinks presents an important health concern, especially for women of childbearing age. Studies have shown an increased risk of spontaneous abortion and low birth weight children to women consuming more than 150 mg/day of caffeine. In a recent study, eighteen 12-oz servings of different brands of carbonated sodas were analyzed to ascertain their caffeine content, with the results presented below. The data are in mg/12-oz serving; if no caffeine was detected, this is reported as "* mg/serving."
Caffeine (mg) in 12 oz servings of Carbonated Sodas
Refer to Exhibit 2-3.
(a)Construct a stem and leaf plot of the caffeine-content for the detected amounts of caffeine.
(b)In a few sentences, describe the distribution of the caffeine-content. How would your description change if the "none detected" were treated as 0.0 mg/serving?
Question
In a story written in December 2002, the Des Moines Register reported on the percentages of students who qualify for Free/Reduced lunch programs in the elementary schools in Des Moines, Iowa. The data, by elementary school, appears in the table below. 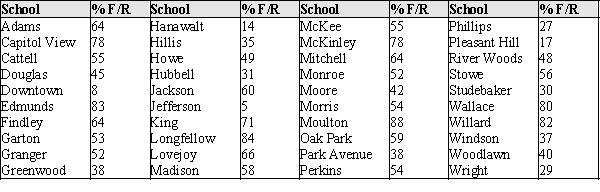 The data presented in the table about the Des Moines, Iowa, elementary schools was from an article that related the percent of children eligible for Free and Reduced lunch and teacher experience. The percent of children eligible for Free/Reduced lunch is generally regarded as an indicator of the socio-economic status of a neighborhood. The concern of the Des Moines Register in the article was that the least experienced teachers typically teach students from low-income families. The accompanying scatter plot shows the data from the article.
 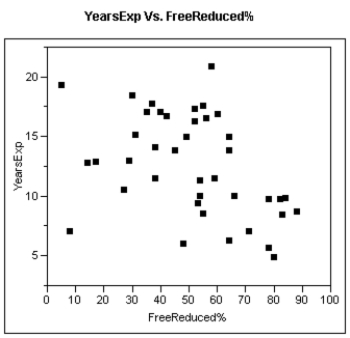 (a)If the Des Moines Register is correct, what sort of pattern should "ideally" appear in the scatter plot?
(b)Does this pattern emerge in these data? (Hint: Consider separately those schools with less than 75% eligibility, and those with greater than 75% eligibility for Free/Reduced lunch.)
The data presented in the table about the Des Moines, Iowa, elementary schools was from an article that related the percent of children eligible for Free and Reduced lunch and teacher experience. The percent of children eligible for Free/Reduced lunch is generally regarded as an indicator of the socio-economic status of a neighborhood. The concern of the Des Moines Register in the article was that the least experienced teachers typically teach students from low-income families. The accompanying scatter plot shows the data from the article. (a)If the Des Moines Register is correct, what sort of pattern should "ideally" appear in the scatter plot?(b)Does this pattern emerge in these data? (Hint: Consider separately those schools with less than 75% eligibility, and those with greater than 75% eligibility for Free/Reduced lunch.)
Question
The pie chart below summarizes the results of a survey of 300 randomly selected students at a particular high school. The investigators asked about soft drink preferences at a local high school. 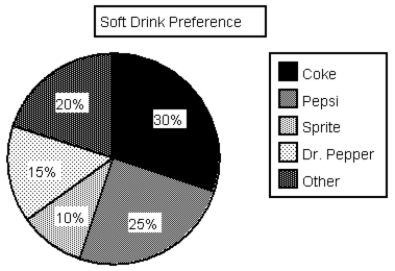 (a)How many out of the 300 students indicated a preference for Dr. Pepper?
(b)Write a few sentences summarizing the soft drink preference for this sample of students.
(c)Using the information in the pie chart above, sketch a relative frequency bar chart for these data.
(a)How many out of the 300 students indicated a preference for Dr. Pepper?(b)Write a few sentences summarizing the soft drink preference for this sample of students.
(c)Using the information in the pie chart above, sketch a relative frequency bar chart for these data.
Question
Exhibit 2-4
In the article, "Scaling of Mammalian Long Bones: Small and Large Mammals Compared," the average circumferences (distances around) in mm of the humerus, femur, and tibia of different species of mammals were reported. These are the long bones that primarily support the body mass in mammals. Each data value is the mean circumference for the available measures for a single species.
Refer to Exhibit 2-4.
Biologists speculate that the different amounts of weight might be supported by different sized bones. Based on the histograms, does it seem like one of these bones has on average a greater or lesser circumferences? Explain.
Question
Question
In the article, "Dimensional Relationships for Flying Animals," the wing areas in square centimeters of gliding birds of prey are reported. Night hunters are distinguished from the birds that hunt during the daylight hours, and the wing areas for samples of each type of bird are displayed in the following table: 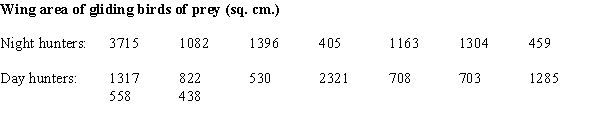
a)Construct a comparative (back to back) stem & leaf plot for the wing area for the two types of birds.
(b)Biologists speculate that since birds could be detected at a distance by their prey during the day, the species that hunt during the day should be smaller on average than those that hunt at night. Are the data as displayed in part (a) consistent with this theory? What specific aspects of the plot in part (a) support your answer?
Question
One of the "media messages" sent by television is that appearance is a very important aspect of one's being. These messages are thought to spur young women to have unrealistic expectations about beauty, thus spending billions of dollars on cosmetics and toiletries. Some of these messages were studied during the 1999-2000 prime-time television season, when investigators kept track of the "appearance" comments. Some of their data, comments by males, classified by gender of recipient and type of appearance comment, is reproduced in the table below. 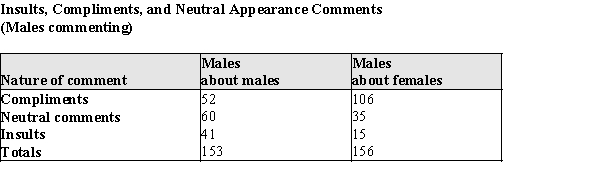
(a)Construct two pie charts, one for comments about males, one for comments about females, to summarize the data above.
(b)Using the information in the table above and the pie charts in part (a), display the given information in a comparative bar chart.
In the same study of appearance comments mentioned, comments by females were tabulated. That data appears below: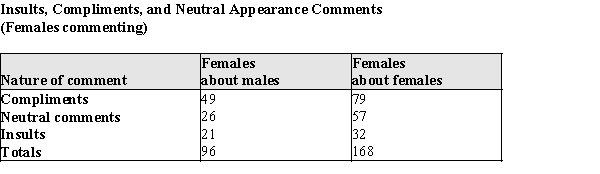
(c)Display these data in a segmented bar chart to compare the distribution of comments in these two samples.
(d)Based on the information from the graphs in parts (a) - (c), how do the distributions differ when men rather than women are making the comments, and how do they differ when men rather than women are the recipients of the comments?
Question
In 1986 marine biologists reported the discovery of a new species of fish in the Western North Atlantic. Data on the head length (n = 41) and pelvic fin length (n = 30) are shown below. 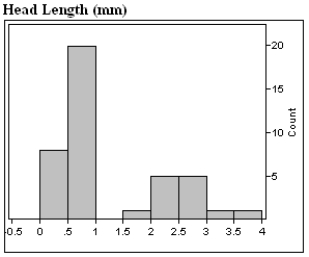
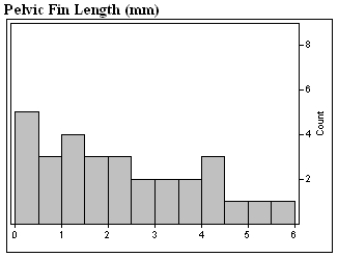 a)Describe in appropriate statistical terms, the distributions of these two variables.
b)The distribution of head lengths certainly appears to be rather strange. What do you think might account for the shape of this distribution?
a)Describe in appropriate statistical terms, the distributions of these two variables.b)The distribution of head lengths certainly appears to be rather strange. What do you think might account for the shape of this distribution?
Question
In recent years there has been a change in the grocery shopping habits of shoppers. "Non-traditional" stores such as gas stations and Wal-Marts are now selling groceries. The stacked bar chart below shows the percentages of market share for Traditional, Non-traditional, and Convenience stores for 1988 and 2005. 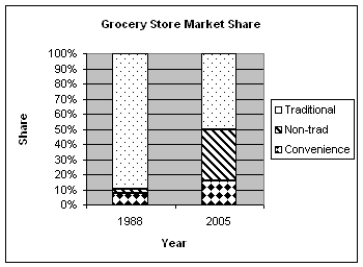 (a)In a few sentences describe how the proportions of market share have changed for traditional grocery stores from 1988 to 2005.
(b)The market share for which type of store has grown the most, compared to their market share in 1988. What aspect of the chart shows this?
(a)In a few sentences describe how the proportions of market share have changed for traditional grocery stores from 1988 to 2005.(b)The market share for which type of store has grown the most, compared to their market share in 1988. What aspect of the chart shows this?
Question
Iowa is an agricultural state with a large number of rivers. The use of chemical pesticides and increasing size of livestock herds has created a concern for the water quality in the state. A researcher recently surveyed the rivers of Iowa and analyzed the concentrations of certain chemicals at different locations in the watersheds of Iowa. The cumulative relative frequency plot below displays the distribution of Nitrogen concentrations along the Cedar River. 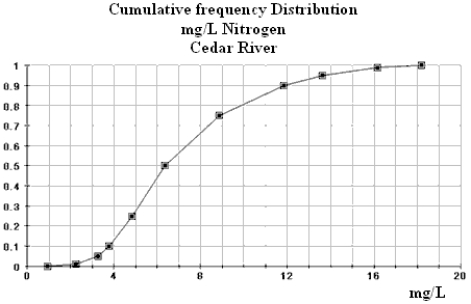 (a)Approximately what percent of the Nitrogen concentration measurements are less than 10 mg/L?
(b)Approximately what percent of the Nitrogen concentration measurements are 12 mg/L or more?
(c)50% of the Nitrogen concentration measurements lie below what approximate value?
(a)Approximately what percent of the Nitrogen concentration measurements are less than 10 mg/L?(b)Approximately what percent of the Nitrogen concentration measurements are 12 mg/L or more?
(c)50% of the Nitrogen concentration measurements lie below what approximate value?
Question
Each person in a sample of 800 students who identified themselves as Democrats was asked about his or her mother's political party. The responses are summarized in the following table:  Construct and sketch a pie chart for these data.
Construct and sketch a pie chart for these data. Question
Question
Iowa is an agricultural state with a large number of rivers. The use of chemical pesticides and increasing size of livestock herds has created a concern for the water quality in the state. A researcher recently surveyed the rivers of Iowa and analyzed the concentrations of certain chemicals at different locations in the watersheds of Iowa. The cumulative relative frequency plot below displays the distribution of Nitrogen concentrations along the Skunk River. 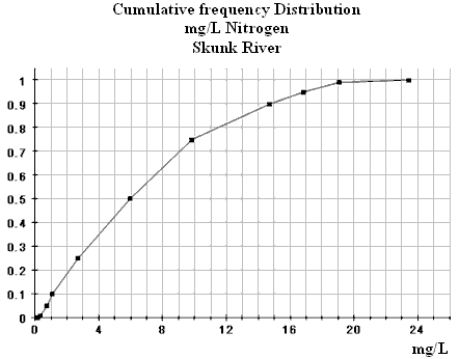 (a)Approximately what percent of the Nitrogen concentration measurements are less than 10 mg/L?
(b)Approximately what percent of the Nitrogen concentration measurements are 12 mg/L or more?
(c)50% of the Nitrogen concentration measurements lie below what approximate value?
(a)Approximately what percent of the Nitrogen concentration measurements are less than 10 mg/L?(b)Approximately what percent of the Nitrogen concentration measurements are 12 mg/L or more?
(c)50% of the Nitrogen concentration measurements lie below what approximate value?
Question
Records of the missions of Baja California in the form of baptisms and burial records provide an ideal opportunity to examine the consequences of what is known as the "Colombian Exchange," the movement of organisms large and small between the Old and New Worlds after the appearance of Columbus in 1492. The data below are two time series of the numbers of baptisms at two Central Baja missions, San Jose de Comondu and San Gertrudis. The data are for the decade 1770 - 1779. 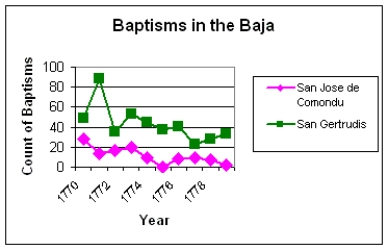 (a)How would you generally describe the trend of baptisms for the two missions over this period? Do the missions appear to show similar trends? Justify your response by appealing to the graph.
(b)One of the influences of the meeting of the Old and New Worlds was the transmission of diseases to the native populations, who had developed no natural immunity from European diseases. If there were anecdotal evidence for an outbreak of disease during this time, which mission and what year seems to be the most likely candidate? Again, justify your response by appealing to the graph.
(a)How would you generally describe the trend of baptisms for the two missions over this period? Do the missions appear to show similar trends? Justify your response by appealing to the graph.(b)One of the influences of the meeting of the Old and New Worlds was the transmission of diseases to the native populations, who had developed no natural immunity from European diseases. If there were anecdotal evidence for an outbreak of disease during this time, which mission and what year seems to be the most likely candidate? Again, justify your response by appealing to the graph.
Question
Investigators writing in the Journal of Early Adolescence were interested in the communication about sex and related topics between parents and 12-14 year olds. The investigators asked students and parents whether or not they had communicated with their child/parent about topics such as pregnancy, how to say "no," and methods of contraception. A scatter plot of their data is presented below. Each point represents one topic listed by the investigators. For example, 72.4% of parents and 57.6% of adolescents said the parents had discussed childbirth. This would be recorded as the point (57.6, 72.4). 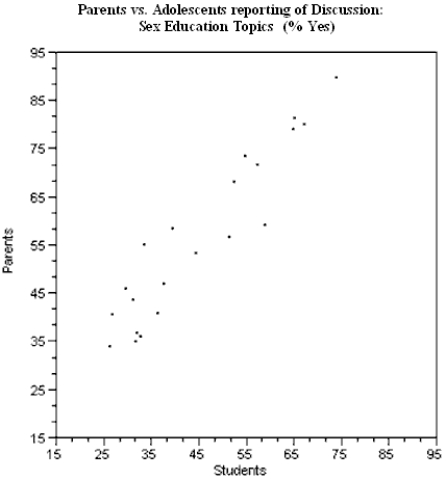 (a)On the graph above, sketch the line y = x, representing a line of "perfect agreement" between the parents and adolescents.
(b)What explanation do you have for the placement of the points in the scatter plot relative to the line you sketched in part (a)?
(a)On the graph above, sketch the line y = x, representing a line of "perfect agreement" between the parents and adolescents.(b)What explanation do you have for the placement of the points in the scatter plot relative to the line you sketched in part (a)?
Question
Professor wants to identify the relationship between the test scores in her class and the number of hours spent by student preparing to the test. She collected information about preparing time and the test scores in the table below. 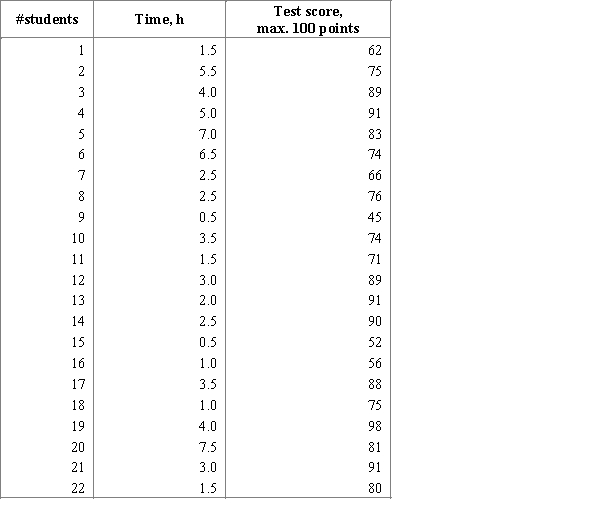 Choose the most appropriate graphical display for professor to see the relationship between preparing time and the test scores.
A)Bar Chart
B)Comparative Bar Chart
C)Time Series Plot
D)Scatterplot
E)Histogram
Choose the most appropriate graphical display for professor to see the relationship between preparing time and the test scores.A)Bar Chart
B)Comparative Bar Chart
C)Time Series Plot
D)Scatterplot
E)Histogram
Question
According to the data from fec.gov, since the year 1980, in Texas candidates from the Republican Party won the presidential elections. Following table represents the results of elections since 1984. 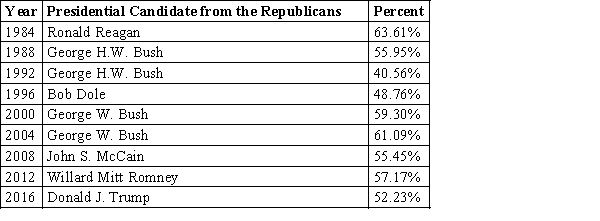 Choose the most appropriate graphical display for the results of elections in Texas.
A)Bar Chart
B)Comparative Bar Chart
C)Time Series Plot
D)Stem-and-Leaf Display
E)Histogram
Choose the most appropriate graphical display for the results of elections in Texas.
A)Bar Chart
B)Comparative Bar Chart
C)Time Series Plot
D)Stem-and-Leaf Display
E)Histogram

Unlock Deck
Sign up to unlock the cards in this deck!
Unlock Deck
Unlock Deck
1/64
Play
Full screen (f)
Deck 2: Graphical Methods for Describing Data Distributions
1
A data set consisting of many observations of a single characteristic is a categorical data set.
False
2
One advantage of histograms is that they may be used for large data sets.
True
3
A curve with tails that decline more rapidly than the tails of a normal curve is called a heavy-tailed distribution.
False
4
A data set is discrete if the possible values are isolated points on the number line.
Unlock Deck
Unlock for access to all 64 flashcards in this deck.
Unlock Deck
k this deck
5
A survey form solicited the following responses:
I). age of respondent
II) gender of respondent
III). level of job satisfaction (completely dissatisfied/somewhat dissatisfied/somewhat satisfied/completely satisfied)
IV). annual income
Which of the responses represent categorical data?
A)I only
B)II only
C)III only
D)II and III only
E)All the responses are categorical.
Unlock Deck
Unlock for access to all 64 flashcards in this deck.
Unlock Deck
k this deck
6
A data set is multivariate if it consists only of numeric variables.
Unlock Deck
Unlock for access to all 64 flashcards in this deck.
Unlock Deck
k this deck
7
In a scatter plot, both the horizontal and vertical axes must be set at zero.
Unlock Deck
Unlock for access to all 64 flashcards in this deck.
Unlock Deck
k this deck
8
The following relative frequency distribution summarizes student responses to the question "If you could make your college choice over, would you still choose to enroll at your current college?" Which of the following is the correct bar chart for the response data?
A)
B)
C)
D)
E)
Which of the following is the correct bar chart for the response data?A)
B)
C)
D)
E)
Unlock Deck
Unlock for access to all 64 flashcards in this deck.
Unlock Deck
k this deck
9
A pie chart is most useful for numeric data.
Unlock Deck
Unlock for access to all 64 flashcards in this deck.
Unlock Deck
k this deck
10
If the upper tail of a distribution stretches out farther than the lower tail, the distribution is negatively skewed.
Unlock Deck
Unlock for access to all 64 flashcards in this deck.
Unlock Deck
k this deck
11
For stem and leaf plots with single-digit leaves, commas must be used to separate the leaves.
Unlock Deck
Unlock for access to all 64 flashcards in this deck.
Unlock Deck
k this deck
12
A survey asked adult respondents how dependent they were on various electronic devices. The accompanying table summarizes the responses. Select a comparative bar chart that shows the distributions of responses for the three different technologies.
A)
B)
C)
D)
E)
Select a comparative bar chart that shows the distributions of responses for the three different technologies.A)
B)
C)
D)
E)
Unlock Deck
Unlock for access to all 64 flashcards in this deck.
Unlock Deck
k this deck
13
Which of the following variables are discrete? I). the volume of liquid in a 16-ounce bottle of soda pop
II)) the percentage of males 18-25 who participate in a contact sport
III). the number of broken eggs in a package of a dozen eggs
IV)) a count of the statistics majors at a certain university
A)II only
B)II and III only
C)III and IV only
D)I only
E)All of these variables are discrete.
II)) the percentage of males 18-25 who participate in a contact sport
III). the number of broken eggs in a package of a dozen eggs
IV)) a count of the statistics majors at a certain university
A)II only
B)II and III only
C)III and IV only
D)I only
E)All of these variables are discrete.
Unlock Deck
Unlock for access to all 64 flashcards in this deck.
Unlock Deck
k this deck
14
Dotplots work best for small and moderate sized numerical data sets.
Unlock Deck
Unlock for access to all 64 flashcards in this deck.
Unlock Deck
k this deck
15
Bar charts should be used with categorical data.
Unlock Deck
Unlock for access to all 64 flashcards in this deck.
Unlock Deck
k this deck
16
The quantity often gives a rough estimate of the appropriate number of intervals in a histogram.
often gives a rough estimate of the appropriate number of intervals in a histogram. Unlock Deck
Unlock for access to all 64 flashcards in this deck.
Unlock Deck
k this deck
17
An outlier is an unusually small or large data value.
Unlock Deck
Unlock for access to all 64 flashcards in this deck.
Unlock Deck
k this deck
18
The relative frequency for a particular category is the number of times the category appears in the data.
Unlock Deck
Unlock for access to all 64 flashcards in this deck.
Unlock Deck
k this deck
19
The density of a class can be calculated by multiplying the relative frequency of the class times the class width.
Unlock Deck
Unlock for access to all 64 flashcards in this deck.
Unlock Deck
k this deck
20
Frequency distributions can only be used with categorical data.
Unlock Deck
Unlock for access to all 64 flashcards in this deck.
Unlock Deck
k this deck
21
A statewide survey released by the University of Iowa Injury Prevention Research Center was designed to assess compliance with Iowa seatbelt law. The table below shows the results for 5 Iowa cities.
(a)Display these data in a comparative bar chart so that the different ages can be compared for the different cities.
(b)Write a brief description of the differences and similarities in the patterns you observe in your bar chart for part (a).
(a)Display these data in a comparative bar chart so that the different ages can be compared for the different cities.
(b)Write a brief description of the differences and similarities in the patterns you observe in your bar chart for part (a).
Unlock Deck
Unlock for access to all 64 flashcards in this deck.
Unlock Deck
k this deck
22
The frequency distribution shown summarizes data on the percentage of college students enrolled in public institutions for the 50 U.S. states. What is the relative frequency for the 70 to < 80 interval?
A)0.05
B)0.10
C)0.22
D)11
E)50
What is the relative frequency for the 70 to < 80 interval?A)0.05
B)0.10
C)0.22
D)11
E)50
Unlock Deck
Unlock for access to all 64 flashcards in this deck.
Unlock Deck
k this deck
23
Bat characteristics
Biologists know that bats have different flight characteristics. Some bats exhibit fast, straight, and long flights; others are moderately slow, and highly maneuverable. The flight capabilities of bats are presumably a function of (a) the characteristics of the bat wings, and (b) the laws of physics. The data presented below are wing spans in centimeters for certain species of bats from Nicaragua and Costa Rica. Two categories of bat species are represented: fruit-eaters and insect-eaters.
Fruit eaters:
25.2, 27.2, 42.0, 44.8, 31.3, 32.5, 32.0, 28.1, 30.7, 27.0, 41.1, 41.6, 58.4, 58.7, 53.9
Insect eaters:
32.8, 27.4, 21.0, 23.9, 27.5, 22.4, 18.7
(a)Construct two dotplots that will allow you to easily compare the distributions of the wing spans for the two categories of bats, fruit-eaters and insect-eaters.
(b)Write a short paragraph describing the features of the two plots; what do these plots tell you about the differences in wing span for fruit- and insect-eaters?
Unlock Deck
Unlock for access to all 64 flashcards in this deck.
Unlock Deck
k this deck
24
The annual household incomes, in thousands of dollars, for 150 households in a small community are summarized in the histogram below. What proportion of households have annual incomes of $90,000 or more?
A)0.85
B)0.67
C)0.08
D)0.15
E)0.11
What proportion of households have annual incomes of $90,000 or more?A)0.85
B)0.67
C)0.08
D)0.15
E)0.11
Unlock Deck
Unlock for access to all 64 flashcards in this deck.
Unlock Deck
k this deck
25
The annual household incomes, in thousands of dollars, for 500 households in a small community are summarized in the histogram below. Which of the following values best describes a typical household income for this community?
A)$40,000
B)$50,000
C)$60,000
D)$70,000
E)$80,000
Which of the following values best describes a typical household income for this community?A)$40,000
B)$50,000
C)$60,000
D)$70,000
E)$80,000
Unlock Deck
Unlock for access to all 64 flashcards in this deck.
Unlock Deck
k this deck
26
Ruminants are hoofed animals such as cattle and sheep. Two categories of ruminants are browsers (leaf eaters) and grazers (grass eaters). Some biologists believe that the incisor arcade, that part of the mouth between the incisors, is shaped differently for browsers and grazers, and that might explain their food selection. The "curvature" of an incisor arcade is a measure of its shape, with large values indicating a long, thin mouth, and small values a shorter, wider mouth. The back-to-back stem plot below compares the curvatures of incisor arcades of a sample of species of browsers and grazers in the ruminant family.
(a)Briefly describe each of the two curvature distributions, browsers and grazers, noting any unusual features of the data.
(b)The theory of some biologists is that browsers have thinner mouths because the browse plants frequently have thorns and spines; browsers have evolved to have thinner mouths to get beyond the thorns and spines to the food part of the plant. Is the data in the back-to-back stem plot consistent with this theory? What aspect of the data would you consider when answering this question?
Unlock Deck
Unlock for access to all 64 flashcards in this deck.
Unlock Deck
k this deck
27
The cumulative relative frequency plot shown was constructed using data on the percentage of college students enrolled in public institutions for the 50 U.S. states. Which of the following is closest to the approximate proportion of states that have more than 90 percent of college students enrolled in public institutions?
A)0.6
B)0.1
C)0.0
D)0.4
E)0.9
A)0.6
B)0.1
C)0.0
D)0.4
E)0.9
Unlock Deck
Unlock for access to all 64 flashcards in this deck.
Unlock Deck
k this deck
28
Exhibit 2-4
In the article, "Scaling of Mammalian Long Bones: Small and Large Mammals Compared," the average circumferences (distances around) in mm of the humerus, femur, and tibia of different species of mammals were reported. These are the long bones that primarily support the body mass in mammals. Each data value is the mean circumference for the available measures for a single species.
Refer to Exhibit 2-4.
Describe the differences and similarities in the distributions of these different mammalian bones.
Unlock Deck
Unlock for access to all 64 flashcards in this deck.
Unlock Deck
k this deck
29
The most important right and responsibility of citizens in a democratic society is voting. The bar chart below shows, for different age groups in the 2000 presidential election in the United States, the percentage of individuals in that age group who are registered to vote. (a)Describe in a few sentences the registration pattern that you see in the data above.
(b)Some individuals argue that the reason for the current level of registration in the 18-24 year-old group is that many of them are college students and would have to vote absentee. In your opinion, would that explain the registration level for the 18 - 24 age-group? Why or why not?
(a)Describe in a few sentences the registration pattern that you see in the data above.(b)Some individuals argue that the reason for the current level of registration in the 18-24 year-old group is that many of them are college students and would have to vote absentee. In your opinion, would that explain the registration level for the 18 - 24 age-group? Why or why not?
Unlock Deck
Unlock for access to all 64 flashcards in this deck.
Unlock Deck
k this deck
30
Artificial nest have often been used when biologists study predation on birds. It is usually assumed that predators will respond to artificial nests in the same way they do to real birds' nests. A recent experiment was performed to check this assumption for predators of the American robin (Turdus migratorius) by comparing the egg loss in three experimental treatments: (1) natural robin's nests, (2) artificial wicker-basket nests placed 30 meters in a random direction from natural robin's nests, and (3) artificial wicker-basket nests placed in a 180 m by 240 m grid around robin's nests. The data below are cumulative counts of eggs predated (stolen or broken and eaten) at 5, 10, and 15 day points of the experiment.
(a)Construct a bar chart to display the cumulative counts for the natural robin nests at their 5-, 10-, and 15-day checks.
(b)Fill in the relative frequency distribution (table) representing the cumulative counts for the artificial nests in the grid. (Do not convert the table to a graph.)
(a)Construct a bar chart to display the cumulative counts for the natural robin nests at their 5-, 10-, and 15-day checks.
(b)Fill in the relative frequency distribution (table) representing the cumulative counts for the artificial nests in the grid. (Do not convert the table to a graph.)
Unlock Deck
Unlock for access to all 64 flashcards in this deck.
Unlock Deck
k this deck
31
Exhibit 2-2
In a story written in December 2002, the Des Moines Register reported on the percentages of students who qualify for Free/Reduced lunch programs in the elementary schools in Des Moines, Iowa. The data, by elementary school, appears in the table below.
Refer to Exhibit 2-2.
(a)Construct a histogram for these data, using the following class intervals:
0 to < 20
20 to < 40, etc.
(b)Describe the distribution of Free/Reduced eligibility percents, and note any unusual features.
Unlock Deck
Unlock for access to all 64 flashcards in this deck.
Unlock Deck
k this deck
32
Biologists know that bats have different flight characteristics. Some bats exhibit fast, straight, and long flights; others are moderately slow, and highly maneuverable. The flight capabilities of bats are presumably a function of (a) the characteristics of the bat wings, and (b) the laws of physics. The data presented below are wing weights in grams for certain species of bats from Nicaragua and Costa Rica. Two categories of bat species are represented: fruit-eaters and insect-eaters.
Fruit eaters:
9.9, 11.5, 47.0, 59.6, 18.2, 22.1, 22.9, 15.0, 15.4, 13.3, 38.3, 42.2, 114.3, 105.4, 80.9
Insect eaters:
23.8, 16.1, 4.2, 3.9, 7.5, 3.5, 3.9
(a)Construct two dotplots that will allow you to easily compare the distributions of the wing weights for the two categories of bats, fruit-eaters and insect-eaters.
(b)Write a short paragraph describing the features of the two plots; what do these plots tell you about the differences in wing weight for fruit- and insect-eaters?
Unlock Deck
Unlock for access to all 64 flashcards in this deck.
Unlock Deck
k this deck
33
In a study of how college students give directions from maps, 40 Introductory Psychology volunteers, 20 men and 20 women, were given the task of giving directions to another. Observations were made of subjects' direction-giving behavior in the experiment:
(a)whether the map was available, or the directions were given from memory,
(b)the sex of the direction giver,
(c)the distances given as part of the directions,
(d)the number of times directions such as North, Southwest, etc. were used, and
(e)the frequency of errors in the directions
For each of the variables in this experiment, determine whether it is categorical or numerical. For each numerical variable, determine whether it is discrete or continuous:
(a)whether the map was available, or the directions were given from memory
(b)the sex of the direction giver
(c)the distances given as part of the directions
(d)the number of times directions such as North, Southwest, etc. were used
(e)Frequency of errors in the directions
Unlock Deck
Unlock for access to all 64 flashcards in this deck.
Unlock Deck
k this deck
34
Unlock Deck
Unlock for access to all 64 flashcards in this deck.
Unlock Deck
k this deck
34
In a psychological study of distance perception, introductory psychology class volunteers were given 5, 10, or 15 extra credit points depending on their level of participation in the experiment. They walked along paths laid out along hallways in the psychology building, and were asked to judge the distance they had walked. Each path distance was between 100 and 200 feet in length, and contained from two to seven 90 degree turns. The investigators also kept track of class standing (freshman, sophomore, junior, or senior). For each of the variables in this study, determine whether it is categorical or numerical. For each numerical variable, determine whether it is discrete or continuous:
(a)The true length of the path
(b)The amount of credit given to the volunteers
(c)The length of the path as judged by the students
(d)The number of 90 degree turns
(e)Class standing
(a)The true length of the path
(b)The amount of credit given to the volunteers
(c)The length of the path as judged by the students
(d)The number of 90 degree turns
(e)Class standing
Unlock Deck
Unlock for access to all 64 flashcards in this deck.
Unlock Deck
k this deck
35
The stem plot below displays the weights (in ounces) of a random sample of tomatoes grown on a local farm
(a)Briefly describe the distribution of tomato weights.
(b)What is the weight of the heaviest tomato in the sample?
(a)Briefly describe the distribution of tomato weights.
(b)What is the weight of the heaviest tomato in the sample?
Unlock Deck
Unlock for access to all 64 flashcards in this deck.
Unlock Deck
k this deck
35
Unlock Deck
Unlock for access to all 64 flashcards in this deck.
Unlock Deck
k this deck
36
One interesting aspect of surveys is that the order of the questions can affect the results. This is thought to occur because one question can alter the response to a subsequent question. In 1948 many people in the United States were concerned about the spread of communism as a political and economic philosophy. A survey given that year contained both of the following questions:
1. Do you think the United States should let Communist newspaper reporters from other countries come in here and send back to their papers the news as they see it?
2. Do you think a Communist country like Russia should let American newspaper reporters come in and send back to America the news as they see it?
The following table contains the percentages of the Yes/No answers given by respondents when asked these questions in different orders.
a) Construct a comparative bar chart for these response percentages.
b) Interpret the results of the 1948 survey. Do you think the order of the questions made a difference in the responses? Explain.
Unlock Deck
Unlock for access to all 64 flashcards in this deck.
Unlock Deck
k this deck
37
Which of the following stem and leaf plots corresponds a data distribution that is positively (right) skewed? I. II. III.
A)I only
B)II only
C)III only
D)I and III only
E)None of the distributions is positively skewed.
II. III. A)I only
B)II only
C)III only
D)I and III only
E)None of the distributions is positively skewed.
Unlock Deck
Unlock for access to all 64 flashcards in this deck.
Unlock Deck
k this deck
38
According to the stem-and-leaf display below, how many times does the number 58 appear in the data set?
A)0
B)1
C)2
D)5
E)58
A)0
B)1
C)2
D)5
E)58
Unlock Deck
Unlock for access to all 64 flashcards in this deck.
Unlock Deck
k this deck
39
An experiment was performed to determine which brand of comparably priced light bulbs, A or B, lasts longer on average. Ten bulbs of each brand were tested, and their lifetimes recorded in hours. The data are shown below:
Bulb A: 88, 97, 110, 122, 128, 129, 135, 141, 150, 165
Bulb B: 23, 55, 93, 106, 111, 115, 123, 128, 153, 171
(a)Display these data using a comparative (back-to-back) stemplot.
(b)What are the differences and similarities in the lifetime distributions for the two samples?
(c)If your preference for brand A or B must be determined from the information in parts (a) and (b), which brand would you buy? Explain your choice using appropriate statistical terminology.
Unlock Deck
Unlock for access to all 64 flashcards in this deck.
Unlock Deck
k this deck
40
Bird-plane collisions
Collisions between birds and airplanes are a major problem, threatening passenger safety and resulting in costly repairs. During the years 1990 - 1994, researchers gathered bird remains from runways at Lihue Airport on the island of Kauai, Hawaii. The data below are counts of birds found on the runway used for takeoffs and the runway used for landings from the 4 most frequently involved species:
(a)Construct a bar chart to display the bird species data for the landing runway.
(b)Construct a relative frequency distribution (table) representing the bird species data for the takeoff runway.
Collisions between birds and airplanes are a major problem, threatening passenger safety and resulting in costly repairs. During the years 1990 - 1994, researchers gathered bird remains from runways at Lihue Airport on the island of Kauai, Hawaii. The data below are counts of birds found on the runway used for takeoffs and the runway used for landings from the 4 most frequently involved species:
(a)Construct a bar chart to display the bird species data for the landing runway.
(b)Construct a relative frequency distribution (table) representing the bird species data for the takeoff runway.
Unlock Deck
Unlock for access to all 64 flashcards in this deck.
Unlock Deck
k this deck
41
In a survey of 30 working adults who earn less than $6,000 per year, investigators asked about job satisfaction and income. The responses are summarized in the following table: Construct and sketch a pie chart for these data.
Construct and sketch a pie chart for these data. Unlock Deck
Unlock for access to all 64 flashcards in this deck.
Unlock Deck
k this deck
42
Artificial bird nests have been used extensively when studying predator behavior. The assumption is that predators will find and respond to artificial nests in the same way they do to the natural nests. In a study to test this hypothesis the predation of 27 American Robin (Turdus migratorius) nests and 27 artificial wicker-basket nests were compared. Artificial nests were placed 30m from existing robin's nests in a randomly chosen direction. The natural nests and artificial nests were checked at 5-day intervals, and the number of nests (out of 27) that had been disturbed by predators in the interval was noted. The results are as follows:
(a)Construct a time series plot for the number of natural nests disturbed by predators. Use the same set of axes to plot the number of artificial nests disturbed by predators.
(b)Does it appear that the artificial and natural nests have the same pattern of predation? Justify your answer by appealing to specific aspects of your plot in part (a).
Unlock Deck
Unlock for access to all 64 flashcards in this deck.
Unlock Deck
k this deck
43
Investigators studying the relation between gender and the interests of early adolescents asked boys and girls in grades 5-9 to indicate on a 7-point scale their degree of interest in topics such as Life, Sports, and Cars.
The data in the scatter plot represent average levels of interest for boys and girls in grades 5 - 9. Each point represents one topic listed by the investigators. For example, boys average rating for "Opposite sex" as a 6.2, while girls on average rated their interest in this topic as 6.0 on the 7 point interest scale. This is recorded as the point (6.2, 6.0). There are three interesting features of this scatter plot that you are to interpret below. What can you infer from each of these features of the scatterplot?
(a)The points generally seem to scatter around the line, y = x.
(b)There seem to be three clusters of points, one in the lower left, one in the middle, and one in the upper right of the graph.
(c)There are two points (as indicated by the arrows) that do not seem to fit the overall pattern. What can be said about the topics these points represent?
The data in the scatter plot represent average levels of interest for boys and girls in grades 5 - 9. Each point represents one topic listed by the investigators. For example, boys average rating for "Opposite sex" as a 6.2, while girls on average rated their interest in this topic as 6.0 on the 7 point interest scale. This is recorded as the point (6.2, 6.0).
There are three interesting features of this scatter plot that you are to interpret below. What can you infer from each of these features of the scatterplot?(a)The points generally seem to scatter around the line, y = x.
(b)There seem to be three clusters of points, one in the lower left, one in the middle, and one in the upper right of the graph.
(c)There are two points (as indicated by the arrows) that do not seem to fit the overall pattern. What can be said about the topics these points represent?
Unlock Deck
Unlock for access to all 64 flashcards in this deck.
Unlock Deck
k this deck
44
As part of the United States Census, data is also collected on the number of persons in each household. The census data for four decades is summarized below. (a)In a few sentences describe how the proportion of households with 4 people has changed from 1970 to 2000.
(b)What size of household appears to have decreased the most from 1970 to 2000?
(a)In a few sentences describe how the proportion of households with 4 people has changed from 1970 to 2000.(b)What size of household appears to have decreased the most from 1970 to 2000?
Unlock Deck
Unlock for access to all 64 flashcards in this deck.
Unlock Deck
k this deck
45
Exhibit 2-3
There has been a recent increase in the popularity of caffeine-containing "energy drinks" or "functional beverages"--substances that are considered to be food that may provide some health benefit. However, caffeine in these drinks presents an important health concern, especially for women of childbearing age. Studies have shown an increased risk of spontaneous abortion and low birth weight children to women consuming more than 150 mg/day of caffeine. In a recent study, eighteen 12-oz servings of different brands of carbonated sodas were analyzed to ascertain their caffeine content, with the results presented below. The data are in mg/12-oz serving; if no caffeine was detected, this is reported as "* mg/serving."
Caffeine (mg) in 12 oz servings of Carbonated Sodas
Refer to Exhibit 2-3.
a)Construct a comparative (back to back) stem & leaf plot for the container vs. fountain amounts of caffeine. (Do not use the data for carbonated sodas where caffeine was not detected.) Describe how the two distributions compare.
(b)What do you think might explain the differences between the two distributions?
Unlock Deck
Unlock for access to all 64 flashcards in this deck.
Unlock Deck
k this deck
46
Exhibit 2-3
There has been a recent increase in the popularity of caffeine-containing "energy drinks" or "functional beverages"--substances that are considered to be food that may provide some health benefit. However, caffeine in these drinks presents an important health concern, especially for women of childbearing age. Studies have shown an increased risk of spontaneous abortion and low birth weight children to women consuming more than 150 mg/day of caffeine. In a recent study, eighteen 12-oz servings of different brands of carbonated sodas were analyzed to ascertain their caffeine content, with the results presented below. The data are in mg/12-oz serving; if no caffeine was detected, this is reported as "* mg/serving."
Caffeine (mg) in 12 oz servings of Carbonated Sodas
Refer to Exhibit 2-3.
(a)Construct a stem and leaf plot of the caffeine-content for the detected amounts of caffeine.
(b)In a few sentences, describe the distribution of the caffeine-content. How would your description change if the "none detected" were treated as 0.0 mg/serving?
Unlock Deck
Unlock for access to all 64 flashcards in this deck.
Unlock Deck
k this deck
47
In a story written in December 2002, the Des Moines Register reported on the percentages of students who qualify for Free/Reduced lunch programs in the elementary schools in Des Moines, Iowa. The data, by elementary school, appears in the table below. The data presented in the table about the Des Moines, Iowa, elementary schools was from an article that related the percent of children eligible for Free and Reduced lunch and teacher experience. The percent of children eligible for Free/Reduced lunch is generally regarded as an indicator of the socio-economic status of a neighborhood. The concern of the Des Moines Register in the article was that the least experienced teachers typically teach students from low-income families. The accompanying scatter plot shows the data from the article. (a)If the Des Moines Register is correct, what sort of pattern should "ideally" appear in the scatter plot?
(b)Does this pattern emerge in these data? (Hint: Consider separately those schools with less than 75% eligibility, and those with greater than 75% eligibility for Free/Reduced lunch.)
The data presented in the table about the Des Moines, Iowa, elementary schools was from an article that related the percent of children eligible for Free and Reduced lunch and teacher experience. The percent of children eligible for Free/Reduced lunch is generally regarded as an indicator of the socio-economic status of a neighborhood. The concern of the Des Moines Register in the article was that the least experienced teachers typically teach students from low-income families. The accompanying scatter plot shows the data from the article. (a)If the Des Moines Register is correct, what sort of pattern should "ideally" appear in the scatter plot?(b)Does this pattern emerge in these data? (Hint: Consider separately those schools with less than 75% eligibility, and those with greater than 75% eligibility for Free/Reduced lunch.)
Unlock Deck
Unlock for access to all 64 flashcards in this deck.
Unlock Deck
k this deck
48
The pie chart below summarizes the results of a survey of 300 randomly selected students at a particular high school. The investigators asked about soft drink preferences at a local high school. (a)How many out of the 300 students indicated a preference for Dr. Pepper?
(b)Write a few sentences summarizing the soft drink preference for this sample of students.
(c)Using the information in the pie chart above, sketch a relative frequency bar chart for these data.
(a)How many out of the 300 students indicated a preference for Dr. Pepper?(b)Write a few sentences summarizing the soft drink preference for this sample of students.
(c)Using the information in the pie chart above, sketch a relative frequency bar chart for these data.
Unlock Deck
Unlock for access to all 64 flashcards in this deck.
Unlock Deck
k this deck
49
Exhibit 2-4
In the article, "Scaling of Mammalian Long Bones: Small and Large Mammals Compared," the average circumferences (distances around) in mm of the humerus, femur, and tibia of different species of mammals were reported. These are the long bones that primarily support the body mass in mammals. Each data value is the mean circumference for the available measures for a single species.
Refer to Exhibit 2-4.
Biologists speculate that the different amounts of weight might be supported by different sized bones. Based on the histograms, does it seem like one of these bones has on average a greater or lesser circumferences? Explain.
Unlock Deck
Unlock for access to all 64 flashcards in this deck.
Unlock Deck
k this deck
50
In birds, the muscles that pull the wing down, and thus cause the actual flight, are the "large pectorals." In the article, "Dimensional Relationships for Flying Animals," the author reports the following pectoral muscle weight in grams for birds of prey (Rapaces diurnes voiliers.)958, 715, 299, 476, 223, 270, 194, 226, 113.5, 79.8,
149, 84.2, 73.8, 53.8, 36, 48, 151
(a)Construct a stem and leaf plot of these data.
(b)In a few sentences, describe the distribution of the pectoral muscle weights.
149, 84.2, 73.8, 53.8, 36, 48, 151
(a)Construct a stem and leaf plot of these data.
(b)In a few sentences, describe the distribution of the pectoral muscle weights.
Unlock Deck
Unlock for access to all 64 flashcards in this deck.
Unlock Deck
k this deck
51
In the article, "Dimensional Relationships for Flying Animals," the wing areas in square centimeters of gliding birds of prey are reported. Night hunters are distinguished from the birds that hunt during the daylight hours, and the wing areas for samples of each type of bird are displayed in the following table:
a)Construct a comparative (back to back) stem & leaf plot for the wing area for the two types of birds.
(b)Biologists speculate that since birds could be detected at a distance by their prey during the day, the species that hunt during the day should be smaller on average than those that hunt at night. Are the data as displayed in part (a) consistent with this theory? What specific aspects of the plot in part (a) support your answer?
Unlock Deck
Unlock for access to all 64 flashcards in this deck.
Unlock Deck
k this deck
52
One of the "media messages" sent by television is that appearance is a very important aspect of one's being. These messages are thought to spur young women to have unrealistic expectations about beauty, thus spending billions of dollars on cosmetics and toiletries. Some of these messages were studied during the 1999-2000 prime-time television season, when investigators kept track of the "appearance" comments. Some of their data, comments by males, classified by gender of recipient and type of appearance comment, is reproduced in the table below.
(a)Construct two pie charts, one for comments about males, one for comments about females, to summarize the data above.
(b)Using the information in the table above and the pie charts in part (a), display the given information in a comparative bar chart.
In the same study of appearance comments mentioned, comments by females were tabulated. That data appears below:
(c)Display these data in a segmented bar chart to compare the distribution of comments in these two samples.
(d)Based on the information from the graphs in parts (a) - (c), how do the distributions differ when men rather than women are making the comments, and how do they differ when men rather than women are the recipients of the comments?
Unlock Deck
Unlock for access to all 64 flashcards in this deck.
Unlock Deck
k this deck
53
In 1986 marine biologists reported the discovery of a new species of fish in the Western North Atlantic. Data on the head length (n = 41) and pelvic fin length (n = 30) are shown below. a)Describe in appropriate statistical terms, the distributions of these two variables.
b)The distribution of head lengths certainly appears to be rather strange. What do you think might account for the shape of this distribution?
a)Describe in appropriate statistical terms, the distributions of these two variables.b)The distribution of head lengths certainly appears to be rather strange. What do you think might account for the shape of this distribution?
Unlock Deck
Unlock for access to all 64 flashcards in this deck.
Unlock Deck
k this deck
54
In recent years there has been a change in the grocery shopping habits of shoppers. "Non-traditional" stores such as gas stations and Wal-Marts are now selling groceries. The stacked bar chart below shows the percentages of market share for Traditional, Non-traditional, and Convenience stores for 1988 and 2005. (a)In a few sentences describe how the proportions of market share have changed for traditional grocery stores from 1988 to 2005.
(b)The market share for which type of store has grown the most, compared to their market share in 1988. What aspect of the chart shows this?
(a)In a few sentences describe how the proportions of market share have changed for traditional grocery stores from 1988 to 2005.(b)The market share for which type of store has grown the most, compared to their market share in 1988. What aspect of the chart shows this?
Unlock Deck
Unlock for access to all 64 flashcards in this deck.
Unlock Deck
k this deck
55
Iowa is an agricultural state with a large number of rivers. The use of chemical pesticides and increasing size of livestock herds has created a concern for the water quality in the state. A researcher recently surveyed the rivers of Iowa and analyzed the concentrations of certain chemicals at different locations in the watersheds of Iowa. The cumulative relative frequency plot below displays the distribution of Nitrogen concentrations along the Cedar River. (a)Approximately what percent of the Nitrogen concentration measurements are less than 10 mg/L?
(b)Approximately what percent of the Nitrogen concentration measurements are 12 mg/L or more?
(c)50% of the Nitrogen concentration measurements lie below what approximate value?
(a)Approximately what percent of the Nitrogen concentration measurements are less than 10 mg/L?(b)Approximately what percent of the Nitrogen concentration measurements are 12 mg/L or more?
(c)50% of the Nitrogen concentration measurements lie below what approximate value?
Unlock Deck
Unlock for access to all 64 flashcards in this deck.
Unlock Deck
k this deck
56
Each person in a sample of 800 students who identified themselves as Democrats was asked about his or her mother's political party. The responses are summarized in the following table: Construct and sketch a pie chart for these data.
Construct and sketch a pie chart for these data. Unlock Deck
Unlock for access to all 64 flashcards in this deck.
Unlock Deck
k this deck
57
A statistics company made a survey about using smartphones or regular cell phones versus the age group in one U.S. State. For each of the six age groups (younger than 18 years old, 18- to 24 years old, 25- to 39 years old, 40- to 59 years old, 60- to 69 years old, 70 years old and older) one was picked up hundred people were selected, which possessed either a smartphone, or a regular cell phone, or no possessed a cell phone at all.
Choose the more most appropriate graphical display for the statistical survey described above.
A)Bar Chart
B)Comparative Bar Chart
C)Dotplot
D)Stem-and-Leaf Display
E)Histogram
Choose the more most appropriate graphical display for the statistical survey described above.
A)Bar Chart
B)Comparative Bar Chart
C)Dotplot
D)Stem-and-Leaf Display
E)Histogram
Unlock Deck
Unlock for access to all 64 flashcards in this deck.
Unlock Deck
k this deck
58
Iowa is an agricultural state with a large number of rivers. The use of chemical pesticides and increasing size of livestock herds has created a concern for the water quality in the state. A researcher recently surveyed the rivers of Iowa and analyzed the concentrations of certain chemicals at different locations in the watersheds of Iowa. The cumulative relative frequency plot below displays the distribution of Nitrogen concentrations along the Skunk River. (a)Approximately what percent of the Nitrogen concentration measurements are less than 10 mg/L?
(b)Approximately what percent of the Nitrogen concentration measurements are 12 mg/L or more?
(c)50% of the Nitrogen concentration measurements lie below what approximate value?
(a)Approximately what percent of the Nitrogen concentration measurements are less than 10 mg/L?(b)Approximately what percent of the Nitrogen concentration measurements are 12 mg/L or more?
(c)50% of the Nitrogen concentration measurements lie below what approximate value?
Unlock Deck
Unlock for access to all 64 flashcards in this deck.
Unlock Deck
k this deck
59
Records of the missions of Baja California in the form of baptisms and burial records provide an ideal opportunity to examine the consequences of what is known as the "Colombian Exchange," the movement of organisms large and small between the Old and New Worlds after the appearance of Columbus in 1492. The data below are two time series of the numbers of baptisms at two Central Baja missions, San Jose de Comondu and San Gertrudis. The data are for the decade 1770 - 1779. (a)How would you generally describe the trend of baptisms for the two missions over this period? Do the missions appear to show similar trends? Justify your response by appealing to the graph.
(b)One of the influences of the meeting of the Old and New Worlds was the transmission of diseases to the native populations, who had developed no natural immunity from European diseases. If there were anecdotal evidence for an outbreak of disease during this time, which mission and what year seems to be the most likely candidate? Again, justify your response by appealing to the graph.
(a)How would you generally describe the trend of baptisms for the two missions over this period? Do the missions appear to show similar trends? Justify your response by appealing to the graph.(b)One of the influences of the meeting of the Old and New Worlds was the transmission of diseases to the native populations, who had developed no natural immunity from European diseases. If there were anecdotal evidence for an outbreak of disease during this time, which mission and what year seems to be the most likely candidate? Again, justify your response by appealing to the graph.
Unlock Deck
Unlock for access to all 64 flashcards in this deck.
Unlock Deck
k this deck
60
Investigators writing in the Journal of Early Adolescence were interested in the communication about sex and related topics between parents and 12-14 year olds. The investigators asked students and parents whether or not they had communicated with their child/parent about topics such as pregnancy, how to say "no," and methods of contraception. A scatter plot of their data is presented below. Each point represents one topic listed by the investigators. For example, 72.4% of parents and 57.6% of adolescents said the parents had discussed childbirth. This would be recorded as the point (57.6, 72.4). (a)On the graph above, sketch the line y = x, representing a line of "perfect agreement" between the parents and adolescents.
(b)What explanation do you have for the placement of the points in the scatter plot relative to the line you sketched in part (a)?
(a)On the graph above, sketch the line y = x, representing a line of "perfect agreement" between the parents and adolescents.(b)What explanation do you have for the placement of the points in the scatter plot relative to the line you sketched in part (a)?
Unlock Deck
Unlock for access to all 64 flashcards in this deck.
Unlock Deck
k this deck
61
Professor wants to identify the relationship between the test scores in her class and the number of hours spent by student preparing to the test. She collected information about preparing time and the test scores in the table below. Choose the most appropriate graphical display for professor to see the relationship between preparing time and the test scores.
A)Bar Chart
B)Comparative Bar Chart
C)Time Series Plot
D)Scatterplot
E)Histogram
Choose the most appropriate graphical display for professor to see the relationship between preparing time and the test scores.A)Bar Chart
B)Comparative Bar Chart
C)Time Series Plot
D)Scatterplot
E)Histogram
Unlock Deck
Unlock for access to all 64 flashcards in this deck.
Unlock Deck
k this deck
62
According to the data from fec.gov, since the year 1980, in Texas candidates from the Republican Party won the presidential elections. Following table represents the results of elections since 1984. Choose the most appropriate graphical display for the results of elections in Texas.
A)Bar Chart
B)Comparative Bar Chart
C)Time Series Plot
D)Stem-and-Leaf Display
E)Histogram
Choose the most appropriate graphical display for the results of elections in Texas.
A)Bar Chart
B)Comparative Bar Chart
C)Time Series Plot
D)Stem-and-Leaf Display
E)Histogram
Unlock Deck
Unlock for access to all 64 flashcards in this deck.
Unlock Deck
k this deck
Unlock Deck
Unlock for access to all 64 flashcards in this deck.


