Deck 17: Understanding Residuals
Full screen (f)
Question
Question
Question
Question
Question
Question
Question
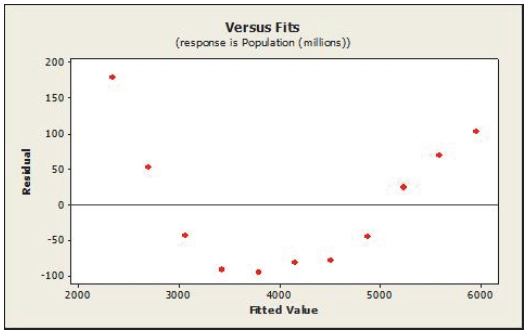
A linear regression model was estimated to describe the trend in world population over time.Below is the plot of residuals versus predicted values.Which of the following re-expression of the data would be appropriate?
A)Square the data values.
B)Cube the data values.
C)Use a logarithmic transformation.
D)Use a geometric transformation.
E)The data should not be transformed.
A)Square the data values.
B)Cube the data values.
C)Use a logarithmic transformation.
D)Use a geometric transformation.
E)The data should not be transformed.
Question
Question
Question
Question
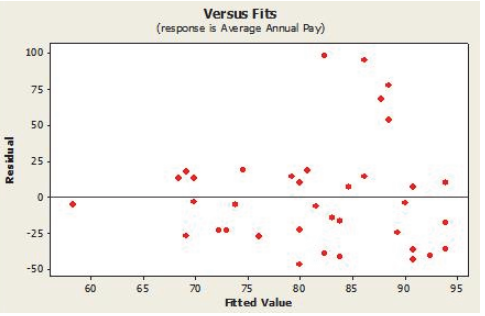
A regression model was developed relating average annual pay to the percentage of women employed for a sample of companies.Below is the plot of residuals versus predicted values.Which of the following re-expression of the data would be appropriate?
A)Square the data values.
B)Cube the data values.
C)Use a logarithmic transformation.
D)Use a geometric transformation.
E)The data should not be transformed.
A)Square the data values.
B)Cube the data values.
C)Use a logarithmic transformation.
D)Use a geometric transformation.
E)The data should not be transformed.
Question
Question
Question
Question
Question
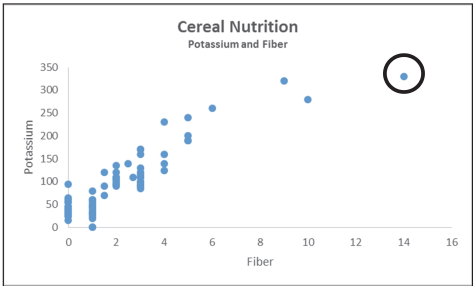
A regression model was developed relating fiber and potassium content for a sample of cereals.The circled observation is ________________________ .
A)an outlier and leverage point
B)an outlier and influential point
C)a leverage and influential point
D)an influential point only
E)an outlier only
A)an outlier and leverage point
B)an outlier and influential point
C)a leverage and influential point
D)an influential point only
E)an outlier only
Question
Question
Question

Unlock Deck
Sign up to unlock the cards in this deck!
Unlock Deck
Unlock Deck
1/19
Play
Full screen (f)
Deck 17: Understanding Residuals
1
A data point with a large, positive residual ________________________ .
A)should always be removed from further analysis
B)is one that should be explored as a possible outlier
C)indicates that the regression model has provided an underestimate for the value
D)B and C
E)All of these.
A)should always be removed from further analysis
B)is one that should be explored as a possible outlier
C)indicates that the regression model has provided an underestimate for the value
D)B and C
E)All of these.
B and C
2
Which of the following plots can be used to indicate that there may be different groups in the data that should be considered separately?
A)Histogram of the residuals.
B)Residuals vs predicted values.
C)A scatterplot showing regression lines for each group.
D)All of these.
E)None of these.
A)Histogram of the residuals.
B)Residuals vs predicted values.
C)A scatterplot showing regression lines for each group.
D)All of these.
E)None of these.
All of these.
3
Transformation (re-expression) is NOT done to make the ________________________ .
A)relationship between x and y look better
B)distribution of a variable more symmetric
C)spread of several groups more alike
D)form of a scatterplot more nearly linear
E)scatter in a scatterplot or residual plot spread out evenly rather than following a fan shape
A)relationship between x and y look better
B)distribution of a variable more symmetric
C)spread of several groups more alike
D)form of a scatterplot more nearly linear
E)scatter in a scatterplot or residual plot spread out evenly rather than following a fan shape
relationship between x and y look better
4
The analysis of unusually large or small residuals can help us to ________________________ .
A)discover groups in our data
B)identify unusual or extreme observations
C)explore other factors in the relationship
D)All of these.
E)None of these.
A)discover groups in our data
B)identify unusual or extreme observations
C)explore other factors in the relationship
D)All of these.
E)None of these.
Unlock Deck
Unlock for access to all 19 flashcards in this deck.
Unlock Deck
k this deck
5
When working with scatterplots of summary values ________________________ .
A)we get a good representation of the variation in the data
B)conclusions will be the same as a random sample of individual data values
C)data appears more variable than data collected on individuals
D)the strength of a relationship can be inflated
E)None of these.
A)we get a good representation of the variation in the data
B)conclusions will be the same as a random sample of individual data values
C)data appears more variable than data collected on individuals
D)the strength of a relationship can be inflated
E)None of these.
Unlock Deck
Unlock for access to all 19 flashcards in this deck.
Unlock Deck
k this deck
6
A regression model was estimated to describe the trend in closing stock prices over 8 months.The Durbin Watson statistic was calculated as 0.5626.Using α = .01 we can conclude that there is evidence of ________________________ .
A)positive autocorrelation
B)negative autocorrelation
C)positive or negative autocorrelation
D)an outlier
E)an inconclusive test
A)positive autocorrelation
B)negative autocorrelation
C)positive or negative autocorrelation
D)an outlier
E)an inconclusive test
Unlock Deck
Unlock for access to all 19 flashcards in this deck.
Unlock Deck
k this deck
7
A linear regression model was estimated to describe the trend in world population over time.Below is the plot of residuals versus predicted values.Which of the following re-expression of the data would be appropriate?
A)Square the data values.
B)Cube the data values.
C)Use a logarithmic transformation.
D)Use a geometric transformation.
E)The data should not be transformed.
A)Square the data values.
B)Cube the data values.
C)Use a logarithmic transformation.
D)Use a geometric transformation.
E)The data should not be transformed.
Unlock Deck
Unlock for access to all 19 flashcards in this deck.
Unlock Deck
k this deck
8
A regression model that showed good fit was developed recently to predict average annual pay for companies based on the percentage of female employees.Companies included in the analysis had between 40% and 80% of employees who were female.This model could safely be used to estimate average annual pay for companies ________________________ .
A)with ¾ of female employees
B)owned and operated in the 18th century
C)with 10% of female employees
D)that will start up in the next 20 years
E)regardless of the number of females or annual pay
A)with ¾ of female employees
B)owned and operated in the 18th century
C)with 10% of female employees
D)that will start up in the next 20 years
E)regardless of the number of females or annual pay
Unlock Deck
Unlock for access to all 19 flashcards in this deck.
Unlock Deck
k this deck
9
Which of the following Ladder of Powers is a good place to start if you are dealing with counted data?
A)The (negative) square root.
B)The (negative) reciprocal square root.
C)Square of the data values.
D)Square root of the data values.
E)Base-10 Log.
A)The (negative) square root.
B)The (negative) reciprocal square root.
C)Square of the data values.
D)Square root of the data values.
E)Base-10 Log.
Unlock Deck
Unlock for access to all 19 flashcards in this deck.
Unlock Deck
k this deck
10
Data on internet usage (per 100 inhabitants) and population were collected for a sample of 52 countries whose populations ranged from 0 to 40 million.Suppose the linear model fit to these data is used to determine Internet usage in India, a country with a population of 1,153,230,948.This would be called ________________________ .
A)an accurate prediction
B)an extrapolation
C)a time series prediction
D)an exaggeration
E)a residual
A)an accurate prediction
B)an extrapolation
C)a time series prediction
D)an exaggeration
E)a residual
Unlock Deck
Unlock for access to all 19 flashcards in this deck.
Unlock Deck
k this deck
11
A regression model was developed relating average annual pay to the percentage of women employed for a sample of companies.Below is the plot of residuals versus predicted values.Which of the following re-expression of the data would be appropriate?
A)Square the data values.
B)Cube the data values.
C)Use a logarithmic transformation.
D)Use a geometric transformation.
E)The data should not be transformed.
A)Square the data values.
B)Cube the data values.
C)Use a logarithmic transformation.
D)Use a geometric transformation.
E)The data should not be transformed.
Unlock Deck
Unlock for access to all 19 flashcards in this deck.
Unlock Deck
k this deck
12
A residual analysis results in the finding that there are many residuals clustered closely around 0, but there is also some predicted values that have very large (>0) residuals and some that have very small (<0) residuals.This may indicate that ________________________ .
A)there are groups that should be analyzed separately
B)a linear model is not appropriate for this data
C)there is a positive autocorrelation.
D)a transformation is necessary.
E)the regression model is providing good estimates.
A)there are groups that should be analyzed separately
B)a linear model is not appropriate for this data
C)there is a positive autocorrelation.
D)a transformation is necessary.
E)the regression model is providing good estimates.
Unlock Deck
Unlock for access to all 19 flashcards in this deck.
Unlock Deck
k this deck
13
A regression model applied to autocorrelated data will have ________________________ .
A)errors that are independent
B)residuals with no pattern over time
C)a Durbin-Watson D that is not close to 2
D)an invalid test for the slope of the regression line
E)no way to reduce the autocorrelation
A)errors that are independent
B)residuals with no pattern over time
C)a Durbin-Watson D that is not close to 2
D)an invalid test for the slope of the regression line
E)no way to reduce the autocorrelation
Unlock Deck
Unlock for access to all 19 flashcards in this deck.
Unlock Deck
k this deck
14
Which of the following statements about the Ladder of Powers is true?
A)Moving further down the Ladder has a weaker effect on the data.
B)If you go too far, you cannot back up the Ladder of Powers
C)Will always change the direction of the relationship
D)Using the Ladder of Powers can improve an analysis of relationships
E)None of these is true.
A)Moving further down the Ladder has a weaker effect on the data.
B)If you go too far, you cannot back up the Ladder of Powers
C)Will always change the direction of the relationship
D)Using the Ladder of Powers can improve an analysis of relationships
E)None of these is true.
Unlock Deck
Unlock for access to all 19 flashcards in this deck.
Unlock Deck
k this deck
15
An outlier is a point with ________________________ .
A)a y-value far from the regression model
B)an x-value far from the mean of the x-values
C)a value that, upon removal, results in a very different model
D)an extremely high y-value
E)an extremely high x-value
A)a y-value far from the regression model
B)an x-value far from the mean of the x-values
C)a value that, upon removal, results in a very different model
D)an extremely high y-value
E)an extremely high x-value
Unlock Deck
Unlock for access to all 19 flashcards in this deck.
Unlock Deck
k this deck
16
A regression model was developed relating fiber and potassium content for a sample of cereals.The circled observation is ________________________ .
A)an outlier and leverage point
B)an outlier and influential point
C)a leverage and influential point
D)an influential point only
E)an outlier only
A)an outlier and leverage point
B)an outlier and influential point
C)a leverage and influential point
D)an influential point only
E)an outlier only
Unlock Deck
Unlock for access to all 19 flashcards in this deck.
Unlock Deck
k this deck
17
A high leverage point ________________________ .
A)can hide in plots of residuals
B)can be informative about the relationship between x and y
C)should probably be omitted
D)can pull the regression line, making the slope appear smaller
E)All of these,
A)can hide in plots of residuals
B)can be informative about the relationship between x and y
C)should probably be omitted
D)can pull the regression line, making the slope appear smaller
E)All of these,
Unlock Deck
Unlock for access to all 19 flashcards in this deck.
Unlock Deck
k this deck
18
Data were collected for a sample of companies regarding their investment in quality improvement efforts and cost savings realized as a result (both measured as a percentage of sales revenue).The R2 for the regression is 0.833.If the data were collected for individual departments within companies rather than at the company level, we would expect ________________________ .
A)a higher R2
B)a lower R2
C)the same R2
D)fewer outliers in the data
E)None of the above.
A)a higher R2
B)a lower R2
C)the same R2
D)fewer outliers in the data
E)None of the above.
Unlock Deck
Unlock for access to all 19 flashcards in this deck.
Unlock Deck
k this deck
19
Quarterly figures for e-commerce retail sales were obtained from the first quarter of 2001 through the fourth quarter of 2007.A regression model was estimated to describe the trend in e-commerce retail sales over time.The Durbin Watson statistic was calculated as 1.727.Using α = .01 we can conclude that there is ________________________ .
A)evidence of positive autocorrelation
B)evidence of negative autocorrelation
C)no evidence of positive or negative autocorrelation
D)evidence of an outlier
E)an inconclusive test
A)evidence of positive autocorrelation
B)evidence of negative autocorrelation
C)no evidence of positive or negative autocorrelation
D)evidence of an outlier
E)an inconclusive test
Unlock Deck
Unlock for access to all 19 flashcards in this deck.
Unlock Deck
k this deck
Unlock Deck
Unlock for access to all 19 flashcards in this deck.


