Exam 17: Understanding Residuals
Exam 1: Data and Decisions29 Questions
Exam 2: Visualizing and Describing Categorical Data30 Questions
Exam 3: Describing, Displaying, and Visualizing Quantitative Data16 Questions
Exam 4: Correlation and Linear Regression21 Questions
Exam 5: Randomness and Probability22 Questions
Exam 6: Random Variables and Probability Models20 Questions
Exam 7: The Normal and Other Continuous Distributions20 Questions
Exam 8: Data Sources: Observational Studies and Surveys23 Questions
Exam 9: Data Sources: Experiments12 Questions
Exam 10: Sampling Distributions and Confidence Intervals for Proportio18 Questions
Exam 11: Confidence Intervals for Means20 Questions
Exam 12: Testing Hypotheses21 Questions
Exam 13: More About Tests and Intervals16 Questions
Exam 14: Comparing Two Means13 Questions
Exam 15: Inference for Counts: Chi-Square Tests17 Questions
Exam 16: Inference for Regression19 Questions
Exam 17: Understanding Residuals19 Questions
Exam 18: Multiple Regression18 Questions
Exam 19: Building Multiple Regression Models16 Questions
Exam 20: Time Series Analysis18 Questions
Exam 21: Introduction to Data Mining11 Questions
Exam 22: Quality Control20 Questions
Exam 23: Nonparametric Methods13 Questions
Exam 24: Decision Making and Risk19 Questions
Exam 25: Analysis of Experiments and Observational Studies9 Questions
Exam 26: Statistics and Data Analysis207 Questions
Select questions type
A regression model applied to autocorrelated data will have ________________________ .
Free
(Multiple Choice)
4.9/5  (37)
(37)
Correct Answer: Verified
C
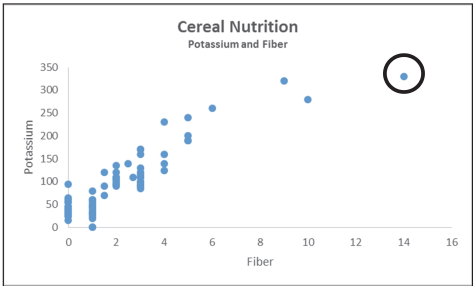
A regression model was developed relating fiber and potassium content for a sample of cereals.The circled observation is ________________________ .
Free
(Multiple Choice)
4.8/5 (30)
Correct Answer:Verified
A
The analysis of unusually large or small residuals can help us to ________________________ .
Free
(Multiple Choice)
4.8/5 (34)
Correct Answer:Verified
D
A residual analysis results in the finding that there are many residuals clustered closely around 0, but there is also some predicted values that have very large (>0) residuals and some that have very small (<0) residuals.This may indicate that ________________________ .
(Multiple Choice)
4.8/5 (35)
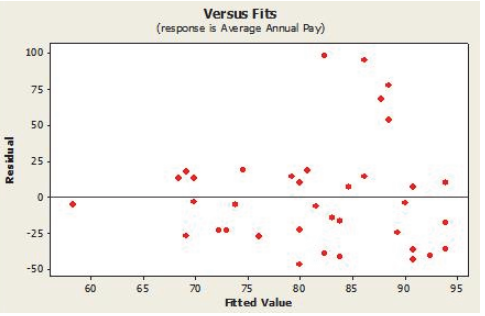
A regression model was developed relating average annual pay to the percentage of women employed for a sample of companies.Below is the plot of residuals versus predicted values.Which of the following re-expression of the data would be appropriate?
(Multiple Choice)
4.8/5 (38)
A regression model was estimated to describe the trend in closing stock prices over 8 months.The Durbin Watson statistic was calculated as 0.5626.Using α = .01 we can conclude that there is evidence of ________________________ .
(Multiple Choice)
4.8/5 (43)
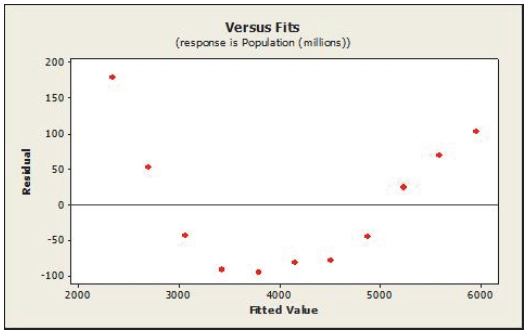
A linear regression model was estimated to describe the trend in world population over time.Below is the plot of residuals versus predicted values.Which of the following re-expression of the data would be appropriate?
(Multiple Choice)
5.0/5 (31)
Which of the following statements about the Ladder of Powers is true?
(Multiple Choice)
4.9/5 (40)
A data point with a large, positive residual ________________________ .
(Multiple Choice)
4.8/5 (32)
Transformation (re-expression) is NOT done to make the ________________________ .
(Multiple Choice)
4.8/5 (31)
When working with scatterplots of summary values ________________________ .
(Multiple Choice)
4.8/5 (33)
Data on internet usage (per 100 inhabitants) and population were collected for a sample of 52 countries whose populations ranged from 0 to 40 million.Suppose the linear model fit to these data is used to determine Internet usage in India, a country with a population of 1,153,230,948.This would be called ________________________ .
(Multiple Choice)
4.8/5 (37)
Which of the following plots can be used to indicate that there may be different groups in the data that should be considered separately?
(Multiple Choice)
4.9/5 (31)
Data were collected for a sample of companies regarding their investment in quality improvement efforts and cost savings realized as a result (both measured as a percentage of sales revenue).The R2 for the regression is 0.833.If the data were collected for individual departments within companies rather than at the company level, we would expect ________________________ .
(Multiple Choice)
5.0/5 (36)
Quarterly figures for e-commerce retail sales were obtained from the first quarter of 2001 through the fourth quarter of 2007.A regression model was estimated to describe the trend in e-commerce retail sales over time.The Durbin Watson statistic was calculated as 1.727.Using α = .01 we can conclude that there is ________________________ .
(Multiple Choice)
4.7/5 (40)
Which of the following Ladder of Powers is a good place to start if you are dealing with counted data?
(Multiple Choice)
4.9/5 (34)
A regression model that showed good fit was developed recently to predict average annual pay for companies based on the percentage of female employees.Companies included in the analysis had between 40% and 80% of employees who were female.This model could safely be used to estimate average annual pay for companies ________________________ .
(Multiple Choice)
5.0/5 (35)
Filters
- Essay(0)
- Multiple Choice(0)
- Short Answer(0)
- True False(0)
- Matching(0)