Deck 16: Time Series and Forecasting
Full screen (f)
Question
Question
Question
Question
Question
Question
Question
Question
Question
Question
Question
Question
Question
Question
Question
Question
Question
Question
Question
Question
Question
i. In the linear trend equation, t is any value that corresponds with a time period, i.e., month or quarter.
ii. A straight-line trend equation is used to represent the time series when it is believed that the data is increasing (or decreasing) by equal amounts, on the average, from one period to another.
Iii) If the past data approximates a straight line, the equation used is = a + bt, where a is the y- intercept and b is the slope of the line.
A) (i), (ii) and (iii) are all correct statements
B) (i) and (ii) are correct statements, but not (iii).
C) (i) and (iii) are correct statements but not (ii).
D) (ii) and (iii) are correct statements but not (i).
E) All statements are false
ii. A straight-line trend equation is used to represent the time series when it is believed that the data is increasing (or decreasing) by equal amounts, on the average, from one period to another.
Iii) If the past data approximates a straight line, the equation used is
= a + bt, where a is the y- intercept and b is the slope of the line.A) (i), (ii) and (iii) are all correct statements
B) (i) and (ii) are correct statements, but not (iii).
C) (i) and (iii) are correct statements but not (ii).
D) (ii) and (iii) are correct statements but not (i).
E) All statements are false
Question
Question
Question
i. In a time series analysis, the letter "a" in the linear trend equation, is the value of  when t = 0.
ii. In the linear trend equation, t is any value that corresponds with a time period, i.e., month or quarter.
Iii) If the sales, production or other data over a period of time tend to approximate a straight-line
Trend, the equation developed by the least squares method cannot be used to forecast sales for a future period.
A) (i), (ii) and (iii) are all correct statements
B) (i) and (ii) are correct statements, but not (iii).
C) (i) and (iii) are correct statements but not (ii).
D) (ii) and (iii) are correct statements but not (i).
E) All statements are false
when t = 0. ii. In the linear trend equation, t is any value that corresponds with a time period, i.e., month or quarter.
Iii) If the sales, production or other data over a period of time tend to approximate a straight-line
Trend, the equation developed by the least squares method cannot be used to forecast sales for a future period.
A) (i), (ii) and (iii) are all correct statements
B) (i) and (ii) are correct statements, but not (iii).
C) (i) and (iii) are correct statements but not (ii).
D) (ii) and (iii) are correct statements but not (i).
E) All statements are false
Question

What is the forecast for year 9?
A) 20.725
B) 20.025
C) 17.100
D) 28.122
E) 19.325
Question
Question
Question
i. In a time series analysis, the letter "a" in the linear trend equation, is the value of  when t = 0.t2 ii. In the linear trend equation, the letter "b" is the average change in t for each change of one unit (either increase or decrease) in y.
iii. In the linear trend equation, t is any value that corresponds with a time period, (i.e. month or quarter.
A) (i), (ii) and (iii) are all correct statements
B) (i) and (ii) are correct statements, but not (iii).
C) (i) and (iii) are correct statements but not (ii).
D) (ii) and (iii) are correct statements but not (i).
E) All statements are false
when t = 0.t2 ii. In the linear trend equation, the letter "b" is the average change in t for each change of one unit (either increase or decrease) in y. iii. In the linear trend equation, t is any value that corresponds with a time period, (i.e. month or quarter.
A) (i), (ii) and (iii) are all correct statements
B) (i) and (ii) are correct statements, but not (iii).
C) (i) and (iii) are correct statements but not (ii).
D) (ii) and (iii) are correct statements but not (i).
E) All statements are false
Question
Question
Question
Question
Question
Question
Question
Question
Question
Question
Question
Question
i. If the sales, production or other data over a period of time tend to approximate a straight-line trend, the equation developed by the least squares method cannot be used to forecast sales for a future period.
Ii) A straight-line trend equation is used to represent the time series when it is believed that the data is increasing (or decreasing) by equal amounts, on the average, from one period to another.
Iii) If the past data approximates a straight line, the equation used is = a + bt, where a is the y- intercept and b is the slope of the line.
A) (i), (ii) and (iii) are all correct statements
B) (i) and (ii) are correct statements, but not (iii).
C) (i) and (iii) are correct statements but not (ii).
D) (ii) and (iii) are correct statements but not (i).
E) All statements are false
Ii) A straight-line trend equation is used to represent the time series when it is believed that the data is increasing (or decreasing) by equal amounts, on the average, from one period to another.
Iii) If the past data approximates a straight line, the equation used is
= a + bt, where a is the y- intercept and b is the slope of the line.A) (i), (ii) and (iii) are all correct statements
B) (i) and (ii) are correct statements, but not (iii).
C) (i) and (iii) are correct statements but not (ii).
D) (ii) and (iii) are correct statements but not (i).
E) All statements are false
Question
Question
Listed below is the net sales in $ million for Home Depot Inc., and its subsidiaries from 1994 to 2003. 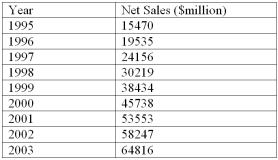 Using the printout below, what are the estimated sales for 2005?
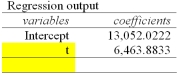
A) $90,618.6 Million
B) $77,690.9 Million
C) $84,154.7 Million
D) $103,546.4 Million
E) $71,227.0 Million
Using the printout below, what are the estimated sales for 2005? A) $90,618.6 Million
B) $77,690.9 Million
C) $84,154.7 Million
D) $103,546.4 Million
E) $71,227.0 Million
Question
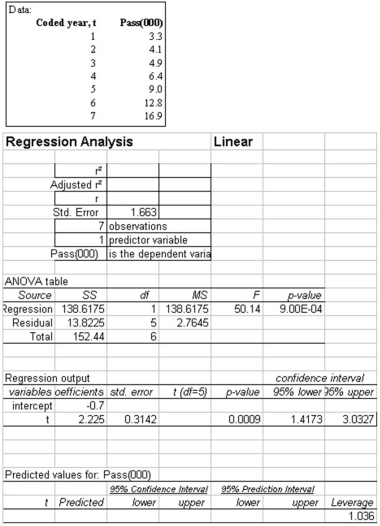
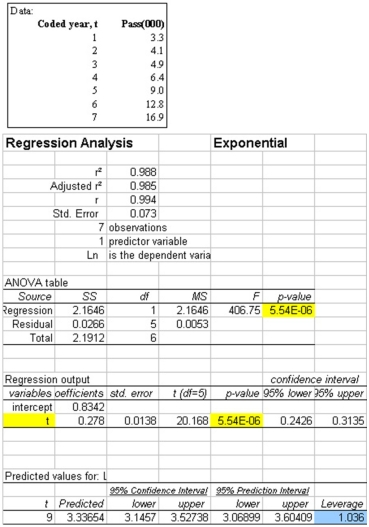
If the data appears to be increasing exponentially and we wish to forecast number of passengers for year 9, we can use Log10 and linear regression equation. What is the linear equation for Log10 of this data?
A)

B)

C)

D)

E)

Question

What is Log10 of the forecast for year 9?
A) 1.449
B) 28.122
C) 3.337
D) 19.325
E) 1.087
Question
Listed below is the net sales in $ million for Home Depot Inc., and its subsidiaries from 1994 to 2003.  Using the printout below, what are the estimated sales for 2006?
A) $90,618.6 Million
B) $477,690.9 Million
C) $84,154.7 Million
D) $103,546.4 Million
E) $71,227.0 Million
Using the printout below, what are the estimated sales for 2006? A) $90,618.6 Million
B) $477,690.9 Million
C) $84,154.7 Million
D) $103,546.4 Million
E) $71,227.0 Million
Question
Question
Question
Question
Which of the following is true for the exponential equation?
A) Ln a = S Ln ŷ/ n
B) Ln ŷ = Ln a + tLn b
C) Ln b = S(X Ln )/ t2
)/ t2
D) Ln ŷ = Ln a + bLn t
E) ŷ = a + bt
A) Ln a = S Ln ŷ/ n
B) Ln ŷ = Ln a + tLn b
C) Ln b = S(X Ln
)/ t2D) Ln ŷ = Ln a + bLn t
E) ŷ = a + bt
Question
Listed below is the net sales in $ million for Home Depot Inc., and its subsidiaries from 1994 to 2003. 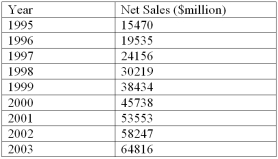
Using the printout below, what are the estimated sales for 2004?
A) $90,618.6 Million
B) $77,690.9 Million
C) $84,154.7 Million
D) $103,546.4 Million
E) $71,227.0 Million
Using the printout below, what are the estimated sales for 2004?
A) $90,618.6 Million
B) $77,690.9 Million
C) $84,154.7 Million
D) $103,546.4 Million
E) $71,227.0 Million
Question
Listed below is the net sales in $ million for Home Depot Inc., and its subsidiaries from 1994 to 2003. 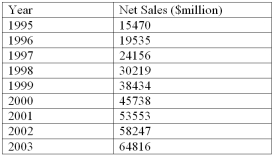 Using the printout below, what are the estimated sales for 2010?
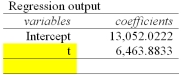
A) $90,618.6 Million
B) $97,082.5 Million
C) $116,464.2 Million
D) $103,546.4 Million
E) $110,010.3 Million
Using the printout below, what are the estimated sales for 2010? A) $90,618.6 Million
B) $97,082.5 Million
C) $116,464.2 Million
D) $103,546.4 Million
E) $110,010.3 Million
Question
Question
Listed below is the net sales in $ million for Home Depot Inc., and its subsidiaries from 1994 to 2003. 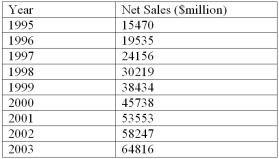 Using the printout below, what are the estimated sales for 2011?
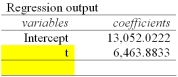
A) $90,618.6 Million
B) $97,082.5 Million
C) $116,464.2 Million
D) $103,546.4 Million
E) $110,010.3 Million
Using the printout below, what are the estimated sales for 2011? A) $90,618.6 Million
B) $97,082.5 Million
C) $116,464.2 Million
D) $103,546.4 Million
E) $110,010.3 Million
Question
 What is Ln of the forecast for year 9?
A) 1.449
B) 28.122
C) 3.337
D) 19.325
E) 1.087
Question
Listed below is the net sales in $ million for Home Depot Inc., and its subsidiaries from 1994 to 2003. 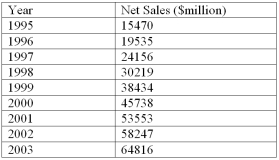 Using the printout below, what are the estimated sales for 2008?
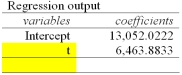
A) $90,618.6 Million
B) $97,082.5 Million
C) $84,154.7 Million
D) $103,546.4 Million
E) $71,227.0 Million
Using the printout below, what are the estimated sales for 2008? A) $90,618.6 Million
B) $97,082.5 Million
C) $84,154.7 Million
D) $103,546.4 Million
E) $71,227.0 Million
Question
A plastics manufacturing performed a quarterly time series analysis for demands over the last five years (periods 1 through 20). The analysis resulted in the following trend equation and seasonal indexes:  = 920.0 + 22.6 t
 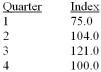 Based on the seasonal indexes, which quarter is expect to have 25% less demand than predicted by the trend line?
A) 1
B) 2
C) 3
D) 4
E) 1 and 3
= 920.0 + 22.6 t Based on the seasonal indexes, which quarter is expect to have 25% less demand than predicted by the trend line?A) 1
B) 2
C) 3
D) 4
E) 1 and 3
Question
Listed below is the net sales in $ million for Home Depot Inc., and its subsidiaries from 1994 to 2003. 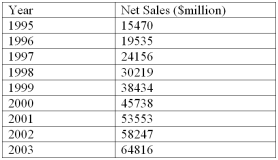 Using the printout below, what are the estimated sales for 2007?
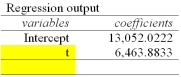
A) $90,618.6 Million
B) $477,690.9 Million
C) $84,154.7 Million
D) $103,546.4 Million
E) $71,227.0 Million
Using the printout below, what are the estimated sales for 2007? A) $90,618.6 Million
B) $477,690.9 Million
C) $84,154.7 Million
D) $103,546.4 Million
E) $71,227.0 Million
Question
Listed below is the net sales in $ million for Home Depot Inc., and its subsidiaries from 1994 to 2003. 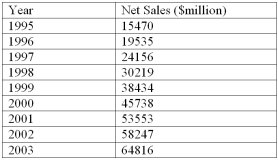 Using the printout below, what are the estimated sales for 2009?
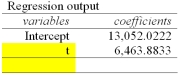
A) $90,618.6 Million
B) $97,082.5 Million
C) $84,154.7 Million
D) $103,546.4 Million
E) $71,227.0 Million
Using the printout below, what are the estimated sales for 2009? A) $90,618.6 Million
B) $97,082.5 Million
C) $84,154.7 Million
D) $103,546.4 Million
E) $71,227.0 Million
Question
A plastics manufacturing performed a quarterly time series analysis for demands over the last five years (periods 1 through 20). The analysis resulted in the following trend equation and seasonal indexes:  = 920.0 + 22.6 t
  Based on the seasonal indexes, which quarter is expect to have 21% more demand than predicted by the trend line?
A) 1
B) 2
C) 3
D) 4
E) 1 and 3
= 920.0 + 22.6 t Based on the seasonal indexes, which quarter is expect to have 21% more demand than predicted by the trend line?A) 1
B) 2
C) 3
D) 4
E) 1 and 3
Question
 What is the forecast for year 9?
A) 20.725
B) 20.025
C) 17.100
D) 28.122
E) 19.325
Question
Question
Question
Question
Question
Question
Question
Question
Question
A plastics manufacturing performed a quarterly time series analysis for demands over the last five years (periods 1 through 20). The analysis resulted in the following trend equation and seasonal indexes:  = 920.0 + 22.6 t
 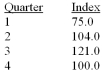 Using the trend line question and the seasonal indexes, predict demand for the third period of the next year, i.e., period 23.
A) 1439.8
B) 519.8
C) 629.0
D) 1195.2
E) 1742.2
= 920.0 + 22.6 t Using the trend line question and the seasonal indexes, predict demand for the third period of the next year, i.e., period 23.A) 1439.8
B) 519.8
C) 629.0
D) 1195.2
E) 1742.2
Question
Question
Question
Question
The table below shows the sales for a plastics manufacturer recorded over the past year. The seasonal indexes for each quarter are also provided). To track the trend for these four quarters, use the indexes to deseasonalize the sales data) 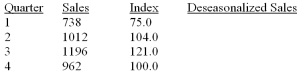 What are deseasonalized sales for quarter 1?
A) 553.5
B) 984.0
C) 1291.5
D) 184.5
E) 922.5
What are deseasonalized sales for quarter 1?A) 553.5
B) 984.0
C) 1291.5
D) 184.5
E) 922.5
Question
Question
Teton Village contains shops, restaurants and motels. They have two peak seasons, - winter for skiing, and summer, for tourists visiting nearby parks. The specific seasonal with respect to the total sales volume for recent years are: 
Using the seasonal indexes below, explain the typical index for the spring season.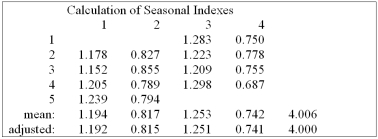
A) Total sales for the spring season are typically 18.3% below the annual average.
B) Total sales for the spring season are typically 18.3% above the annual average.
C) Total sales for the spring season are typically 81.7% below the annual average.
D) Total sales for the spring season are typically 81.5% below the annual average.
Question
Question
The table below shows the sales for a plastics manufacturer recorded over the past year. The seasonal indexes for each quarter are also provided). To track the trend for these four quarters, use the indexes to deseasonalize the sales data) 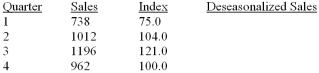 Overall, based on these four quarters, sales:
A) are definitely increasing.
B) are definitely decreasing.
C) are constant.
D) are exponentially decreasing.
E) cannot be determined
Overall, based on these four quarters, sales:A) are definitely increasing.
B) are definitely decreasing.
C) are constant.
D) are exponentially decreasing.
E) cannot be determined
Question
Question
Teton Village contains shops, restaurants and motels. They have two peak seasons, - winter for skiing, and summer, for tourists visiting nearby parks. The specific seasonal with respect to the total sales volume for recent years are: 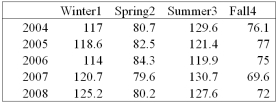 Using the seasonal indexes below, explain the typical index for the fall season.
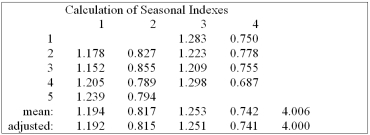
A) Total sales for the fall season are typically 25.8% below the annual average.
B) Total sales for the fall season are typically 74.2% below the annual average
C) Total sales for the fall season are typically 74.2% above the annual average.
D) Total sales for the fall season are typically 31.2% below the annual average.
Using the seasonal indexes below, explain the typical index for the fall season. A) Total sales for the fall season are typically 25.8% below the annual average.
B) Total sales for the fall season are typically 74.2% below the annual average
C) Total sales for the fall season are typically 74.2% above the annual average.
D) Total sales for the fall season are typically 31.2% below the annual average.
Question
The table below shows the sales for a plastics manufacturer recorded over the past year. The seasonal indexes for each quarter are also provided). To track the trend for these four quarters, use the indexes to deseasonalize the sales data) 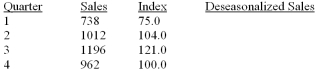 What are deseasonalized sales for quarter 2?
A) 973.1
B) 1052.5
C) 1291.5
D) 1012.0
E) 1027.7
What are deseasonalized sales for quarter 2?A) 973.1
B) 1052.5
C) 1291.5
D) 1012.0
E) 1027.7

Unlock Deck
Sign up to unlock the cards in this deck!
Unlock Deck
Unlock Deck
1/86
Play
Full screen (f)
Deck 16: Time Series and Forecasting
1
What is the long-term behavior of a variable over an extended period of time called?
A) Secular trend
B) Seasonal variation
C) Cyclical variation
D) Irregular or variation
E) Episodic variation
A) Secular trend
B) Seasonal variation
C) Cyclical variation
D) Irregular or variation
E) Episodic variation
A
2
i. A time series is a collection of data recorded over a period of time, usually monthly, quarterly, or yearly.
Ii) Episodic and residual variations can be projected into the future.
Iii) A forecast is considered necessary in order to have the raw materials, production facilities, and staff available to meet estimated future demands.
A) (i), (ii) and (iii) are all correct statements
B) (i) and (ii) are correct statements, but not (iii).
C) (i) and (iii) are correct statements but not (ii).
D) (ii) and (iii) are correct statements but not (i).
E) All statements are false
C
3
Why are long range predictions considered essential to managing a firm?
A) To develop plans for possible new plants.
B) To have raw materials available for future demand
C) To develop plans for future financing.
D) To have enough staff for future needs.
E) All of the choices are correct
A) To develop plans for possible new plants.
B) To have raw materials available for future demand
C) To develop plans for future financing.
D) To have enough staff for future needs.
E) All of the choices are correct
E
4
i. Long-term forecasts are usually from one year to more than 10 years into the future.
ii. A forecast is considered necessary in order to have the raw materials, production facilities, and staff available to meet estimated future demands.
Iii) One component of a time series is the secular trend that is the smooth movement of a series over a short period of time, such as a few months or quarters.
A) (i), (ii) and (iii) are all correct statements
B) (i) and (ii) are correct statements, but not (iii).
C) (i) and (iii) are correct statements but not (ii).
D) (ii) and (iii) are correct statements but not (i).
E) All statements are false
Unlock Deck
Unlock for access to all 86 flashcards in this deck.
Unlock Deck
k this deck
5
How can you describe the moving average method?
A) Useful in smoothing out a time series.
B) Used in measuring seasonal fluctuations.
C) A technique which does not result in a trend line equation.
D) A method for identifying a trend.
E) All of the choices are correct
A) Useful in smoothing out a time series.
B) Used in measuring seasonal fluctuations.
C) A technique which does not result in a trend line equation.
D) A method for identifying a trend.
E) All of the choices are correct
Unlock Deck
Unlock for access to all 86 flashcards in this deck.
Unlock Deck
k this deck
6
What time series component was exemplified during the 1980's when the World economy enjoyed a period of prosperity?
A) Irregular
B) Cyclical
C) Trend
D) Seasonal
E) Episodic
A) Irregular
B) Cyclical
C) Trend
D) Seasonal
E) Episodic
Unlock Deck
Unlock for access to all 86 flashcards in this deck.
Unlock Deck
k this deck
7
What is the correct order of events in a typical business cycle?
A) Prosperity, recession, depression and recovery
B) Depression, recovery, recession and prosperity
C) Recovery, depression, prosperity and recession
D) Recession, recovery, prosperity and depression
E) Recession, depression, regression
A) Prosperity, recession, depression and recovery
B) Depression, recovery, recession and prosperity
C) Recovery, depression, prosperity and recession
D) Recession, recovery, prosperity and depression
E) Recession, depression, regression
Unlock Deck
Unlock for access to all 86 flashcards in this deck.
Unlock Deck
k this deck
8
i. One component of a time series is the secular trend that is the smooth movement of a series over a short period of time, such as a few months or quarters.
ii. Many business and economic time series have a recurring seasonal pattern.
Iii) One component of a time series is cyclical variation. An example of cyclical variation is the business cycle that consists of periods of prosperity followed by periods of recession, depression, and recovery.
A) (i), (ii) and (iii) are all correct statements
B) (i) and (ii) are correct statements, but not (iii).
C) (i) and (iii) are correct statements but not (ii).
D) (ii) and (iii) are correct statements but not (i).
E) All statements are false
Unlock Deck
Unlock for access to all 86 flashcards in this deck.
Unlock Deck
k this deck
9
i. Long-term forecasts are usually from one year to more than 10 years into the future.
ii. A forecast is considered necessary in order to have the raw materials, production facilities, and staff available to meet estimated future demands.
Iii) Many business and economic time series have a recurring seasonal pattern.
A) (i), (ii) and (iii) are all correct statements
B) (i) and (ii) are correct statements, but not (iii).
C) (i) and (iii) are correct statements but not (ii).
D) (ii) and (iii) are correct statements but not (i).
E) All statements are false
Unlock Deck
Unlock for access to all 86 flashcards in this deck.
Unlock Deck
k this deck
10
A time series is a collection of data that:
A) records past performance
B) records future performance
C) has seasonality removed
D) has irregular variation removed
E) is limited to yearly data
A) records past performance
B) records future performance
C) has seasonality removed
D) has irregular variation removed
E) is limited to yearly data
Unlock Deck
Unlock for access to all 86 flashcards in this deck.
Unlock Deck
k this deck
11
i. A forecast is considered necessary in order to have the raw materials, production facilities, and staff available to meet estimated future demands.
Ii) One component of a time series is the secular trend that is the smooth movement of a series over a short period of time, such as a few months or quarters.
Iii) Many business and economic time series have a recurring seasonal pattern.
A) (i), (ii) and (iii) are all correct statements
B) (i) and (ii) are correct statements, but not (iii).
C) (i) and (iii) are correct statements but not (ii).
D) (ii) and (iii) are correct statements but not (i).
E) All statements are false
Unlock Deck
Unlock for access to all 86 flashcards in this deck.
Unlock Deck
k this deck
12
For an annual time series extending from 1993 through 2001, how many years would be lost in a five- year moving average?
A) 2 at the start and 1 at the end
B) 1 at the start and 1 at the end
C) 2 at the start and 0 at the end
D) 0 at the start and 2 at the end
E) 2 at the start and 2 at the end
A) 2 at the start and 1 at the end
B) 1 at the start and 1 at the end
C) 2 at the start and 0 at the end
D) 0 at the start and 2 at the end
E) 2 at the start and 2 at the end
Unlock Deck
Unlock for access to all 86 flashcards in this deck.
Unlock Deck
k this deck
13
The merchants in Morris, Manitoba suffered flood damage in May 1997. Stores were closed for remodeling nearly two months. What is this type of variation in sales called?
A) Secular trend
B) Seasonal variation
C) Cyclical variation
D) Episodic variation
E) Irregular variation
A) Secular trend
B) Seasonal variation
C) Cyclical variation
D) Episodic variation
E) Irregular variation
Unlock Deck
Unlock for access to all 86 flashcards in this deck.
Unlock Deck
k this deck
14
The events on Sept 11, 2001 exerted an impact on the economy that could be classified as:
A) Secular trend
B) Episodic variation
C) Residual variation
D) Seasonal variation
E) Cyclical variation
A) Secular trend
B) Episodic variation
C) Residual variation
D) Seasonal variation
E) Cyclical variation
Unlock Deck
Unlock for access to all 86 flashcards in this deck.
Unlock Deck
k this deck
15
Which one of the following is not a component of a time series?
A) Secular trend
B) Moving average
C) Seasonal variation
D) Irregular variation
E) Cyclical variation
A) Secular trend
B) Moving average
C) Seasonal variation
D) Irregular variation
E) Cyclical variation
Unlock Deck
Unlock for access to all 86 flashcards in this deck.
Unlock Deck
k this deck
16
What is variation within a year, such as high sales at Christmas and Easter and low sales in January, called?
A) Secular trend
B) Seasonal variation
C) Cyclical variation
D) Episodic variation
E) Irregular variation
A) Secular trend
B) Seasonal variation
C) Cyclical variation
D) Episodic variation
E) Irregular variation
Unlock Deck
Unlock for access to all 86 flashcards in this deck.
Unlock Deck
k this deck
17
Economic periods of prosperity followed by recession are described as:
A) Secular trend
B) Seasonal variation
C) Cyclical variation
D) Episodic variation
E) Irregular variation
A) Secular trend
B) Seasonal variation
C) Cyclical variation
D) Episodic variation
E) Irregular variation
Unlock Deck
Unlock for access to all 86 flashcards in this deck.
Unlock Deck
k this deck
18
If the exports ($ millions) for the period 1997 through 2001 were $878, $892, $864, $870 and $912 respectively, what are these values called?
A) Moving average
B) Linear trend equation
C) Logarithmic trend equation
D) Time series
E) Secular Trend
A) Moving average
B) Linear trend equation
C) Logarithmic trend equation
D) Time series
E) Secular Trend
Unlock Deck
Unlock for access to all 86 flashcards in this deck.
Unlock Deck
k this deck
19
Since a ski resort does most of its business in the winter, what is the major source of variation in income due to?
A) Secular trend
B) Seasonal variation
C) Cyclical variation
D) Episodic variation
E) Irregular variation
A) Secular trend
B) Seasonal variation
C) Cyclical variation
D) Episodic variation
E) Irregular variation
Unlock Deck
Unlock for access to all 86 flashcards in this deck.
Unlock Deck
k this deck
20
i. A time series is a collection of data recorded over a period of time, usually monthly, quarterly, or yearly.
Ii) Long-term forecasts are usually from one year to more than 10 years into the future.
Iii) A forecast is considered necessary in order to have the raw materials, production facilities, and staff available to meet estimated future demands.
A) (i), (ii) and (iii) are all correct statements
B) (i) and (ii) are correct statements, but not (iii).
C) (i) and (iii) are correct statements but not (ii).
D) (ii) and (iii) are correct statements but not (i).
E) All statements are false
Unlock Deck
Unlock for access to all 86 flashcards in this deck.
Unlock Deck
k this deck
21
i. In the linear trend equation, t is any value that corresponds with a time period, i.e., month or quarter.
ii. A straight-line trend equation is used to represent the time series when it is believed that the data is increasing (or decreasing) by equal amounts, on the average, from one period to another.
Iii) If the past data approximates a straight line, the equation used is = a + bt, where a is the y- intercept and b is the slope of the line.
A) (i), (ii) and (iii) are all correct statements
B) (i) and (ii) are correct statements, but not (iii).
C) (i) and (iii) are correct statements but not (ii).
D) (ii) and (iii) are correct statements but not (i).
E) All statements are false
ii. A straight-line trend equation is used to represent the time series when it is believed that the data is increasing (or decreasing) by equal amounts, on the average, from one period to another.
Iii) If the past data approximates a straight line, the equation used is
= a + bt, where a is the y- intercept and b is the slope of the line.A) (i), (ii) and (iii) are all correct statements
B) (i) and (ii) are correct statements, but not (iii).
C) (i) and (iii) are correct statements but not (ii).
D) (ii) and (iii) are correct statements but not (i).
E) All statements are false
Unlock Deck
Unlock for access to all 86 flashcards in this deck.
Unlock Deck
k this deck
22
For a three-year moving average, how many values will be lost at the beginning and end of the time series?
A) 0 at the start and 2 at the end
B) 3 at the start and 0 at the end
C) 1 at the start and 1 at the end
D) 0 at the start and 3 at the end
E) 2 at the start and 0 at the end
A) 0 at the start and 2 at the end
B) 3 at the start and 0 at the end
C) 1 at the start and 1 at the end
D) 0 at the start and 3 at the end
E) 2 at the start and 0 at the end
Unlock Deck
Unlock for access to all 86 flashcards in this deck.
Unlock Deck
k this deck
23
In the linear trend equation, how is the average change in the dependent variable represented for every unit change in time?
A) a
B) b
C) t
D) ŷ
E) r
A) a
B) b
C) t
D) ŷ
E) r
Unlock Deck
Unlock for access to all 86 flashcards in this deck.
Unlock Deck
k this deck
24
i. In a time series analysis, the letter "a" in the linear trend equation, is the value of when t = 0.
ii. In the linear trend equation, t is any value that corresponds with a time period, i.e., month or quarter.
Iii) If the sales, production or other data over a period of time tend to approximate a straight-line
Trend, the equation developed by the least squares method cannot be used to forecast sales for a future period.
A) (i), (ii) and (iii) are all correct statements
B) (i) and (ii) are correct statements, but not (iii).
C) (i) and (iii) are correct statements but not (ii).
D) (ii) and (iii) are correct statements but not (i).
E) All statements are false
when t = 0. ii. In the linear trend equation, t is any value that corresponds with a time period, i.e., month or quarter.
Iii) If the sales, production or other data over a period of time tend to approximate a straight-line
Trend, the equation developed by the least squares method cannot be used to forecast sales for a future period.
A) (i), (ii) and (iii) are all correct statements
B) (i) and (ii) are correct statements, but not (iii).
C) (i) and (iii) are correct statements but not (ii).
D) (ii) and (iii) are correct statements but not (i).
E) All statements are false
Unlock Deck
Unlock for access to all 86 flashcards in this deck.
Unlock Deck
k this deck
25
What is the forecast for year 9?
A) 20.725
B) 20.025
C) 17.100
D) 28.122
E) 19.325
Unlock Deck
Unlock for access to all 86 flashcards in this deck.
Unlock Deck
k this deck
26
For a time series beginning with 1988 and extending up to 2001, which year would be coded with a one when using the coded method?
A) 1986
B) 1988
C) 1989
D) 1998
E) 1996
A) 1986
B) 1988
C) 1989
D) 1998
E) 1996
Unlock Deck
Unlock for access to all 86 flashcards in this deck.
Unlock Deck
k this deck
27
The following linear trend equation was developed for the annual sales of the Jordan Manufacturing Company. ŷ = 500 + 60t ($000). How much are sales increasing?
A) $60,000 per year
B) $6,000 per month
C) $500,000 per year
D) $6,000 per year
E) $500 per month
A) $60,000 per year
B) $6,000 per month
C) $500,000 per year
D) $6,000 per year
E) $500 per month
Unlock Deck
Unlock for access to all 86 flashcards in this deck.
Unlock Deck
k this deck
28
i. In a time series analysis, the letter "a" in the linear trend equation, is the value of when t = 0.t2 ii. In the linear trend equation, the letter "b" is the average change in t for each change of one unit (either increase or decrease) in y.
iii. In the linear trend equation, t is any value that corresponds with a time period, (i.e. month or quarter.
A) (i), (ii) and (iii) are all correct statements
B) (i) and (ii) are correct statements, but not (iii).
C) (i) and (iii) are correct statements but not (ii).
D) (ii) and (iii) are correct statements but not (i).
E) All statements are false
when t = 0.t2 ii. In the linear trend equation, the letter "b" is the average change in t for each change of one unit (either increase or decrease) in y. iii. In the linear trend equation, t is any value that corresponds with a time period, (i.e. month or quarter.
A) (i), (ii) and (iii) are all correct statements
B) (i) and (ii) are correct statements, but not (iii).
C) (i) and (iii) are correct statements but not (ii).
D) (ii) and (iii) are correct statements but not (i).
E) All statements are false
Unlock Deck
Unlock for access to all 86 flashcards in this deck.
Unlock Deck
k this deck
29
i. In the linear trend equation, t is any value that corresponds with a time period, i.e., month or quarter.
ii. The least squares method of computing the equation for a straight line going through the data of interest gives the "best fitting" line.
Iii) If the sales, production or other data over a period of time tend to approximate a straight-line
Trend, the equation developed by the least squares method cannot be used to forecast sales for a future period.
A) (i), (ii) and (iii) are all correct statements
B) (i) and (ii) are correct statements, but not (iii).
C) (i) and (iii) are correct statements but not (ii).
D) (ii) and (iii) are correct statements but not (i).
E) All statements are false
Unlock Deck
Unlock for access to all 86 flashcards in this deck.
Unlock Deck
k this deck
30
Given the trend equation ŷ = 25 + 0.6t (t = 0 in 1996), what would be the forecast value for 2000?
A) 2.4
B) 28.0
C) 3.0
D) 32.0
E) 27.4
A) 2.4
B) 28.0
C) 3.0
D) 32.0
E) 27.4
Unlock Deck
Unlock for access to all 86 flashcards in this deck.
Unlock Deck
k this deck
31
i. The moving average method averages out cyclical (C) and irregular (I) components.
ii. To apply the moving average method to a time series, the data should follow a linear trend and have a definite rhythmic pattern of fluctuations that repeat (say, every three years).
iii. Sales, production and other economic and business series usually have periods of oscillation that are of equal length or identical amplitudes.
A) (i), (ii) and (iii) are all correct statements
B) (i) and (ii) are correct statements, but not (iii).
C) (i) and (iii) are correct statements but not (ii).
D) (ii) and (iii) are correct statements but not (i).
E) All statements are false
Unlock Deck
Unlock for access to all 86 flashcards in this deck.
Unlock Deck
k this deck
32
What is a disadvantage of estimating a trend line equation by "eye-balling" the best fitting line to a scatter diagram?
A) Provides quick approximations
B) Is subject to human error
C) Provides accurate forecasts
D) Is too difficult to calculate
E) Requires graph paper
A) Provides quick approximations
B) Is subject to human error
C) Provides accurate forecasts
D) Is too difficult to calculate
E) Requires graph paper
Unlock Deck
Unlock for access to all 86 flashcards in this deck.
Unlock Deck
k this deck
33
Given a linear time series trend, = - 5.2 + 3.1t, what is the forecast for 2002 if the t = 0 in 1994?
A) 22.7
B) 33.1
C) 30.0
D) 21.7
E) 19.6
A) 22.7
B) 33.1
C) 30.0
D) 21.7
E) 19.6
Unlock Deck
Unlock for access to all 86 flashcards in this deck.
Unlock Deck
k this deck
34
The following linear trend equation was developed for annual sales from 1995 to 2001 with 1995 the base or zero year. ŷ = 500 + 60t ($000). What are the estimated sales for 2005 ($000)?
A) $500
B) $560
C) $600
D) $1,040
E) $1,100
A) $500
B) $560
C) $600
D) $1,040
E) $1,100
Unlock Deck
Unlock for access to all 86 flashcards in this deck.
Unlock Deck
k this deck
35
i. In the linear trend equation, the letter "b" is the average change in t for each change of one unit (either increase or decrease) in y.
Ii) In the linear trend equation, t is any value that corresponds with a time period, i.e., month or quarter.
Iii) The least squares method of computing the equation for a straight line going through the data of interest gives the "best fitting" line.
A) (i), (ii) and (iii) are all correct statements
B) (i) and (ii) are correct statements, but not (iii).
C) (i) and (iii) are correct statements but not (ii).
D) (ii) and (iii) are correct statements but not (i).
E) All statements are false
Unlock Deck
Unlock for access to all 86 flashcards in this deck.
Unlock Deck
k this deck
36
i. The moving average method merely smoothes out the fluctuations in the data.
ii. To apply the moving average method to a time series, the data should follow a linear trend and have a definite rhythmic pattern of fluctuations that repeat (say, every three years).
Iii) Sales, production and other economic and business series usually have periods of oscillation that are of equal length or identical amplitudes.
A) (i), (ii) and (iii) are all correct statements
B) (i) and (ii) are correct statements, but not (iii).
C) (i) and (iii) are correct statements but not (ii).
D) (ii) and (iii) are correct statements but not (i).
E) All statements are false
Unlock Deck
Unlock for access to all 86 flashcards in this deck.
Unlock Deck
k this deck
37
A linear trend equation is used to represent time series values when the dependent data are changing by equal?
A) Percents
B) Proportions
C) Amounts
D) Rights
E) Exponents
A) Percents
B) Proportions
C) Amounts
D) Rights
E) Exponents
Unlock Deck
Unlock for access to all 86 flashcards in this deck.
Unlock Deck
k this deck
38
i. In the linear trend equation, the letter "b" is the average change in t for each change of one unit (either increase or decrease) in y.
Ii) The least squares method of computing the equation for a straight line going through the data of interest gives the "best fitting" line.
Iii) A straight-line trend equation is used to represent the time series when it is believed that the data is increasing (or decreasing) by equal amounts, on the average, from one period to another.
A) (i), (ii) and (iii) are all correct statements
B) (i) and (ii) are correct statements, but not (iii).
C) (i) and (iii) are correct statements but not (ii).
D) (ii) and (iii) are correct statements but not (i).
E) All statements are false
Unlock Deck
Unlock for access to all 86 flashcards in this deck.
Unlock Deck
k this deck
39
If you have annual data for 1991 to 2002 and want to code the years for the calculation of the trend, what should you code the year 1991?
A) 0
B) 1
C) 91
D) -6
E) -13
A) 0
B) 1
C) 91
D) -6
E) -13
Unlock Deck
Unlock for access to all 86 flashcards in this deck.
Unlock Deck
k this deck
40
i. If the sales, production or other data over a period of time tend to approximate a straight-line trend, the equation developed by the least squares method cannot be used to forecast sales for a future period.
Ii) A straight-line trend equation is used to represent the time series when it is believed that the data is increasing (or decreasing) by equal amounts, on the average, from one period to another.
Iii) If the past data approximates a straight line, the equation used is = a + bt, where a is the y- intercept and b is the slope of the line.
A) (i), (ii) and (iii) are all correct statements
B) (i) and (ii) are correct statements, but not (iii).
C) (i) and (iii) are correct statements but not (ii).
D) (ii) and (iii) are correct statements but not (i).
E) All statements are false
Ii) A straight-line trend equation is used to represent the time series when it is believed that the data is increasing (or decreasing) by equal amounts, on the average, from one period to another.
Iii) If the past data approximates a straight line, the equation used is
= a + bt, where a is the y- intercept and b is the slope of the line.A) (i), (ii) and (iii) are all correct statements
B) (i) and (ii) are correct statements, but not (iii).
C) (i) and (iii) are correct statements but not (ii).
D) (ii) and (iii) are correct statements but not (i).
E) All statements are false
Unlock Deck
Unlock for access to all 86 flashcards in this deck.
Unlock Deck
k this deck
41
If a quarterly seasonal index is 0.56, it implies that:
A) the quarter's sales are 56% above the yearly average
B) the quarter's sales are 56% of the year total sales.
C) the other three quarter percentages will total 44%.
D) the quarter's sales are 56% of the yearly average
E) the quarter's sales are 56% below the yearly average
A) the quarter's sales are 56% above the yearly average
B) the quarter's sales are 56% of the year total sales.
C) the other three quarter percentages will total 44%.
D) the quarter's sales are 56% of the yearly average
E) the quarter's sales are 56% below the yearly average
Unlock Deck
Unlock for access to all 86 flashcards in this deck.
Unlock Deck
k this deck
42
Listed below is the net sales in $ million for Home Depot Inc., and its subsidiaries from 1994 to 2003. Using the printout below, what are the estimated sales for 2005?
A) $90,618.6 Million
B) $77,690.9 Million
C) $84,154.7 Million
D) $103,546.4 Million
E) $71,227.0 Million
Using the printout below, what are the estimated sales for 2005? A) $90,618.6 Million
B) $77,690.9 Million
C) $84,154.7 Million
D) $103,546.4 Million
E) $71,227.0 Million
Unlock Deck
Unlock for access to all 86 flashcards in this deck.
Unlock Deck
k this deck
43
If the data appears to be increasing exponentially and we wish to forecast number of passengers for year 9, we can use Log10 and linear regression equation. What is the linear equation for Log10 of this data?
A)
B)
C)
D)
E)
Unlock Deck
Unlock for access to all 86 flashcards in this deck.
Unlock Deck
k this deck
44
What is Log10 of the forecast for year 9?
A) 1.449
B) 28.122
C) 3.337
D) 19.325
E) 1.087
Unlock Deck
Unlock for access to all 86 flashcards in this deck.
Unlock Deck
k this deck
45
Listed below is the net sales in $ million for Home Depot Inc., and its subsidiaries from 1994 to 2003. Using the printout below, what are the estimated sales for 2006?
A) $90,618.6 Million
B) $477,690.9 Million
C) $84,154.7 Million
D) $103,546.4 Million
E) $71,227.0 Million
Using the printout below, what are the estimated sales for 2006? A) $90,618.6 Million
B) $477,690.9 Million
C) $84,154.7 Million
D) $103,546.4 Million
E) $71,227.0 Million
Unlock Deck
Unlock for access to all 86 flashcards in this deck.
Unlock Deck
k this deck
46
In the calculation of 4-quarter seasonal indices the total of the quarterly means will be:
A) 4.0.
B) 1.0.
C) 100%
D) a variable
E) 4.0/total of the quarterly means.
A) 4.0.
B) 1.0.
C) 100%
D) a variable
E) 4.0/total of the quarterly means.
Unlock Deck
Unlock for access to all 86 flashcards in this deck.
Unlock Deck
k this deck
47
How will data which increases (or decreases) by equal percents appear when plotted on graph paper having an arithmetic scale?
A) Straight line
B) Linear
C) Curvilinear
D) Parabolic
E) Discontinuous
A) Straight line
B) Linear
C) Curvilinear
D) Parabolic
E) Discontinuous
Unlock Deck
Unlock for access to all 86 flashcards in this deck.
Unlock Deck
k this deck
48
A logarithmic straight-line trend equation should be used for forecasts when the time series is increasing by?
A) Equal amounts
B) Increasing percents
C) Increasing amounts
D) Increasing or decreasing percents
E) Constant percents
A) Equal amounts
B) Increasing percents
C) Increasing amounts
D) Increasing or decreasing percents
E) Constant percents
Unlock Deck
Unlock for access to all 86 flashcards in this deck.
Unlock Deck
k this deck
49
Which of the following is true for the exponential equation?
A) Ln a = S Ln ŷ/ n
B) Ln ŷ = Ln a + tLn b
C) Ln b = S(X Ln )/ t2
D) Ln ŷ = Ln a + bLn t
E) ŷ = a + bt
A) Ln a = S Ln ŷ/ n
B) Ln ŷ = Ln a + tLn b
C) Ln b = S(X Ln
)/ t2D) Ln ŷ = Ln a + bLn t
E) ŷ = a + bt
Unlock Deck
Unlock for access to all 86 flashcards in this deck.
Unlock Deck
k this deck
50
Listed below is the net sales in $ million for Home Depot Inc., and its subsidiaries from 1994 to 2003.
Using the printout below, what are the estimated sales for 2004?
A) $90,618.6 Million
B) $77,690.9 Million
C) $84,154.7 Million
D) $103,546.4 Million
E) $71,227.0 Million
Using the printout below, what are the estimated sales for 2004?
A) $90,618.6 Million
B) $77,690.9 Million
C) $84,154.7 Million
D) $103,546.4 Million
E) $71,227.0 Million
Unlock Deck
Unlock for access to all 86 flashcards in this deck.
Unlock Deck
k this deck
51
Listed below is the net sales in $ million for Home Depot Inc., and its subsidiaries from 1994 to 2003. Using the printout below, what are the estimated sales for 2010?
A) $90,618.6 Million
B) $97,082.5 Million
C) $116,464.2 Million
D) $103,546.4 Million
E) $110,010.3 Million
Using the printout below, what are the estimated sales for 2010? A) $90,618.6 Million
B) $97,082.5 Million
C) $116,464.2 Million
D) $103,546.4 Million
E) $110,010.3 Million
Unlock Deck
Unlock for access to all 86 flashcards in this deck.
Unlock Deck
k this deck
52
What is the general equation for the logarithmic trend equation is log =:
A) Ln a + Ln b (t)
B) Ln a t Ln b (t)
C) a t b(t)
D) ab(t)
E) atb
A) Ln a + Ln b (t)
B) Ln a t Ln b (t)
C) a t b(t)
D) ab(t)
E) atb
Unlock Deck
Unlock for access to all 86 flashcards in this deck.
Unlock Deck
k this deck
53
Listed below is the net sales in $ million for Home Depot Inc., and its subsidiaries from 1994 to 2003. Using the printout below, what are the estimated sales for 2011?
A) $90,618.6 Million
B) $97,082.5 Million
C) $116,464.2 Million
D) $103,546.4 Million
E) $110,010.3 Million
Using the printout below, what are the estimated sales for 2011? A) $90,618.6 Million
B) $97,082.5 Million
C) $116,464.2 Million
D) $103,546.4 Million
E) $110,010.3 Million
Unlock Deck
Unlock for access to all 86 flashcards in this deck.
Unlock Deck
k this deck
54
What is Ln of the forecast for year 9?A) 1.449
B) 28.122
C) 3.337
D) 19.325
E) 1.087
Unlock Deck
Unlock for access to all 86 flashcards in this deck.
Unlock Deck
k this deck
55
Listed below is the net sales in $ million for Home Depot Inc., and its subsidiaries from 1994 to 2003. Using the printout below, what are the estimated sales for 2008?
A) $90,618.6 Million
B) $97,082.5 Million
C) $84,154.7 Million
D) $103,546.4 Million
E) $71,227.0 Million
Using the printout below, what are the estimated sales for 2008? A) $90,618.6 Million
B) $97,082.5 Million
C) $84,154.7 Million
D) $103,546.4 Million
E) $71,227.0 Million
Unlock Deck
Unlock for access to all 86 flashcards in this deck.
Unlock Deck
k this deck
56
A plastics manufacturing performed a quarterly time series analysis for demands over the last five years (periods 1 through 20). The analysis resulted in the following trend equation and seasonal indexes: = 920.0 + 22.6 t Based on the seasonal indexes, which quarter is expect to have 25% less demand than predicted by the trend line?
A) 1
B) 2
C) 3
D) 4
E) 1 and 3
= 920.0 + 22.6 t Based on the seasonal indexes, which quarter is expect to have 25% less demand than predicted by the trend line?A) 1
B) 2
C) 3
D) 4
E) 1 and 3
Unlock Deck
Unlock for access to all 86 flashcards in this deck.
Unlock Deck
k this deck
57
Listed below is the net sales in $ million for Home Depot Inc., and its subsidiaries from 1994 to 2003. Using the printout below, what are the estimated sales for 2007?
A) $90,618.6 Million
B) $477,690.9 Million
C) $84,154.7 Million
D) $103,546.4 Million
E) $71,227.0 Million
Using the printout below, what are the estimated sales for 2007? A) $90,618.6 Million
B) $477,690.9 Million
C) $84,154.7 Million
D) $103,546.4 Million
E) $71,227.0 Million
Unlock Deck
Unlock for access to all 86 flashcards in this deck.
Unlock Deck
k this deck
58
Listed below is the net sales in $ million for Home Depot Inc., and its subsidiaries from 1994 to 2003. Using the printout below, what are the estimated sales for 2009?
A) $90,618.6 Million
B) $97,082.5 Million
C) $84,154.7 Million
D) $103,546.4 Million
E) $71,227.0 Million
Using the printout below, what are the estimated sales for 2009? A) $90,618.6 Million
B) $97,082.5 Million
C) $84,154.7 Million
D) $103,546.4 Million
E) $71,227.0 Million
Unlock Deck
Unlock for access to all 86 flashcards in this deck.
Unlock Deck
k this deck
59
A plastics manufacturing performed a quarterly time series analysis for demands over the last five years (periods 1 through 20). The analysis resulted in the following trend equation and seasonal indexes: = 920.0 + 22.6 t Based on the seasonal indexes, which quarter is expect to have 21% more demand than predicted by the trend line?
A) 1
B) 2
C) 3
D) 4
E) 1 and 3
= 920.0 + 22.6 t Based on the seasonal indexes, which quarter is expect to have 21% more demand than predicted by the trend line?A) 1
B) 2
C) 3
D) 4
E) 1 and 3
Unlock Deck
Unlock for access to all 86 flashcards in this deck.
Unlock Deck
k this deck
60
What is the forecast for year 9?A) 20.725
B) 20.025
C) 17.100
D) 28.122
E) 19.325
Unlock Deck
Unlock for access to all 86 flashcards in this deck.
Unlock Deck
k this deck
61
i. A typical monthly seasonal index of 107.0 indicates that sales (or whatever the variable is) are 107 percent above the annual average.
ii. Each typical seasonal index is a percent with the average for the year equal to 100.
Iii) The ratio-to-moving-average method eliminates the seasonal, cyclical and irregular components from the original data (y).t6 The trend component of a time series is obtained my minimizing the sum of the squares of the errors.
A) (i), (ii) and (iii) are all correct statements
B) (i) and (ii) are correct statements, but not (iii).
C) (i) and (iii) are correct statements but not (ii).
D) (ii) and (iii) are correct statements but not (i).
E) All statements are false
Unlock Deck
Unlock for access to all 86 flashcards in this deck.
Unlock Deck
k this deck
62
i. The ratio-to-moving-average method eliminates the seasonal, cyclical and irregular components from the original data (y).
Ii) The cyclical component of a time series is described in terms relative to the seasonal index.
iii. The irregular component of a time series is the easiest to measure.
A) (i), (ii) and (iii) are all correct statements
B) (i) and (ii) are correct statements, but not (iii).
C) (i) is a correct statement but not (ii) or (iii).
D) (ii) and (iii) are correct statements but not (i).
E) All statements are false
Unlock Deck
Unlock for access to all 86 flashcards in this deck.
Unlock Deck
k this deck
63
i. The ratio-to-moving average method removes the time series trend component, resulting in 12 numbers that are called specific seasonals.
Ii) For a quarterly time series, the initial step, using the ratio-to-moving average method, is to remove the seasonal components from the time series using a 3-month centered moving average)
Iii) In the ratio-to-moving-average procedure, using the median or modified mean eliminates trend)
A) (i), (ii) and (iii) are all correct statements
B) (i) and (ii) are correct statements, but not (iii).
C) (i) and (iii) are correct statements but not (ii).
D) (ii) and (iii) are correct statements but not (i).
E) (ii) is a correct statement, but (i) and (iii) are incorrect.
Unlock Deck
Unlock for access to all 86 flashcards in this deck.
Unlock Deck
k this deck
64
i. The cyclical component of a time series is described in terms relative to the seasonal index.
ii. The irregular component of a time series is the easiest to measure.
Iii) The ratio-to-moving average method removes the time series trend component, resulting in 12 numbers that are called specific seasonals.
A) (i), (ii) and (iii) are all correct statements
B) (i) and (ii) are correct statements, but not (iii).
C) (i) and (iii) are correct statements but not (ii).
D) (ii) and (iii) are correct statements but not (i).
E) All statements are false
Unlock Deck
Unlock for access to all 86 flashcards in this deck.
Unlock Deck
k this deck
65
i. In the ratio-to-moving-average procedure, using the median or modified mean eliminates trend) ii. In the final step, using the ratio-to-moving-average method on quarterly data, the total of the modified means should theoretically be equal to 400 because the average of should be 100.
Iii) Seasonal variation is quite common in the retail and wholesale industries.
A) (i), (ii) and (iii) are all correct statements
B) (i) and (ii) are correct statements, but not (iii).
C) (i) and (iii) are correct statements but not (ii).
D) (ii) and (iii) are correct statements but not (i).
E) All statements are false
Unlock Deck
Unlock for access to all 86 flashcards in this deck.
Unlock Deck
k this deck
66
i. The reason for deseasonalizing a sales series is to remove trend and cyclical fluctuations so that we can study seasonal fluctuations.
Ii) Using the ratio-to-moving-average method, dividing the actual sales for a month by the typical seasonal for that month results in a figure that includes only trend, cycle and irregular fluctuations. This procedure is called deseasonalizing the sales.
Iii) Knowing the seasonal pattern in the form of indexes allows the retailer to deseasonalize sales. This is accomplished by dividing the actual sales for a month by the typical index for that month.
A) (i), (ii) and (iii) are all correct statements
B) (i) and (ii) are correct statements, but not (iii).
C) (i) and (iii) are correct statements but not (ii).
D) (ii) and (iii) are correct statements but not (i).
E) All statements are incorrect.
Unlock Deck
Unlock for access to all 86 flashcards in this deck.
Unlock Deck
k this deck
67
i. Using the ratio-to-moving-average method, dividing the actual sales for a month by the typical seasonal for that month results in a figure that includes only trend, cycle and irregular fluctuations. This procedure is called deseasonalizing the sales.
Ii) The reason for deseasonalizing a sales series is to remove trend and cyclical fluctuations so that we can study seasonal fluctuations.
Iii) Knowing the seasonal pattern in the form of indexes allows the retailer to deseasonalize sales.
A) (i), (ii) and (iii) are all correct statements
B) (i) and (ii) are correct statements, but not (iii).
C) (i) and (iii) are correct statements but not (ii).
D) (ii) and (iii) are correct statements but not (i).
E) All statements are incorrect.
Unlock Deck
Unlock for access to all 86 flashcards in this deck.
Unlock Deck
k this deck
68
i. The irregular component of a time series is the easiest to measure.
ii. The ratio-to-moving average method removes the time series trend component, resulting in 12 numbers that are called specific seasonals.
Iii) For a quarterly time series, the initial step, using the ratio-to-moving average method, is to remove the seasonal components from the time series using a 3-month centered moving average.
A) (i), (ii) and (iii) are all correct statements
B) (i) and (ii) are incorrect statements, but (iii) is correct.
C) (i) and (iii) are correct statements but not (ii).
D) (ii) and (iii) are correct statements but not (i).
E) All statements are false
Unlock Deck
Unlock for access to all 86 flashcards in this deck.
Unlock Deck
k this deck
69
A plastics manufacturing performed a quarterly time series analysis for demands over the last five years (periods 1 through 20). The analysis resulted in the following trend equation and seasonal indexes: = 920.0 + 22.6 t Using the trend line question and the seasonal indexes, predict demand for the third period of the next year, i.e., period 23.
A) 1439.8
B) 519.8
C) 629.0
D) 1195.2
E) 1742.2
= 920.0 + 22.6 t Using the trend line question and the seasonal indexes, predict demand for the third period of the next year, i.e., period 23.A) 1439.8
B) 519.8
C) 629.0
D) 1195.2
E) 1742.2
Unlock Deck
Unlock for access to all 86 flashcards in this deck.
Unlock Deck
k this deck
70
i. A typical monthly seasonal index of 107.0 indicates that sales (or whatever the variable is) are 107 percent above the annual average) ii. The ratio-to-moving average method removes the time series trend component, resulting in 12 numbers that are called specific seasonals.
Iii) The total of the four typical quarterly indexes should equal 100.0.
A) (i), (ii) and (iii) are all correct statements
B) (i) and (ii) are correct statements, but not (iii).
C) (i) and (iii) are correct statements but not (ii).
D) (ii) and (iii) are correct statements but not (i).
E) All statements are incorrect.
Unlock Deck
Unlock for access to all 86 flashcards in this deck.
Unlock Deck
k this deck
71
i. In the final step, using the ratio-to-moving-average method on quarterly data, the total of the modified means should theoretically be equal to 400 because the average of should be 100.
ii. Seasonal variation is quite common in the retail and wholesale industries.
iii. A typical seasonal index of 103.7 for January indicates that sales for January are below the annual average)
A) (i), (ii) and (iii) are all correct statements
B) (i) and (ii) are correct statements, but not (iii).
C) (i) and (iii) are correct statements but not (ii).
D) (ii) and (iii) are correct statements but not (i).
E) All statements are false
Unlock Deck
Unlock for access to all 86 flashcards in this deck.
Unlock Deck
k this deck
72
i. A typical monthly seasonal index of 107.0 indicates that sales (or whatever the variable is) are 7 percent above the annual average).
Ii) Seasonal variation is quite common in the retail and wholesale industries.t6
Iii) A typical seasonal index of 103.7 for January indicates that sales for January are below the annual average)
A) (i), (ii) and (iii) are all correct statements
B) (i) and (ii) are correct statements, but not (iii).
C) (i) and (iii) are correct statements but not (ii).
D) (ii) and (iii) are correct statements but not (i).
E) All statements are false
Unlock Deck
Unlock for access to all 86 flashcards in this deck.
Unlock Deck
k this deck
73
The table below shows the sales for a plastics manufacturer recorded over the past year. The seasonal indexes for each quarter are also provided). To track the trend for these four quarters, use the indexes to deseasonalize the sales data) What are deseasonalized sales for quarter 1?
A) 553.5
B) 984.0
C) 1291.5
D) 184.5
E) 922.5
What are deseasonalized sales for quarter 1?A) 553.5
B) 984.0
C) 1291.5
D) 184.5
E) 922.5
Unlock Deck
Unlock for access to all 86 flashcards in this deck.
Unlock Deck
k this deck
74
i. A typical monthly seasonal index of 107.0 indicates that sales (or whatever the variable is) are 7 percent above the annual average).
Ii) For a quarterly time series, the initial step, using the ratio-to-moving average method, is to remove the seasonal components from the time series using a 3-month centered moving average)
Iii) In the final step, using the ratio-to-moving-average method on quarterly data, the total of the modified means should theoretically be equal to 400 because the average of should be 100.
A) (i), (ii) and (iii) are all correct statements
B) (i) and (ii) are correct statements, but not (iii).
C) (i) and (iii) are correct statements but not (ii).
D) (ii) and (iii) are correct statements but not (i).
E) All statements are false
Unlock Deck
Unlock for access to all 86 flashcards in this deck.
Unlock Deck
k this deck
75
Teton Village contains shops, restaurants and motels. They have two peak seasons, - winter for skiing, and summer, for tourists visiting nearby parks. The specific seasonal with respect to the total sales volume for recent years are:
Using the seasonal indexes below, explain the typical index for the spring season.
A) Total sales for the spring season are typically 18.3% below the annual average.
B) Total sales for the spring season are typically 18.3% above the annual average.
C) Total sales for the spring season are typically 81.7% below the annual average.
D) Total sales for the spring season are typically 81.5% below the annual average.
Unlock Deck
Unlock for access to all 86 flashcards in this deck.
Unlock Deck
k this deck
76
i. In the ratio-to-moving-average procedure, using the median or modified mean eliminates trend) ii. A typical seasonal index of 103.7 for January indicates that sales for January are below the annual average)
Iii) The total of the four typical quarterly indexes should equal 100.0.
A) (i), (ii) and (iii) are all correct statements
B) (i) and (ii) are correct statements, but not (iii).
C) (i) and (iii) are correct statements but not (ii).
D) (ii) and (iii) are correct statements but not (i).
E) All statements are incorrect
Unlock Deck
Unlock for access to all 86 flashcards in this deck.
Unlock Deck
k this deck
77
The table below shows the sales for a plastics manufacturer recorded over the past year. The seasonal indexes for each quarter are also provided). To track the trend for these four quarters, use the indexes to deseasonalize the sales data) Overall, based on these four quarters, sales:
A) are definitely increasing.
B) are definitely decreasing.
C) are constant.
D) are exponentially decreasing.
E) cannot be determined
Overall, based on these four quarters, sales:A) are definitely increasing.
B) are definitely decreasing.
C) are constant.
D) are exponentially decreasing.
E) cannot be determined
Unlock Deck
Unlock for access to all 86 flashcards in this deck.
Unlock Deck
k this deck
78
i. For a quarterly time series, the initial step, using the ratio-to-moving average method, is to remove the seasonal components from the time series using a 3-month centered moving average)
Ii) In the ratio-to-moving-average procedure, using the median or modified mean eliminates trend) iii. In the final step, using the ratio-to-moving-average method on quarterly data, the total of the modified means should theoretically be equal to 400 because the average of should be 100.
A) (i), (ii) and (iii) are all correct statements
B) (i) and (ii) are correct statements, but not (iii).
C) (i) and (iii) are correct statements but not (ii).
D) (ii) and (iii) are correct statements but not (i).
E) All statements are false
Unlock Deck
Unlock for access to all 86 flashcards in this deck.
Unlock Deck
k this deck
79
Teton Village contains shops, restaurants and motels. They have two peak seasons, - winter for skiing, and summer, for tourists visiting nearby parks. The specific seasonal with respect to the total sales volume for recent years are: Using the seasonal indexes below, explain the typical index for the fall season.
A) Total sales for the fall season are typically 25.8% below the annual average.
B) Total sales for the fall season are typically 74.2% below the annual average
C) Total sales for the fall season are typically 74.2% above the annual average.
D) Total sales for the fall season are typically 31.2% below the annual average.
Using the seasonal indexes below, explain the typical index for the fall season. A) Total sales for the fall season are typically 25.8% below the annual average.
B) Total sales for the fall season are typically 74.2% below the annual average
C) Total sales for the fall season are typically 74.2% above the annual average.
D) Total sales for the fall season are typically 31.2% below the annual average.
Unlock Deck
Unlock for access to all 86 flashcards in this deck.
Unlock Deck
k this deck
80
The table below shows the sales for a plastics manufacturer recorded over the past year. The seasonal indexes for each quarter are also provided). To track the trend for these four quarters, use the indexes to deseasonalize the sales data) What are deseasonalized sales for quarter 2?
A) 973.1
B) 1052.5
C) 1291.5
D) 1012.0
E) 1027.7
What are deseasonalized sales for quarter 2?A) 973.1
B) 1052.5
C) 1291.5
D) 1012.0
E) 1027.7
Unlock Deck
Unlock for access to all 86 flashcards in this deck.
Unlock Deck
k this deck
Unlock Deck
Unlock for access to all 86 flashcards in this deck.


