Exam 16: Time Series and Forecasting
Exam 1: What Is Statistics78 Questions
Exam 2: Describing Data: Frequency Distributions and Graphic Presentation101 Questions
Exam 3: Describing Data: Numerical Measures186 Questions
Exam 4: A Survey of Probability Concepts121 Questions
Exam 5: Discrete Probability Distributions111 Questions
Exam 6: The Normal Probability Distribution129 Questions
Exam 7: Sampling Methods and the Central Limit Theorem78 Questions
Exam 8: Estimation and Confidence Intervals128 Questions
Exam 9: One-Sample Tests of a Hypothesis223 Questions
Exam 10: Two-Sample Tests of Hypothesis87 Questions
Exam 11: Analysis of Variance80 Questions
Exam 12: Linear Regression and Correlation150 Questions
Exam 13: Multiple Regression and Correlation Analysis98 Questions
Exam 14: Chi-Square Applications for Nominal Data113 Questions
Exam 15: Index Numbers65 Questions
Exam 16: Time Series and Forecasting86 Questions
Exam 17: An Introduction to Decision Theory37 Questions
Select questions type
What is the long-term behavior of a variable over an extended period of time called?
Free
(Multiple Choice)
4.8/5  (38)
(38)
Correct Answer: Verified
A
i. The moving average method merely smoothes out the fluctuations in the data.
ii. To apply the moving average method to a time series, the data should follow a linear trend and have a definite rhythmic pattern of fluctuations that repeat (say, every three years).
Iii) Sales, production and other economic and business series usually have periods of oscillation that are of equal length or identical amplitudes.
Free
(Multiple Choice)
4.8/5 (32)
Correct Answer:Verified
B
i. The moving average method averages out cyclical (C) and irregular (I) components.
ii. To apply the moving average method to a time series, the data should follow a linear trend and have a definite rhythmic pattern of fluctuations that repeat (say, every three years).
iii. Sales, production and other economic and business series usually have periods of oscillation that are of equal length or identical amplitudes.
Free
(Multiple Choice)
4.9/5 (38)
Correct Answer:Verified
B
i. In a time series analysis, the letter "a" in the linear trend equation, is the value of  when t = 0.t2 ii. In the linear trend equation, the letter "b" is the average change in t for each change of one unit (either increase or decrease) in y.
iii. In the linear trend equation, t is any value that corresponds with a time period, (i.e. month or quarter.
when t = 0.t2 ii. In the linear trend equation, the letter "b" is the average change in t for each change of one unit (either increase or decrease) in y.
iii. In the linear trend equation, t is any value that corresponds with a time period, (i.e. month or quarter.
(Multiple Choice)
4.8/5 (31)
A plastics manufacturing performed a quarterly time series analysis for demands over the last five years (periods 1 through 20). The analysis resulted in the following trend equation and seasonal indexes:  = 920.0 + 22.6 t
  Based on the seasonal indexes, which quarter is expect to have 21% more demand than predicted by the trend line?
(Multiple Choice)
5.0/5 (39)
For a time series beginning with 1988 and extending up to 2001, which year would be coded with a one when using the coded method?
(Multiple Choice)
4.9/5 (32)
The table below shows the sales for a plastics manufacturer recorded over the past year. The seasonal indexes for each quarter are also provided). To track the trend for these four quarters, use the indexes to deseasonalize the sales data) 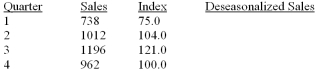 What are deseasonalized sales for quarter 2?
(Multiple Choice)
4.9/5 (39)
The table below shows the sales for a plastics manufacturer recorded over the past year. The seasonal indexes for each quarter are also provided). To track the trend for these four quarters, use the indexes to deseasonalize the sales data) 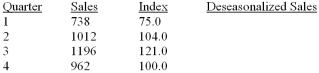 Overall, based on these four quarters, sales:
(Multiple Choice)
5.0/5 (42)
Why are long range predictions considered essential to managing a firm?
(Multiple Choice)
4.8/5 (23)
Listed below is the net sales in $ million for Home Depot Inc., and its subsidiaries from 1994 to 2003. 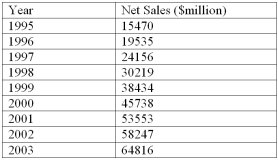 Using the printout below, what are the estimated sales for 2009?
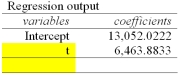
(Multiple Choice)
4.8/5 (32)
Listed below is the net sales in $ million for Home Depot Inc., and its subsidiaries from 1994 to 2003. 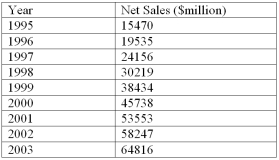 Using the printout below, what are the estimated sales for 2008?
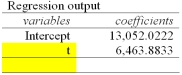
(Multiple Choice)
4.7/5 (33)
i. In the linear trend equation, the letter "b" is the average change in t for each change of one unit (either increase or decrease) in y.
ii. In the linear trend equation, t is any value that corresponds with a time period, i.e., month or quarter.
iii. The least squares method of computing the equation for a straight line going through the data of interest gives the "best fitting" line.
(Multiple Choice)
4.8/5 (29)
The table below shows the sales for a plastics manufacturer recorded over the past year. The seasonal indexes for each quarter are also provided). To track the trend for these four quarters, use the indexes to deseasonalize the sales data) 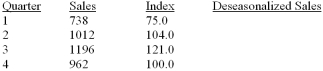 What are deseasonalized sales for quarter 3?
(Multiple Choice)
4.8/5 (26)
Economic periods of prosperity followed by recession are described as:
(Multiple Choice)
4.9/5 (24)
A plastics manufacturing performed a quarterly time series analysis for demands over the last five years (periods 1 through 20). The analysis resulted in the following trend equation and seasonal indexes:  = 920.0 + 22.6 t
 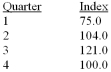 If demand for period 19 was actually 1,000, what was the deseasonalized demand?
(Multiple Choice)
4.8/5 (36)
i. The ratio-to-moving-average method eliminates the seasonal, cyclical and irregular components from the original data (y).
Ii) The cyclical component of a time series is described in terms relative to the seasonal index.
iii. The irregular component of a time series is the easiest to measure.
(Multiple Choice)
4.9/5 (40)
Listed below is the net sales in $ million for Home Depot Inc., and its subsidiaries from 1994 to 2003. 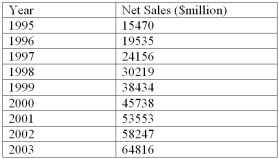 Using the printout below, what are the estimated sales for 2006?
(Multiple Choice)
4.8/5 (39)
i. The irregular component of a time series is the easiest to measure.
ii. The ratio-to-moving average method removes the time series trend component, resulting in 12 numbers that are called specific seasonals.
Iii) For a quarterly time series, the initial step, using the ratio-to-moving average method, is to remove the seasonal components from the time series using a 3-month centered moving average.
(Multiple Choice)
4.7/5 (36)
i. A typical monthly seasonal index of 107.0 indicates that sales (or whatever the variable is) are 7 percent above the annual average).
ii. For a quarterly time series, the initial step, using the ratio-to-moving average method, is to remove the seasonal components from the time series using a 3-month centered moving average)
iii. In the final step, using the ratio-to-moving-average method on quarterly data, the total of the modified means should theoretically be equal to 400 because the average of should be 100.
(Multiple Choice)
4.8/5 (29)
i. The ratio-to-moving average method removes the time series trend component, resulting in 12 numbers that are called specific seasonals.
ii. For a quarterly time series, the initial step, using the ratio-to-moving average method, is to remove the seasonal components from the time series using a 3-month centered moving average)
iii. In the ratio-to-moving-average procedure, using the median or modified mean eliminates trend)
(Multiple Choice)
4.8/5 (24)
Filters
- Essay(0)
- Multiple Choice(0)
- Short Answer(0)
- True False(0)
- Matching(0)