Deck 13: Nonparametric Tests
Full screen (f)
Question
A standard aptitude test is given to several randomly selected programmers, and the scores are given below for the mathematics and verbal portions of the test. Use the sign test to test the
claim that programmers do better on the mathematics portion of the test. Use a 0.05 level of
significance.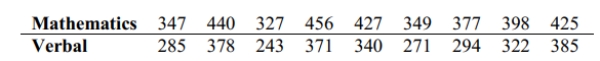
claim that programmers do better on the mathematics portion of the test. Use a 0.05 level of
significance.
Question
Question
Question
Question
Question
Use the runs test to determine whether the given sequence is random. Use a significance level of 0.05 . A true-false test had the following answer sequence.

Test the null hypothesis that the sequence was random.
Test the null hypothesis that the sequence was random.
Question
Use the rank correlation coefficient to test for a correlation between the two variables. Given that the rank correlation coefficient,  for 37 pairs of data is 0.324 , test the claim of correlation between the two variables. Use a significance level of 0.01 .
for 37 pairs of data is 0.324 , test the claim of correlation between the two variables. Use a significance level of 0.01 . Question
Use a 0.05 level of significance to test the claim that the sequence of computer -generated numbers is random. Test for randomness above and below the mean. 
Question
Use a Kruskal-Wallis test to test the claim that the samples come from populations with equal medians. Listed below are grade averages for randomly selected students with three different
categories of high-school background. At the 0.05 level of significance, test the claim that the
three groups have the same median grade average.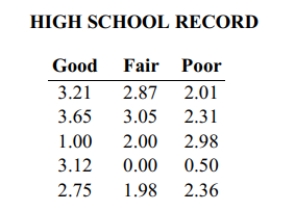
categories of high-school background. At the 0.05 level of significance, test the claim that the
three groups have the same median grade average.
Question
Use the sign test to test the indicated claim. The heights of 16 randomly selected women are given below. Use a significance level of 0.05 to test the claim that the population median is
equal to 64.0 inches.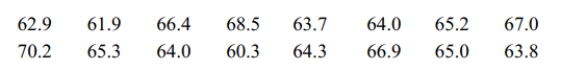
equal to 64.0 inches.
Question
Use the Wilcoxon signed -ranks test to test the claim that the matched pairs have differences that come from a population with a median equal to zero. Eleven runners are timed at the 100-
meter dash and are timed again one month later after following a new training program. The
times (in seconds)are shown in the table. Use Wilcoxon's signed-ranks test and a significance
level of 0.05 to test the claim that the training has no effect on the times.
meter dash and are timed again one month later after following a new training program. The
times (in seconds)are shown in the table. Use Wilcoxon's signed-ranks test and a significance
level of 0.05 to test the claim that the training has no effect on the times.
Question
Use the rank correlation coefficient to test for a correlation between the two variables. A placement test is required for students desiring to take a finite mathematics course at a
university. The instructor of the course studies the relationship between students' placement
test score and final course score. A random sample of eight students yields the following data.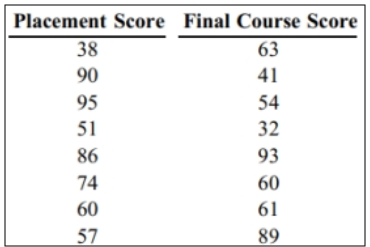
Compute the rank correlation coefficient, r_{s} , of the data and test the claim of correlation between placement score and final course score. Use a significance level of 0.05 .
Question
Use the Wilcoxon rank-sum test to test the claim that the two independent samples come from populations with equal medians. Use the Wilcoxon rank-sum approach to test the claim that
the sample student grade averages at two colleges come from populations with the same
median. The sample data is listed below. Use a 0.05 level of significance, and assume that the
samples were randomly selected.
the sample student grade averages at two colleges come from populations with the same
median. The sample data is listed below. Use a 0.05 level of significance, and assume that the
samples were randomly selected.
Question
Use the runs test to determine whether the given sequence is random. Use a significance level of 0.05. The sequence of numbers below represents the maximum temperature (in degrees
Fahrenheit)in July in one U.S. town for 30 consecutive years. Test the sequence for
randomness above and below the median.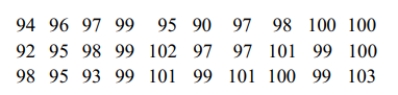
Fahrenheit)in July in one U.S. town for 30 consecutive years. Test the sequence for
randomness above and below the median.
Question
Use the Wilcoxon rank-sum test to test the claim that the two independent samples come from populations with equal medians. SAT scores for students selected randomly from two different
schools are shown below. Use a significance level of 0.05 to test the claim that the scores for
the two schools are from populations with the same median.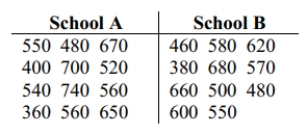
schools are shown below. Use a significance level of 0.05 to test the claim that the scores for
the two schools are from populations with the same median.
Question
Question
Question
Question
Use the sign test to test the indicated claim. Fourteen people rated two brands of soda on a scale of 1 to 5. 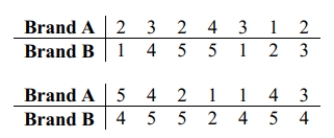 At the 5 percent level, test the null hypothesis that the two brands of soda are equally popular.
At the 5 percent level, test the null hypothesis that the two brands of soda are equally popular. Question
Question
Question
Use the Wilcoxon signed -ranks test to test the claim that the matched pairs have differences that come from a population with a median equal to zero. Eleven runners are timed at the 100-
meter dash and are timed again one month later after following a new training program. The
times (in seconds)are shown in the table. Use Wilcoxon's signed-ranks test and a significance
level of 0.05 to test the claim that the training has no effect on the times.
meter dash and are timed again one month later after following a new training program. The
times (in seconds)are shown in the table. Use Wilcoxon's signed-ranks test and a significance
level of 0.05 to test the claim that the training has no effect on the times.
Question
Question
Use the Wilcoxon rank-sum approach to test the claim that the two independent sample student grade averages at two colleges come from populations with equal medians. The sample data is listed below. Use a 0.05 level of significance, and assume that the samples were randomly selected.

Question
Use the rank correlation coefficient to test for a correlation between the two variables. Ten trucks were ranked according to their comfort levels and their prices.
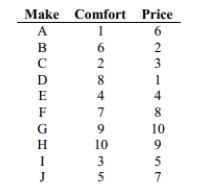
Find the rank correlation coefficient and test the claim of correlation between comfort and price. Use a significance level of 0.05 .
Find the rank correlation coefficient and test the claim of correlation between comfort and price. Use a significance level of 0.05 .
Question
Question
Question
Question
Question
Use a Kruskal-Wallis test to test the claim that the samples come from populations with equal medians. The table below shows the weights (in pounds)of 6 randomly selected women in
each of three different age groups. Use a 0.01 significance level to test the claim that the 3
age-groups have the same median weight.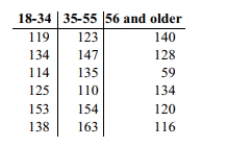
each of three different age groups. Use a 0.01 significance level to test the claim that the 3
age-groups have the same median weight.
Question
Question
Use the runs test to determine whether the given sequence is random. Use a significance level of 0.05. The sequence of numbers below represents the maximum temperature (in degrees
Fahrenheit)in July in one U.S. town for 30 consecutive years. Test the sequence for
randomness above and below the median.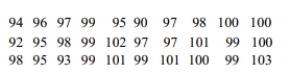
Fahrenheit)in July in one U.S. town for 30 consecutive years. Test the sequence for
randomness above and below the median.
Question
Use the sign test to test the indicated claim. The waiting times (in minutes)of 28 randomly selected customers in a bank are given below. Use a significance level of 0.05 to test the claim
that the population median is equal to 5.3 minutes.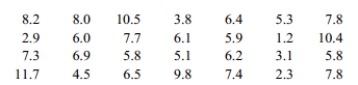
that the population median is equal to 5.3 minutes.
Question
Question
Use the rank correlation coefficient to test for a correlation between the two variables. Use the sample data below to find the rank correlation coefficient and test the claim of correlation
between math and verbal scores. Use a significance level of 0.05.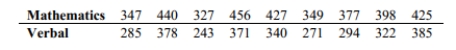
between math and verbal scores. Use a significance level of 0.05.
Question
Use the runs test to determine whether the given sequence is random. Use a significance level of 0.05. Test the sequence of digits below for randomness above and below the value of 4.5. 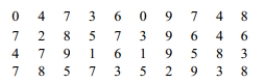
Question
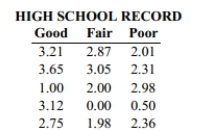
Use a Kruskal-Wallis test to test the claim that the samples come from populations with equal medians. Listed below are grade averages for randomly selected students with three different categories of high-school background. At the 0.05 level of significance, test the claim that the three groups have the same median grade average.
Question
A teacher uses two different CAI programs to remediate a randomly selected group of students. Results for two independent samples on a standardized test are listed in a table
below. At the 0.05 level of significance, use the Wilcoxon rank-sum test to test the hypothesis
that the sample results are from populations with equal medians.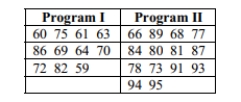
below. At the 0.05 level of significance, use the Wilcoxon rank-sum test to test the hypothesis
that the sample results are from populations with equal medians.
Question
Use the sign test to test the indicated claim. An instructor gives a test before and after a lesson and results from randomly selected students are given below. At the 0.05 level of significance,
test the claim that the lesson has no effect on the grade. Use the sign test.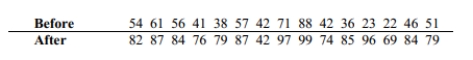
test the claim that the lesson has no effect on the grade. Use the sign test.
Question
Use the runs test to determine whether the given sequence is random. Use a significance level of 0.05. A sample of 30 clock radios is selected in sequence from an assembly line. Each
radio is examined and judged to be acceptable (A)or defective (D). The results are shown
below. Test for randomness.
radio is examined and judged to be acceptable (A)or defective (D). The results are shown
below. Test for randomness.
Question
The following scatterpolt shows the percentage of the vote a candidate received in the 2004 senatoral elections according to the voter's income level based on an exit poll of the voters conducted bu CNN. The income levels 1-8 correspond to the followng income classes: 1=under $15,00; 2=$15-30,000; 3=$30-50,000; 4=$50=75,000; 5=$75-100,000; 6=$100-150,000; 7=$150=200,000; 8=$200,000 or more.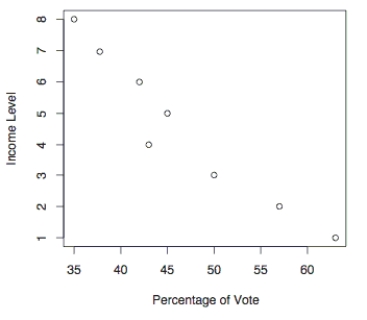
Use the election scatterplot to the find the critical values corresponding to a 0.01 significance level used to test the null hypothesis of Ps=0 .
A) -0.881 and 0.881
B) -0.881
C) -0.738 and 0.738
D) 0.881
Use the election scatterplot to the find the critical values corresponding to a 0.01 significance level used to test the null hypothesis of Ps=0 .
A) -0.881 and 0.881
B) -0.881
C) -0.738 and 0.738
D) 0.881
Question
The following scatterpolt shows the percentage of the vote a candidate received in the 2004 senatoral elections according to the voter's income level based on an exit poll of the voters conducted bu CNN. The income levels 1-8 correspond to the followng income classes: 1=under $15,00; 2=$15-30,000; 3=$30-50,000; 4=$50=75,000; 5=$75-100,000; 6=$100-150,000; 7=$150=200,000; 8=$200,000 or more.
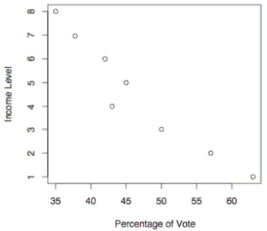
Use the election scatterplot to determine whether there is a correlation between percentage of vote and income level at the 0.01 significance level with a null hypothesis of Pz=0 .
A) The test statistic is between the critical values, so we fail to reject the null hypothesis. There is no evidence to support a claim of correlation between percentage of vote and income level.
B) The test statistic is not between the critical values, so we fail to reject the null hypothesis. There is no evidence to support a claim of correlation between percentage of vote and income level.
C) The test statistic is between the critical values, so we reject the null hypothesis. There is sufficient evidence to support a claim of correlation between percentage of vote and income level.
D) The test statistic is not between the critical values, so we reject the null hypothesis. There is sufficient evidence to support a claim of correlation between percentage of vote and income level.
Question
Question
Question
Question
Find the critical value. Assume that the test is two-tailed and that n denotes the number of pairs of data.
n=30, = 0.05
A) 0.362
B) -0.362
C) ±0.306
D)
n=30,
= 0.05A) 0.362
B) -0.362
C) ±0.306
D)
Question
Question
Question
Find the critical value. Assume that the test is two -tailed and that n denotes the number of pairs of data. n=20 , 
A) -0.570
B) 0.570
C)
D)
A) -0.570
B) 0.570
C)
D)
Question
Question
Question
Use a Kruskal-Wallis test to test the claim that the samples come from populations with equal medians. SAT scores for students selected randomly from three different schools are shown below. Use a significance level of 0.05 to test the claim that the students from the three
Schools had the same median SAT score.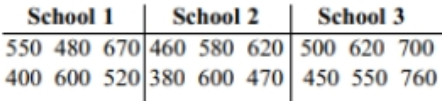
What would be the value of R1 that would be used in finding H ?
A) R1=54
B) R1=52
C) R1=9
D) R1=6
Schools had the same median SAT score.
What would be the value of R1 that would be used in finding H ?
A) R1=54
B) R1=52
C) R1=9
D) R1=6
Question
In a study of the effectiveness of physical exercise in weight reduction, 12 subjects followed a program of physical exercise for two months. Their weights (in pounds)before and after this program are shown in the table. Use Wilcoxon's signed -ranks test and a significance level of
0)05 to test the claim that the exercise program has no effect on weight.
What would be the signed rank for the column with values of 175 and 168 ?
A) 8
B) 9
C) 10
D) 8.5
0)05 to test the claim that the exercise program has no effect on weight.
What would be the signed rank for the column with values of 175 and 168 ?
A) 8
B) 9
C) 10
D) 8.5
Question
Question
Question
Question
Use the runs test to determine whether the given sequence is random. Use a significance level of 0.05 . The outcomes (odd number or even number) of a roulette wheel are shown below. Test for randomness of odd (O) and even (E) numbers. Use a significance level of 0.05 .

What is the value of G , the number of runs?
A) 10
B) 14
C) 17
D) 18
What is the value of G , the number of runs?
A) 10
B) 14
C) 17
D) 18
Question
Question
Question

Unlock Deck
Sign up to unlock the cards in this deck!
Unlock Deck
Unlock Deck
1/60
Play
Full screen (f)
Deck 13: Nonparametric Tests
1
A standard aptitude test is given to several randomly selected programmers, and the scores are given below for the mathematics and verbal portions of the test. Use the sign test to test the
claim that programmers do better on the mathematics portion of the test. Use a 0.05 level of
significance.
claim that programmers do better on the mathematics portion of the test. Use a 0.05 level of
significance.
H0 : The math scores are equal to or less than the verbal scores. H1 : The math scores are greater than the verbal scores.
Test statistic: x=0 . Critical value: x=1 .
Reject the null hypothesis. There is sufficient evidence to support the claim that the math scores are greater than the verbal scores.
Test statistic: x=0 . Critical value: x=1 .
Reject the null hypothesis. There is sufficient evidence to support the claim that the math scores are greater than the verbal scores.
2
Describe the rank correlation test. What types of hypotheses is it used to test? How does the rank correlation coefficient rs differ from the Pearson correlation coefficient r?
The rank correlation test uses ranks to measure the strength of the relation between two variables. The rank
correlation test is used to test the null hypothesis that there is no correlation between the two variables. The Pearson
correlation coefficient r detects linear relationships between two variables. The rank correlation rs, also known as
Spearman's rank correlation coefficient, detects relationships which are non-linear as well as linear.
3
List the advantages and disadvantages of nonparametric tests.
Advantages: 1) Nonparametric methods can be applied to a wide variety of situations because they do not have the
rigid requirements of their parametric counterparts. In particular, nonparametric tests do not require normally
distributed populations. 2) Nonparametric tests can often be applied to nonnumerical data. 3) Nonparametric
methods usually involve simpler computations than the corresponding parametric methods. Disadvantages: 1)
Nonparametric methods tend to waste information because exact numerical data are reduced to a qualitative form.
2) Nonparametric tests are not as efficient as parametric tests so we generally need stronger evidence (such as a
larger sample or a greater difference) before we reject a null hypothesis.
4
When applying the runs test for randomness above and below the median for 12 dollar/Euro exchange rate highs, the test statistic is G = 2. What does that value tell us about the data?
Unlock Deck
Unlock for access to all 60 flashcards in this deck.
Unlock Deck
k this deck
5
Describe the sign test. What types of hypotheses is it used to test? What is the underlying concept?
Unlock Deck
Unlock for access to all 60 flashcards in this deck.
Unlock Deck
k this deck
6
Use the runs test to determine whether the given sequence is random. Use a significance level of 0.05 . A true-false test had the following answer sequence.
Test the null hypothesis that the sequence was random.
Test the null hypothesis that the sequence was random.
Unlock Deck
Unlock for access to all 60 flashcards in this deck.
Unlock Deck
k this deck
7
Use the rank correlation coefficient to test for a correlation between the two variables. Given that the rank correlation coefficient, for 37 pairs of data is 0.324 , test the claim of correlation between the two variables. Use a significance level of 0.01 .
for 37 pairs of data is 0.324 , test the claim of correlation between the two variables. Use a significance level of 0.01 . Unlock Deck
Unlock for access to all 60 flashcards in this deck.
Unlock Deck
k this deck
8
Use a 0.05 level of significance to test the claim that the sequence of computer -generated numbers is random. Test for randomness above and below the mean.
Unlock Deck
Unlock for access to all 60 flashcards in this deck.
Unlock Deck
k this deck
9
Use a Kruskal-Wallis test to test the claim that the samples come from populations with equal medians. Listed below are grade averages for randomly selected students with three different
categories of high-school background. At the 0.05 level of significance, test the claim that the
three groups have the same median grade average.
categories of high-school background. At the 0.05 level of significance, test the claim that the
three groups have the same median grade average.
Unlock Deck
Unlock for access to all 60 flashcards in this deck.
Unlock Deck
k this deck
10
Use the sign test to test the indicated claim. The heights of 16 randomly selected women are given below. Use a significance level of 0.05 to test the claim that the population median is
equal to 64.0 inches.
equal to 64.0 inches.
Unlock Deck
Unlock for access to all 60 flashcards in this deck.
Unlock Deck
k this deck
11
Use the Wilcoxon signed -ranks test to test the claim that the matched pairs have differences that come from a population with a median equal to zero. Eleven runners are timed at the 100-
meter dash and are timed again one month later after following a new training program. The
times (in seconds)are shown in the table. Use Wilcoxon's signed-ranks test and a significance
level of 0.05 to test the claim that the training has no effect on the times.
meter dash and are timed again one month later after following a new training program. The
times (in seconds)are shown in the table. Use Wilcoxon's signed-ranks test and a significance
level of 0.05 to test the claim that the training has no effect on the times.
Unlock Deck
Unlock for access to all 60 flashcards in this deck.
Unlock Deck
k this deck
12
Use the rank correlation coefficient to test for a correlation between the two variables. A placement test is required for students desiring to take a finite mathematics course at a
university. The instructor of the course studies the relationship between students' placement
test score and final course score. A random sample of eight students yields the following data.
Compute the rank correlation coefficient, r_{s} , of the data and test the claim of correlation between placement score and final course score. Use a significance level of 0.05 .
university. The instructor of the course studies the relationship between students' placement
test score and final course score. A random sample of eight students yields the following data.
Compute the rank correlation coefficient, r_{s} , of the data and test the claim of correlation between placement score and final course score. Use a significance level of 0.05 .
Unlock Deck
Unlock for access to all 60 flashcards in this deck.
Unlock Deck
k this deck
13
Use the Wilcoxon rank-sum test to test the claim that the two independent samples come from populations with equal medians. Use the Wilcoxon rank-sum approach to test the claim that
the sample student grade averages at two colleges come from populations with the same
median. The sample data is listed below. Use a 0.05 level of significance, and assume that the
samples were randomly selected.
the sample student grade averages at two colleges come from populations with the same
median. The sample data is listed below. Use a 0.05 level of significance, and assume that the
samples were randomly selected.
Unlock Deck
Unlock for access to all 60 flashcards in this deck.
Unlock Deck
k this deck
14
Use the runs test to determine whether the given sequence is random. Use a significance level of 0.05. The sequence of numbers below represents the maximum temperature (in degrees
Fahrenheit)in July in one U.S. town for 30 consecutive years. Test the sequence for
randomness above and below the median.
Fahrenheit)in July in one U.S. town for 30 consecutive years. Test the sequence for
randomness above and below the median.
Unlock Deck
Unlock for access to all 60 flashcards in this deck.
Unlock Deck
k this deck
15
Use the Wilcoxon rank-sum test to test the claim that the two independent samples come from populations with equal medians. SAT scores for students selected randomly from two different
schools are shown below. Use a significance level of 0.05 to test the claim that the scores for
the two schools are from populations with the same median.
schools are shown below. Use a significance level of 0.05 to test the claim that the scores for
the two schools are from populations with the same median.
Unlock Deck
Unlock for access to all 60 flashcards in this deck.
Unlock Deck
k this deck
16
Describe the Wilcoxon rank-sum test. What type of hypotheses is it used to test? What assumptions are made for this test? What is the underlying concept?
Unlock Deck
Unlock for access to all 60 flashcards in this deck.
Unlock Deck
k this deck
17
Define rank. Explain how to find the rank for data which repeats (for example, the data set: 4, 5, 5, 5, 7, 8, 12, 12, 15, 18).
Unlock Deck
Unlock for access to all 60 flashcards in this deck.
Unlock Deck
k this deck
18
Give at least two examples of nonparametric tests and their comparable parametric tests
Unlock Deck
Unlock for access to all 60 flashcards in this deck.
Unlock Deck
k this deck
19
Use the sign test to test the indicated claim. Fourteen people rated two brands of soda on a scale of 1 to 5. At the 5 percent level, test the null hypothesis that the two brands of soda are equally popular.
At the 5 percent level, test the null hypothesis that the two brands of soda are equally popular. Unlock Deck
Unlock for access to all 60 flashcards in this deck.
Unlock Deck
k this deck
20
Explain what an efficiency rating is. You may use an example to explain this concept. Do comparable parametric or nonparametric tests have higher efficiency ratings?
Unlock Deck
Unlock for access to all 60 flashcards in this deck.
Unlock Deck
k this deck
21
Provide the appropriate response. Describe the Wilcoxon signed-ranks test. What types of hypotheses is it used to test? What assumptions are made for this test?
Unlock Deck
Unlock for access to all 60 flashcards in this deck.
Unlock Deck
k this deck
22
Use the Wilcoxon signed -ranks test to test the claim that the matched pairs have differences that come from a population with a median equal to zero. Eleven runners are timed at the 100-
meter dash and are timed again one month later after following a new training program. The
times (in seconds)are shown in the table. Use Wilcoxon's signed-ranks test and a significance
level of 0.05 to test the claim that the training has no effect on the times.
meter dash and are timed again one month later after following a new training program. The
times (in seconds)are shown in the table. Use Wilcoxon's signed-ranks test and a significance
level of 0.05 to test the claim that the training has no effect on the times.
Unlock Deck
Unlock for access to all 60 flashcards in this deck.
Unlock Deck
k this deck
23
Describe the sign test. What types of hypotheses is it used to test? What is the underlying concept?
Unlock Deck
Unlock for access to all 60 flashcards in this deck.
Unlock Deck
k this deck
24
Use the Wilcoxon rank-sum approach to test the claim that the two independent sample student grade averages at two colleges come from populations with equal medians. The sample data is listed below. Use a 0.05 level of significance, and assume that the samples were randomly selected.
Unlock Deck
Unlock for access to all 60 flashcards in this deck.
Unlock Deck
k this deck
25
Use the rank correlation coefficient to test for a correlation between the two variables. Ten trucks were ranked according to their comfort levels and their prices.
Find the rank correlation coefficient and test the claim of correlation between comfort and price. Use a significance level of 0.05 .
Find the rank correlation coefficient and test the claim of correlation between comfort and price. Use a significance level of 0.05 .
Unlock Deck
Unlock for access to all 60 flashcards in this deck.
Unlock Deck
k this deck
26
When applying the runs test for randomness above and below the median for 10 scores on a final exam, the test statistic is G = 2. What does that value tell us about the data?
Unlock Deck
Unlock for access to all 60 flashcards in this deck.
Unlock Deck
k this deck
27
Describe the runs test for randomness. What types of hypotheses is it used to test? Does the runs test measure frequency? What is the underlying concept?
Unlock Deck
Unlock for access to all 60 flashcards in this deck.
Unlock Deck
k this deck
28
Use the sign test to test the indicated claim. A researcher wishes to test whether a particular diet has an effect on blood pressure. The blood pressure of 25 randomly selected adults is
measured. After one month on the diet, each person's blood pressure is again measured. For
19 people, the second blood pressure reading was lower than the first, and for 6 people, the
second blood pressure reading was higher than the first. At the 0.01 significance level, test the
claim that the diet has an effect on blood pressure.
Unlock Deck
Unlock for access to all 60 flashcards in this deck.
Unlock Deck
k this deck
29
Match the parametric test with its comparable nonparametric test.
1. matched pair t test
2. two independent samples t test
3. analysis of variance ( F test)
4. linear correlation
A) rank correlation test
B) Wilcoxon rank-sum test
C) Kruskal-Wallis test
D) sign test
1. matched pair t test
2. two independent samples t test
3. analysis of variance ( F test)
4. linear correlation
A) rank correlation test
B) Wilcoxon rank-sum test
C) Kruskal-Wallis test
D) sign test
Unlock Deck
Unlock for access to all 60 flashcards in this deck.
Unlock Deck
k this deck
30
Use a Kruskal-Wallis test to test the claim that the samples come from populations with equal medians. The table below shows the weights (in pounds)of 6 randomly selected women in
each of three different age groups. Use a 0.01 significance level to test the claim that the 3
age-groups have the same median weight.
each of three different age groups. Use a 0.01 significance level to test the claim that the 3
age-groups have the same median weight.
Unlock Deck
Unlock for access to all 60 flashcards in this deck.
Unlock Deck
k this deck
31
If test A has an efficiency rating of 0.94 as compared to test B, explain what that efficiency rating means. Do comparable nonparametric or parametric tests have higher efficiency
ratings?
ratings?
Unlock Deck
Unlock for access to all 60 flashcards in this deck.
Unlock Deck
k this deck
32
Use the runs test to determine whether the given sequence is random. Use a significance level of 0.05. The sequence of numbers below represents the maximum temperature (in degrees
Fahrenheit)in July in one U.S. town for 30 consecutive years. Test the sequence for
randomness above and below the median.
Fahrenheit)in July in one U.S. town for 30 consecutive years. Test the sequence for
randomness above and below the median.
Unlock Deck
Unlock for access to all 60 flashcards in this deck.
Unlock Deck
k this deck
33
Use the sign test to test the indicated claim. The waiting times (in minutes)of 28 randomly selected customers in a bank are given below. Use a significance level of 0.05 to test the claim
that the population median is equal to 5.3 minutes.
that the population median is equal to 5.3 minutes.
Unlock Deck
Unlock for access to all 60 flashcards in this deck.
Unlock Deck
k this deck
34
Solve the problem. Critical values for the runs test for randomness can be calculated by listing all possible sequences. Using the elements B, B, B, R, R, R list the 20 different possible
sequences. Find the number of runs for each sequence. Are you able to find 5% cutoff values
for G? What do you conclude?
sequences. Find the number of runs for each sequence. Are you able to find 5% cutoff values
for G? What do you conclude?
Unlock Deck
Unlock for access to all 60 flashcards in this deck.
Unlock Deck
k this deck
35
Use the rank correlation coefficient to test for a correlation between the two variables. Use the sample data below to find the rank correlation coefficient and test the claim of correlation
between math and verbal scores. Use a significance level of 0.05.
between math and verbal scores. Use a significance level of 0.05.
Unlock Deck
Unlock for access to all 60 flashcards in this deck.
Unlock Deck
k this deck
36
Use the runs test to determine whether the given sequence is random. Use a significance level of 0.05. Test the sequence of digits below for randomness above and below the value of 4.5.
Unlock Deck
Unlock for access to all 60 flashcards in this deck.
Unlock Deck
k this deck
37
Use a Kruskal-Wallis test to test the claim that the samples come from populations with equal medians. Listed below are grade averages for randomly selected students with three different categories of high-school background. At the 0.05 level of significance, test the claim that the three groups have the same median grade average.
Unlock Deck
Unlock for access to all 60 flashcards in this deck.
Unlock Deck
k this deck
38
A teacher uses two different CAI programs to remediate a randomly selected group of students. Results for two independent samples on a standardized test are listed in a table
below. At the 0.05 level of significance, use the Wilcoxon rank-sum test to test the hypothesis
that the sample results are from populations with equal medians.
below. At the 0.05 level of significance, use the Wilcoxon rank-sum test to test the hypothesis
that the sample results are from populations with equal medians.
Unlock Deck
Unlock for access to all 60 flashcards in this deck.
Unlock Deck
k this deck
39
Use the sign test to test the indicated claim. An instructor gives a test before and after a lesson and results from randomly selected students are given below. At the 0.05 level of significance,
test the claim that the lesson has no effect on the grade. Use the sign test.
test the claim that the lesson has no effect on the grade. Use the sign test.
Unlock Deck
Unlock for access to all 60 flashcards in this deck.
Unlock Deck
k this deck
40
Use the runs test to determine whether the given sequence is random. Use a significance level of 0.05. A sample of 30 clock radios is selected in sequence from an assembly line. Each
radio is examined and judged to be acceptable (A)or defective (D). The results are shown
below. Test for randomness.
radio is examined and judged to be acceptable (A)or defective (D). The results are shown
below. Test for randomness.
Unlock Deck
Unlock for access to all 60 flashcards in this deck.
Unlock Deck
k this deck
41
The following scatterpolt shows the percentage of the vote a candidate received in the 2004 senatoral elections according to the voter's income level based on an exit poll of the voters conducted bu CNN. The income levels 1-8 correspond to the followng income classes: 1=under $15,00; 2=$15-30,000; 3=$30-50,000; 4=$50=75,000; 5=$75-100,000; 6=$100-150,000; 7=$150=200,000; 8=$200,000 or more.
Use the election scatterplot to the find the critical values corresponding to a 0.01 significance level used to test the null hypothesis of Ps=0 .
A) -0.881 and 0.881
B) -0.881
C) -0.738 and 0.738
D) 0.881
Use the election scatterplot to the find the critical values corresponding to a 0.01 significance level used to test the null hypothesis of Ps=0 .
A) -0.881 and 0.881
B) -0.881
C) -0.738 and 0.738
D) 0.881
Unlock Deck
Unlock for access to all 60 flashcards in this deck.
Unlock Deck
k this deck
42
The following scatterpolt shows the percentage of the vote a candidate received in the 2004 senatoral elections according to the voter's income level based on an exit poll of the voters conducted bu CNN. The income levels 1-8 correspond to the followng income classes: 1=under $15,00; 2=$15-30,000; 3=$30-50,000; 4=$50=75,000; 5=$75-100,000; 6=$100-150,000; 7=$150=200,000; 8=$200,000 or more.
Use the election scatterplot to determine whether there is a correlation between percentage of vote and income level at the 0.01 significance level with a null hypothesis of Pz=0 .
A) The test statistic is between the critical values, so we fail to reject the null hypothesis. There is no evidence to support a claim of correlation between percentage of vote and income level.
B) The test statistic is not between the critical values, so we fail to reject the null hypothesis. There is no evidence to support a claim of correlation between percentage of vote and income level.
C) The test statistic is between the critical values, so we reject the null hypothesis. There is sufficient evidence to support a claim of correlation between percentage of vote and income level.
D) The test statistic is not between the critical values, so we reject the null hypothesis. There is sufficient evidence to support a claim of correlation between percentage of vote and income level.
Unlock Deck
Unlock for access to all 60 flashcards in this deck.
Unlock Deck
k this deck
43
Which statement is false about the Wilcoxon signed-ranks test?
A) It is used for testing a claim that a population of matched pairs has the property that the
Matched pairs have differences with a median equal to zero.
B) It is used for testing a claim that a single population of individual values has a median
Equal to some claimed value.
C) It is used for testing a claim that a single population of individual values has a mean
Equal to some claimed value.
D) It is a nonparametric test.
Unlock Deck
Unlock for access to all 60 flashcards in this deck.
Unlock Deck
k this deck
44
Which of the following terms is sometimes used instead of "non-parametric test"?_
A) Normality test
B) Abnormality test
C) Distribution-free test
D) Efficiency test
A) Normality test
B) Abnormality test
C) Distribution-free test
D) Efficiency test
Unlock Deck
Unlock for access to all 60 flashcards in this deck.
Unlock Deck
k this deck
45
Which of the following is not an application of the sign test?
A) Test claims involving matched pairs
B) Test claims involving nominal data
C) Test claims about the median of a single population
D) Test claims about correlation
A) Test claims involving matched pairs
B) Test claims involving nominal data
C) Test claims about the median of a single population
D) Test claims about correlation
Unlock Deck
Unlock for access to all 60 flashcards in this deck.
Unlock Deck
k this deck
46
Find the critical value. Assume that the test is two-tailed and that n denotes the number of pairs of data.
n=30,= 0.05
A) 0.362
B) -0.362
C) ±0.306
D)
n=30,
= 0.05A) 0.362
B) -0.362
C) ±0.306
D)
Unlock Deck
Unlock for access to all 60 flashcards in this deck.
Unlock Deck
k this deck
47
If the critical values for a run test (found from table A-10)are 8 and 19 and the G value is 17, what should your conclusion about randomness be?
A) Reject randomness.
B) Fail to reject randomness.
C) Support randomness.
A) Reject randomness.
B) Fail to reject randomness.
C) Support randomness.
Unlock Deck
Unlock for access to all 60 flashcards in this deck.
Unlock Deck
k this deck
48
A rank correlation coefficient is to be calculated for a collection of paired data. lie between -10 and 10. Which of the following could affect the value of the rank correlation coefficient?
I: Multiplying every value of one variable by 3
II: Interchanging the two variables
III: Adding 2 to each value of one variable
IV: Replacing every value of one variable by its absolute value
A) I and IV
B) III
C) I
D) IV
I: Multiplying every value of one variable by 3
II: Interchanging the two variables
III: Adding 2 to each value of one variable
IV: Replacing every value of one variable by its absolute value
A) I and IV
B) III
C) I
D) IV
Unlock Deck
Unlock for access to all 60 flashcards in this deck.
Unlock Deck
k this deck
49
Find the critical value. Assume that the test is two -tailed and that n denotes the number of pairs of data. n=20 ,
A) -0.570
B) 0.570
C)
D)
A) -0.570
B) 0.570
C)
D)
Unlock Deck
Unlock for access to all 60 flashcards in this deck.
Unlock Deck
k this deck
50
Find the ranks corresponding to the ages of five statistics professors when they were hired: 47, 51, 47, 47, 48
A) 1, 3, 1, 1, 2
B) 2, 5, 2, 2, 4
C) 3, 5, 3, 3, 4
D) 2, 4, 2, 2, 3
A) 1, 3, 1, 1, 2
B) 2, 5, 2, 2, 4
C) 3, 5, 3, 3, 4
D) 2, 4, 2, 2, 3
Unlock Deck
Unlock for access to all 60 flashcards in this deck.
Unlock Deck
k this deck
51
What is the corresponding parametric test for the Kruskal-Wallis test?
A) t-test
B) z-test
C) Linear correlation
D) Analysis of Variance
A) t-test
B) z-test
C) Linear correlation
D) Analysis of Variance
Unlock Deck
Unlock for access to all 60 flashcards in this deck.
Unlock Deck
k this deck
52
Use a Kruskal-Wallis test to test the claim that the samples come from populations with equal medians. SAT scores for students selected randomly from three different schools are shown below. Use a significance level of 0.05 to test the claim that the students from the three
Schools had the same median SAT score.
What would be the value of R1 that would be used in finding H ?
A) R1=54
B) R1=52
C) R1=9
D) R1=6
Schools had the same median SAT score.
What would be the value of R1 that would be used in finding H ?
A) R1=54
B) R1=52
C) R1=9
D) R1=6
Unlock Deck
Unlock for access to all 60 flashcards in this deck.
Unlock Deck
k this deck
53
In a study of the effectiveness of physical exercise in weight reduction, 12 subjects followed a program of physical exercise for two months. Their weights (in pounds)before and after this program are shown in the table. Use Wilcoxon's signed -ranks test and a significance level of
0)05 to test the claim that the exercise program has no effect on weight.
What would be the signed rank for the column with values of 175 and 168 ?
A) 8
B) 9
C) 10
D) 8.5
0)05 to test the claim that the exercise program has no effect on weight.
What would be the signed rank for the column with values of 175 and 168 ?
A) 8
B) 9
C) 10
D) 8.5
Unlock Deck
Unlock for access to all 60 flashcards in this deck.
Unlock Deck
k this deck
54
Four different judges each rank the quality of 20 different singers. What method can be used for agreement among the four judges?
A) Kruskal-Wallis Test
B) Wilcoxon rank-sum test
C) Runs Test
D) Rank correlation
A) Kruskal-Wallis Test
B) Wilcoxon rank-sum test
C) Runs Test
D) Rank correlation
Unlock Deck
Unlock for access to all 60 flashcards in this deck.
Unlock Deck
k this deck
55
Match the parametric test with its related nonparametric test. Analysis of variance (F test)
A) rank correlation test
B) Wilcoxon rank-sum test
C) Kruskal-Wallis test
D) sign test
A) rank correlation test
B) Wilcoxon rank-sum test
C) Kruskal-Wallis test
D) sign test
Unlock Deck
Unlock for access to all 60 flashcards in this deck.
Unlock Deck
k this deck
56
Which of the following distribution-free tests has the lowest efficiency rating compared to its parametric counterpart?
A) Kruskal-Wallis test
B) Wilcoxon rank-sum test
C) Wilcoxon signed-ranks test
D) rank correlation test
A) Kruskal-Wallis test
B) Wilcoxon rank-sum test
C) Wilcoxon signed-ranks test
D) rank correlation test
Unlock Deck
Unlock for access to all 60 flashcards in this deck.
Unlock Deck
k this deck
57
Use the runs test to determine whether the given sequence is random. Use a significance level of 0.05 . The outcomes (odd number or even number) of a roulette wheel are shown below. Test for randomness of odd (O) and even (E) numbers. Use a significance level of 0.05 .
What is the value of G , the number of runs?
A) 10
B) 14
C) 17
D) 18
What is the value of G , the number of runs?
A) 10
B) 14
C) 17
D) 18
Unlock Deck
Unlock for access to all 60 flashcards in this deck.
Unlock Deck
k this deck
58
Match the nonparametric test with its related parametric test.
Runs test
A) t test
B) ANOVA
C) Linear correlation
D) There is no related parametric test.
Runs test
A) t test
B) ANOVA
C) Linear correlation
D) There is no related parametric test.
Unlock Deck
Unlock for access to all 60 flashcards in this deck.
Unlock Deck
k this deck
59
Do parametric or nonparametric tests have higher efficiency ratings?
A) Parametric
B) Nonparamtric
A) Parametric
B) Nonparamtric
Unlock Deck
Unlock for access to all 60 flashcards in this deck.
Unlock Deck
k this deck
60
Use the sign test to test the indicated claim. A researcher wishes to test whether a particular diet has an effect on blood pressure. The blood pressure of 24 randomly selected adults is measured. After one month on the diet, each person's blood pressure is again measured. For
18 people, the second blood pressure reading was lower than the first, and for 6 people, the
Second blood pressure reading was higher than the first. At the 0.01 significance level, test the
Claim that the diet has an effect on blood pressure. What would be the value of the test
Statistic, x?
A) 19
B) 6
C) 13
D) 5
Unlock Deck
Unlock for access to all 60 flashcards in this deck.
Unlock Deck
k this deck
Unlock Deck
Unlock for access to all 60 flashcards in this deck.


