Exam 13: Nonparametric Tests
Exam 1: Introduction to Statistics60 Questions
Exam 2: Exploring Data With Tables and Graphs60 Questions
Exam 3: Describing, Exploring, and Comparing Data60 Questions
Exam 4: Probability60 Questions
Exam 5: Discrete Probability Distributions60 Questions
Exam 6: Normal Probability Distributions60 Questions
Exam 7: Estimating Parameters and Determining Sample Sizes60 Questions
Exam 8: Hypothesis Testing60 Questions
Exam 9: Inferences From Two Samples60 Questions
Exam 10: Correlation and Regression60 Questions
Exam 11: Goodness-Of-Fit and Contingency Tables60 Questions
Exam 12: Analysis of Variance59 Questions
Exam 13: Nonparametric Tests60 Questions
Exam 14: Statistical Process Control60 Questions
Select questions type
Find the critical value. Assume that the test is two-tailed and that n denotes the number of pairs of data.
n=30, = 0.05
Free
(Multiple Choice)
4.8/5  (41)
(41)
Correct Answer: Verified
D
Explain what an efficiency rating is. You may use an example to explain this concept. Do comparable parametric or nonparametric tests have higher efficiency ratings?
Free
(Essay)
4.9/5 (36)
Correct Answer:Verified
Higher efficiency ratings have the effect that "significant" results typically require smaller samples. For example if
test A has an efficiency rating of 0.93 as compared to test B, that means that test A requires 100 sample
observations as compared to 93 sample observations for test B. Parametric tests have higher efficiency ratings.
Four different judges each rank the quality of 20 different singers. What method can be used for agreement among the four judges?
Free
(Multiple Choice)
4.9/5 (33)
Correct Answer:Verified
A
Use the sign test to test the indicated claim. A researcher wishes to test whether a particular diet has an effect on blood pressure. The blood pressure of 24 randomly selected adults is measured. After one month on the diet, each person's blood pressure is again measured. For
18 people, the second blood pressure reading was lower than the first, and for 6 people, the
Second blood pressure reading was higher than the first. At the 0.01 significance level, test the
Claim that the diet has an effect on blood pressure. What would be the value of the test
Statistic, x?
(Multiple Choice)
4.9/5 (38)
Provide the appropriate response. Describe the Wilcoxon signed-ranks test. What types of hypotheses is it used to test? What assumptions are made for this test?
(Essay)
4.8/5 (35)
Give at least two examples of nonparametric tests and their comparable parametric tests
(Essay)
4.9/5 (22)
Use the rank correlation coefficient to test for a correlation between the two variables. Use the sample data below to find the rank correlation coefficient and test the claim of correlation
between math and verbal scores. Use a significance level of 0.05. Mathematics 347 440 327 456 427 349 377 398 425 Verbal 285 378 243 371 340 271 294 322 385
(Essay)
4.9/5 (38)
If the critical values for a run test (found from table A-10)are 8 and 19 and the G value is 17, what should your conclusion about randomness be?
(Multiple Choice)
4.7/5 (34)
Use the rank correlation coefficient to test for a correlation between the two variables. Ten trucks were ranked according to their comfort levels and their prices.
Make Comfort Price A 1 6 B 6 2 C 2 3 D 8 1 E 4 4 F 7 8 G 9 10 H 10 9 I 3 5 J 5 7
Find the rank correlation coefficient and test the claim of correlation between comfort and price. Use a significance level of 0.05 .
(Essay)
5.0/5 (30)
Describe the sign test. What types of hypotheses is it used to test? What is the underlying concept?
(Essay)
4.9/5 (21)
A rank correlation coefficient is to be calculated for a collection of paired data. lie between -10 and 10. Which of the following could affect the value of the rank correlation coefficient?
I: Multiplying every value of one variable by 3
II: Interchanging the two variables
III: Adding 2 to each value of one variable
IV: Replacing every value of one variable by its absolute value
(Multiple Choice)
4.9/5 (31)
The following scatterpolt shows the percentage of the vote a candidate received in the 2004 senatoral elections according to the voter's income level based on an exit poll of the voters conducted bu CNN. The income levels 1-8 correspond to the followng income classes: 1=under $15,00; 2=$15-30,000; 3=$30-50,000; 4=$50=75,000; 5=$75-100,000; 6=$100-150,000; 7=$150=200,000; 8=$200,000 or more.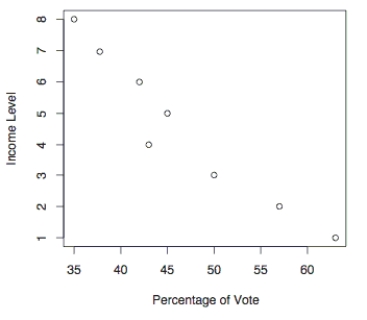 Use the election scatterplot to the find the critical values corresponding to a 0.01 significance level used to test the null hypothesis of Ps=0 .
(Multiple Choice)
4.8/5 (33)
Use the sign test to test the indicated claim. The waiting times (in minutes)of 28 randomly selected customers in a bank are given below. Use a significance level of 0.05 to test the claim that the population median is equal to 5.3 minutes. 8.2 8.0 10.5 3.8 6.4 5.3 7.8 2.9 6.0 7.7 6.1 5.9 1.2 10.4 7.3 6.9 5.8 5.1 6.2 3.1 5.8 11.7 4.5 6.5 9.8 7.4 2.3 7.8
(Essay)
4.9/5 (38)
Find the ranks corresponding to the ages of five statistics professors when they were hired: 47, 51, 47, 47, 48
(Multiple Choice)
4.7/5 (32)
Use the Wilcoxon rank-sum approach to test the claim that the two independent sample student grade averages at two colleges come from populations with equal medians. The sample data is listed below. Use a 0.05 level of significance, and assume that the samples were randomly selected.
College A 3.2 4.0 2.4 2.6 2.0 1.8 1.3 0.0 0.5 1.4 2.9 College B 2.4 1.9 0.3 0.8 2.8 3.0 3.1 3.1 3.1 3.5 3.5
(Essay)
4.8/5 (33)
The following scatterpolt shows the percentage of the vote a candidate received in the 2004 senatoral elections according to the voter's income level based on an exit poll of the voters conducted bu CNN. The income levels 1-8 correspond to the followng income classes: 1=under $15,00; 2=$15-30,000; 3=$30-50,000; 4=$50=75,000; 5=$75-100,000; 6=$100-150,000; 7=$150=200,000; 8=$200,000 or more.
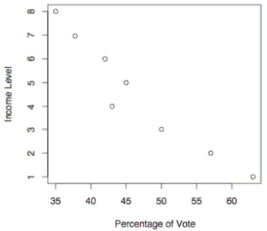 Use the election scatterplot to determine whether there is a correlation between percentage of vote and income level at the 0.01 significance level with a null hypothesis of Pz=0 .
(Multiple Choice)
4.8/5 (29)
When applying the runs test for randomness above and below the median for 12 dollar/Euro exchange rate highs, the test statistic is G = 2. What does that value tell us about the data?
(Essay)
4.9/5 (45)
If test A has an efficiency rating of 0.94 as compared to test B, explain what that efficiency rating means. Do comparable nonparametric or parametric tests have higher efficiency
ratings?
(Essay)
4.8/5 (38)
Which statement is false about the Wilcoxon signed-ranks test?
(Multiple Choice)
4.9/5 (35)
Describe the sign test. What types of hypotheses is it used to test? What is the underlying concept?
(Essay)
4.9/5 (38)
Filters
- Essay(0)
- Multiple Choice(0)
- Short Answer(0)
- True False(0)
- Matching(0)