Deck 9: Inferences From Two Samples
Full screen (f)
Question
Question
Question
Question
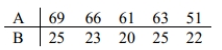
The two data sets are dependent. Find  to the nearest tenth.
A) 50.7
B) 23.4
C) 48.8
D) 39.0
to the nearest tenth.A) 50.7
B) 23.4
C) 48.8
D) 39.0
Question
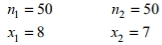
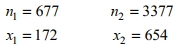
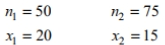
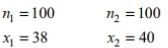
Construct the indicated confidence interval for the difference between the two population means. Assume that the two samples are independent simple random samples selected from normally distributed populations. Do not assume that the population standard deviations are equal. Independent samples from two different populations yield the following data.

The sample size is 478 for both samples. Find the 85% confidence interval for
A)
B)
C)
D)
The sample size is 478 for both samples. Find the 85% confidence interval for
A)
B)
C)
D)
Question
Determine the decision criterion for rejecting the null hypothesis in the given hypothesis test; i.e., describe the values of the test statistic that would result in rejection of the null hypothesis. We wish to compare the means of two populations using paired observations. Suppose that 
and n=8 , and that you wish to test the following hypothesis at the
10 % level of significance:
What decision rule would you use?
A) Reject if the test statistic is less than 1.415 .
B) Reject if the test statistic is greater than -1.145 .
C) Reject if the test statistic is greater than -1.145 or less than 1.415 .
D) Reject if the test statistic is greater than 1.415 .
and n=8 , and that you wish to test the following hypothesis at the
10 % level of significance:
What decision rule would you use?
A) Reject
if the test statistic is less than 1.415 . B) Reject
if the test statistic is greater than -1.145 . C) Reject
if the test statistic is greater than -1.145 or less than 1.415 .D) Reject
if the test statistic is greater than 1.415 . Question
Express the alternative hypothesis in symbolic form. A professor claims that the mean amount of time (in hours) sophomores spent studying for the statistics final exam is more than that of freshmen. Assume that the two samples are independent. Let the freshmen be the first population and the sophomores be the second population.
A)
B)
C)
D)
A)
B)
C)
D)
Question
Assume that the following confidence interval for the difference in the mean length of male (sample 1) and female babies (sample 2) at birth was constructed using independent simple random samples.  What does the confidence interval suggest about the difference in length between male babies and female babies?
A) Male babies are longer.
B) Female babies are longer.
C) There is no difference in the length between male and female babies.
What does the confidence interval suggest about the difference in length between male babies and female babies?A) Male babies are longer.
B) Female babies are longer.
C) There is no difference in the length between male and female babies.
Question
Assume that you plan to use a significance level of  to test the claim that
  Use the given sample sizes and numbers of successes to find the pooled estimate
  Round your answer to the nearest thousandth.
A) 0.479
B) 0.435
C) 0.305
D) 0.392
to test the claim that Use the given sample sizes and numbers of successes to find the pooled estimate Round your answer to the nearest thousandth.A) 0.479
B) 0.435
C) 0.305
D) 0.392
Question
Determine the decision criterion for rejecting the null hypothesis in the given hypothesis test; i.e., describe the values of the test statistic that would result in rejection of the null hypothesis. Suppose you wish to test the claim that  the mean value of the differences d for a population of paired data, is greater than 0 . Given a sample of n=15 and a significance level of
  what criterion would be used for rejecting the null hypothesis?
A) Reject null hypothesis if test statistic <2.624 .
B) Reject null hypothesis if test statistic >2.602 .
C) Reject null hypothesis if test statistic >2.624 .
D) Reject null hypothesis if test statistic >2.977 or <-2.977 .
the mean value of the differences d for a population of paired data, is greater than 0 . Given a sample of n=15 and a significance level of what criterion would be used for rejecting the null hypothesis?A) Reject null hypothesis if test statistic <2.624 .
B) Reject null hypothesis if test statistic >2.602 .
C) Reject null hypothesis if test statistic >2.624 .
D) Reject null hypothesis if test statistic >2.977 or <-2.977 .
Question
A) Normal
B) t
C) chi-square
D) F
Question
If the heights of male college basketball players and female basketball players are used to construct a 95% confidence interval for the difference between the two population means, the result is 15.35 cm 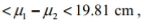
where heights of male players correspond to population 1 and heights of female players correspond to population 2. Express the confidence interval with heights of female basketball players being population 1 and heights of male basketball players being population 2 .
A)
B)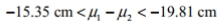
C)
D) This cannot be determined without having the original data values.
Question
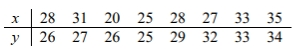
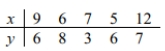
Find  The differences between two sets of dependent data are 0.4,0.24,0.22,0.26,0.34 . Round to the nearest hundredth.
A) 0.08
B) 0.12
C) 0.04
D) 0.24
The differences between two sets of dependent data are 0.4,0.24,0.22,0.26,0.34 . Round to the nearest hundredth.A) 0.08
B) 0.12
C) 0.04
D) 0.24
Question
Assume that you want to test the claim that the paired sample data come from a population for which the mean difference is  Compute the value of the t test statistic. Round intermediate calculations to four decimal places as needed and final answers to three decimal places as needed.
A) t=-1.480
B) t=-1.185
C) t=-0.523
D) t=0.690
Compute the value of the t test statistic. Round intermediate calculations to four decimal places as needed and final answers to three decimal places as needed.A) t=-1.480
B) t=-1.185
C) t=-0.523
D) t=0.690
Question
Assume that you plan to use a significance level of  to the claim that
  Use the given sample sizes and numbers of successes to find the P -value for the hypothesis test.
A) 0.7794
B) 0.3897
C) 0.6103
D) 0.2206
to the claim that Use the given sample sizes and numbers of successes to find the P -value for the hypothesis test.A) 0.7794
B) 0.3897
C) 0.6103
D) 0.2206
Question
When performing a hypothesis test for the ratio of two population variances, the upper critical F value is denoted  The lower critical F value,
  can be found as follows: interchange the degrees of freedom, and then take the reciprocal of the resulting F value found in Table A-5.
  can be denoted
  and
and  can be denoted
Find the critical values and
and  for a two-tailed hypothesis test based on the following values:
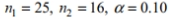
A) 0.7351,2.2378
B) 0.5327,2.2878
C) 0.4745,2.2878
D) 0.4745,2.4371
The lower critical F value, can be found as follows: interchange the degrees of freedom, and then take the reciprocal of the resulting F value found in Table A-5. can be denoted and can be denoted Find the critical values
and for a two-tailed hypothesis test based on the following values: A) 0.7351,2.2378
B) 0.5327,2.2878
C) 0.4745,2.2878
D) 0.4745,2.4371
Question
Find  Consider the set of differences between two dependent sets: 84,85,83,63,61,100,98 . Round to the nearest tenth.
A) 15.3
B) 16.2
C) 15.7
D) 13.1
Consider the set of differences between two dependent sets: 84,85,83,63,61,100,98 . Round to the nearest tenth.A) 15.3
B) 16.2
C) 15.7
D) 13.1
Question
Assume that you plan to use a significance level of  to test the claim that
  Use the given sample sizes and numbers of successes to find the pooled estimate
  Round your answer to the nearest thousandth.
A) 0.163
B) 0.452
C) 0.204
D) 0.408
to test the claim that Use the given sample sizes and numbers of successes to find the pooled estimate Round your answer to the nearest thousandth.A) 0.163
B) 0.452
C) 0.204
D) 0.408
Question
Question
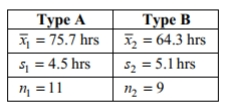
Construct the indicated confidence interval for the difference between the two population means. Assume that the two samples are independent simple random samples selected from normally distributed populations. Do not assume that the population standard deviations are equal. A paint manufacturer wished to compare the drying times of two different types of paint. Independent simple random samples of 11 cans of type A and 9 cans of type B were selected and applied to similar surfaces. The drying times, in hours, were recorded. The summary statistics are as follows.
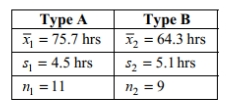
Construct a 98% confidence interval for the difference between the mean drying time for paint of type A and the mean drying time for paint of type B.
A)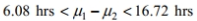
B)
C)
D)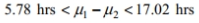
Construct a 98% confidence interval for
the difference between the mean drying time for paint of type A and the mean drying time for paint of type B.A)
B)
C)
D)
Question
Construct a confidence interval for  the mean of the differences d for the population of paired data. Assume that the population of paired differences is normally distributed. Using the sample paired data below, construct a 90% confidence interval for the population mean of all differences.
A)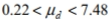
B)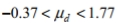
C)
D)
the mean of the differences d for the population of paired data. Assume that the population of paired differences is normally distributed. Using the sample paired data below, construct a 90% confidence interval for the population mean of all differences.A)
B)
C)
D)
Question
Question
Construct the indicated confidence interval for the difference between the two population means. Assume that the two samples are independent simple random samples selected from normally distributed populations. Also assume that the population standard deviations are equal  , so that the standard error of the difference between means is obtained by pooling the sample variances. A paint manufacturer wanted to compare the drying times of two different types of paint. Independent simple random samples of 11 cans of type A and 9 cans of type B were selected and applied to similar surfaces. The drying times, in hours, were recorded. The summary statistics are as follows
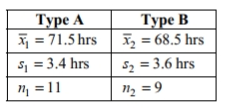
Construct a 99 % confidence interval for the difference between the mean drying time for paint type A and the mean drying time for paint type B.
A)
B)
C)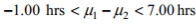
D)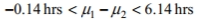
, so that the standard error of the difference between means is obtained by pooling the sample variances. A paint manufacturer wanted to compare the drying times of two different types of paint. Independent simple random samples of 11 cans of type A and 9 cans of type B were selected and applied to similar surfaces. The drying times, in hours, were recorded. The summary statistics are as followsConstruct a 99 % confidence interval for
the difference between the mean drying time for paint type A and the mean drying time for paint type B.A)
B)
C)
D)
Question
When performing a hypothesis test for the ratio of two population variances, the upper critical F value is denoted  The lower critical F value,
  can be found as follows: interchange the degrees of freedom, and then take the reciprocal of the resulting F value found in Table A-5.
  can be denoted
  and
and  can be denoted
Find the critical values and
and  for a two-tailed hypothesis test based on the following values:
A) 0.2150,5.5996
B) 0.2150,4.8232
C) 0.3931,4.1468
D) 0.2411,4.1468
The lower critical F value, can be found as follows: interchange the degrees of freedom, and then take the reciprocal of the resulting F value found in Table A-5. can be denoted and can be denoted Find the critical values
and for a two-tailed hypothesis test based on the following values: A) 0.2150,5.5996
B) 0.2150,4.8232
C) 0.3931,4.1468
D) 0.2411,4.1468
Question
Assume that you want to test the claim that the paired sample data come from a population for which the mean difference is  Compute the value of the t test statistics. Round intermediate calculations to four decimal places as needed and final answers to three decimal places as needed.
A) t=0.578
B) t=2.890
C) t=1.292
D) t=0.415
Compute the value of the t test statistics. Round intermediate calculations to four decimal places as needed and final answers to three decimal places as needed.A) t=0.578
B) t=2.890
C) t=1.292
D) t=0.415
Question
Express the alternative hypothesis in symbolic form. An automobile technician claims that the mean amount of time (in hours) per domestic car repair is more than that of foreign cars. Assume that two samples are independent. Let the domestic car repair times be the first population and the foreign car repair times be the second population.
A)
B)
C)
D)
A)
B)
C)
D)
Question
Question
In the context of a hypothesis test for two proportions, which of the following statements about the pooled sample proportion,  is/are true?
I. It estimates the common value of text and
and  under the assumption of equal proportions.
II. It is obtained by averaging the two sample proportions and
and 
III. It is equal to the proportion of successes in both samples combined.
A) I and II
B) III only
C) I, II, and III
D) I and III
is/are true?I. It estimates the common value of text
and under the assumption of equal proportions.II. It is obtained by averaging the two sample proportions
and III. It is equal to the proportion of successes in both samples combined.
A) I and II
B) III only
C) I, II, and III
D) I and III
Question
Assume that you plan to use a significance level of  to test the claim that
  Use the given sample sizes and numbers of successes to find the P -value for the hypothesis test.
A) 0.1201
B) 0.0032
C) 0.0001
D) 0.0146
to test the claim that Use the given sample sizes and numbers of successes to find the P -value for the hypothesis test.A) 0.1201
B) 0.0032
C) 0.0001
D) 0.0146
Question
Question
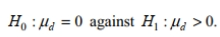
Assume that the following confidence interval for the difference in the mean time (in minutes) for male students to complete a statistics test (sample 1 ) and the mean time for female students to complete a statistics test (sample 2) was constructed using independent simple random samples. -0.2 minutes  minutes What does the confidence interval suggest about the difference in length between male and female test completion times?
A) Male students take longer to complete a statistics test.
B) Female students take longer to complete a statistics test.
C) There is no difference in the length of time for statistics test completion between male and female students.
minutes What does the confidence interval suggest about the difference in length between male and female test completion times?A) Male students take longer to complete a statistics test.
B) Female students take longer to complete a statistics test.
C) There is no difference in the length of time for statistics test completion between male and female students.
Question
Assume that you want to test the claim that the paired sample data come from a population for which the mean difference is 
Compute the value of the t test statistic. Round intermediate calculations to four decimal places as needed and final answers to three decimal places as needed.
A) 9.468
B) 3.156
C) 0.351
D) 1.052
Compute the value of the t test statistic. Round intermediate calculations to four decimal places as needed and final answers to three decimal places as needed.
A) 9.468
B) 3.156
C) 0.351
D) 1.052
Question
Construct the indicated confidence interval for the difference between the two population means. Assume that the two samples are independent simple random samples selected from normally distributed populations. Do not assume that the population standard deviations are equal. A paint manufacturer wished to compare the drying times of two different types of paint .Independent simple random samples of 11 cans of type A and 9 cans of type B were selected and applied to similar surfaces. The drying times, in hours, were recorded. The summary statistics are as follows.
Construct a 99 % confidence interval for the difference between the mean drying time for paint type A and the mean drying time for paint type B.
A)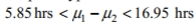
B)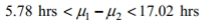
C)
D)
Construct a 99 % confidence interval for
the difference between the mean drying time for paint type A and the mean drying time for paint type B.A)
B)
C)
D)
Question
Assume that you plan to use a significance level of  to test the claim that
  Use the given sample sizes and numbers of successes to find the P -value for the hypothesis test.
A) 0.1610
B) 0.2130
C) 0.0412
D) 0.7718
to test the claim that Use the given sample sizes and numbers of successes to find the P -value for the hypothesis test.A) 0.1610
B) 0.2130
C) 0.0412
D) 0.7718
Question
Question
If the lengths of male skis and female skis are used to construct a 95% confidence interval for the difference between the two population means, the result is
14.32 cm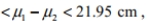
where lengths of male skis correspond to population 1 and engths of female skis correspond to population 2. Express the confidence interval with the engths of female skis being population 1 and lengths of male skis being population
A)
B)
C)
D) This cannot be determined without having the original data values.
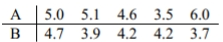
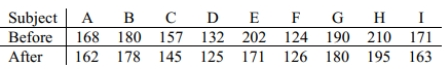
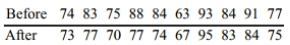
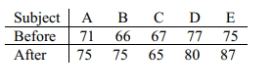
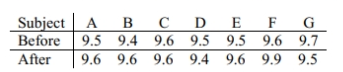
Question
A test of abstract reasoning is given to a random sample of students before and after they completed a formal logic course. The results are given below. Construct a 95% confidence interval for the mean difference between the before and after scores.
A)
B)
C)
D)
A)
B)
C)
D)
Question
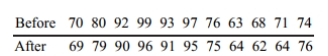
Construct a confidence interval for  , the mean of the differences
  for the population of paired data. Assume that the population of paired differences is normally distributed. A test of writing ability is given to a random sample of students before and after they completed a formal writing course. The results are given below. Construct a 99% confidence interval for the mean difference between the before and after scores.
A)
B)
C)
D)
, the mean of the differences for the population of paired data. Assume that the population of paired differences is normally distributed. A test of writing ability is given to a random sample of students before and after they completed a formal writing course. The results are given below. Construct a 99% confidence interval for the mean difference between the before and after scores. A)
B)
C)
D)
Question
Question
A paint manufacturer made a modification to a paint to speed up its drying time. Independent simple random samples of 11 cans of type A (the original paint)and 9 cans of type B (the modified paint)were selected and applied to similar surfaces. The drying times, in hours, were
Recorded. The summary statistics are as follows.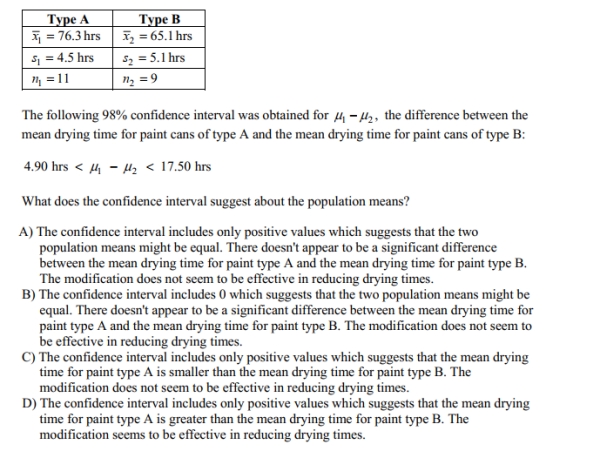
Recorded. The summary statistics are as follows.
Question
Question
Question
Question
Question
Test the indicated claim about the means of two populations. Assume that the two samples are independent simple random samples selected from normally distributed populations. Do not assume that the population standard deviations are equal.
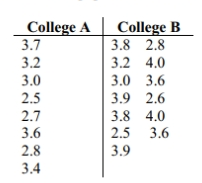
Use a 0.10 significance level to test the claim that the mean GPA of students at college A is different from the mean GPA of students at college B.
(Note:
Include your null and alternative hypotheses, the test statistic, p -value or critical value(s), conclusion about the null hypothesis, and conclusion about the claim in your answer.
Question
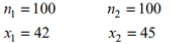
In a random sample of 300 women, 45% favored stricter DUI legislation. In a random sample of 200 men, 25% favored stricter DUI legislation. Construct a 95% confidence interval for the difference between the population proportions  . Assume that the samples are independent and that they have been randomly selected.
. Assume that the samples are independent and that they have been randomly selected. Question
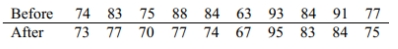
Test the given claim about the means of two populations. Assume that two dependent samples have been randomly selected from normally distributed populations. A test of abstract reasoning is given to a random sample of students before and after they completed a formal logic course. The results are given below. At the 0.05 significance level, test the claim that the mean score is not affected by the course. Include your null and alternative hypotheses, the test statistic, P -value or critical value(s), conclusion about the null hypothesis, and conclusion about the claim in your answer.
Question
Question
To test the null hypothesis that the difference between two population proportions is equal to a nonzero constant c , use the test statistic
As long as and
and  are both large, the sampling distribution of the test statistic
  will be approximately the standard normal distribution. Given the sample data below, test the claim that the proportion of male voters who plan to vote Republican at the next presidential election is 15 percentage points more than the percentage of female voters who plan to vote Republican. Use the P -value method of hypothesis testing and use a significance level of 0.10 .
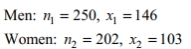
As long as
and are both large, the sampling distribution of the test statistic will be approximately the standard normal distribution. Given the sample data below, test the claim that the proportion of male voters who plan to vote Republican at the next presidential election is 15 percentage points more than the percentage of female voters who plan to vote Republican. Use the P -value method of hypothesis testing and use a significance level of 0.10 . Question
Test the indicated claim about the means of two populations. Assume that the two samples are independent simple random samples selected from normally distributed populations. Do not assume that the population standard deviations are equal.
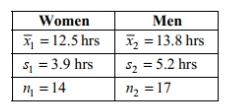
Use a 0.05 significance level to test the claim that the mean amount of time spent watching television by women is smaller than the mean amount of time spent watching television by men. Include your null and alternative hypotheses, the test statistic, P -value or critical value(s), conclusion about the null hypothesis, and conclusion about the claim in your answer.
Use a 0.05 significance level to test the claim that the mean amount of time spent watching television by women is smaller than the mean amount of time spent watching television by men. Include your null and alternative hypotheses, the test statistic, P -value or critical value(s), conclusion about the null hypothesis, and conclusion about the claim in your answer.
Question
A random sample of 10 employees of an engineering company was selected. Each employee was asked to report the number of sick days he/she claimed on Wednesdays and Fridays of the previous calendar year. Use this information to test the employer's claim that more employees call in sick on Fridays than on Wednesdays. Use  Assume that the differences between Wednesday's and Friday's sick day counts is normally distributed.
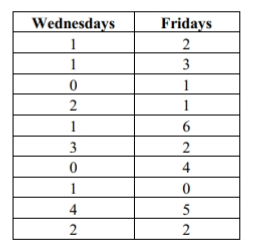
Include your null and alternative hypotheses, the test statistic, P -value or critical value(s), conclusion about the null hypothesis, and conclusion about the claim in your answer.
Assume that the differences between Wednesday's and Friday's sick day counts is normally distributed.Include your null and alternative hypotheses, the test statistic, P -value or critical value(s), conclusion about the null hypothesis, and conclusion about the claim in your answer.
Question
Test the given claim about the means of two populations. Assume that two dependent samples have been randomly selected from normally distributed populations.
Using a 0.01 level of significance, test the claim that the tutoring has an effect on the math scores. Include your null and alternative hypotheses, the test statistic, P -value or critical value(s), conclusion about the null hypothesis, and conclusion about the claim in your answer.
Using a 0.01 level of significance, test the claim that the tutoring has an effect on the math scores. Include your null and alternative hypotheses, the test statistic, P -value or critical value(s), conclusion about the null hypothesis, and conclusion about the claim in your answer.
Question
Assume that the two samples are independent simple random samples selected from normally distributed populations. Do not assume that the population standard deviations are equal. A researcher wishes to determine whether people can reduce their resting heart rate by following a particular diet. Construct a 95% confidence interval estimate for the following data. Does the confidence interval support that the mean resting heart rate for those on the diet is lower than that of those not on the diet? Explain your reasoning.
Question
Brian wants to obtain a confidence interval estimate of  where
where  represents the proportion of American women who smoke and
  represents the proportion of American men who smoke. He randomly selects 100 married couples. Among the 100 women in the sample are 21 smokers. Among the 100 men are 29 smokers. Are the requirements for obtaining a confidence interval estimate of
  satisfied? If not, which requirement is not satisfied?
where represents the proportion of American women who smoke and represents the proportion of American men who smoke. He randomly selects 100 married couples. Among the 100 women in the sample are 21 smokers. Among the 100 men are 29 smokers. Are the requirements for obtaining a confidence interval estimate of satisfied? If not, which requirement is not satisfied? Question
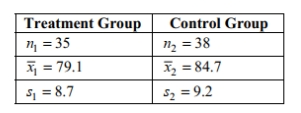
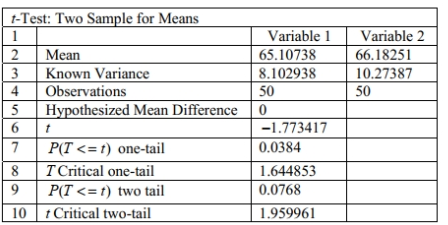
When testing for a difference between the means of a treatment group and a placebo group, the computer display below is obtained. Using a 0.05 significance level, is there sufficient evidence to support the claim that the treatment group (variable 1) comes from a population with a mean that is less than the mean for the placebo population? Explain.
Question
Question
A Dean of Students conducted a survey to test the claim that women spend more time visiting the STEM lab than men do. A survey was administered to a simple random sample of 15 female student volunteers and 12 male volunteers that asked, "How many minutes have you spent in the STEM lab this semester?" The results are shown below.
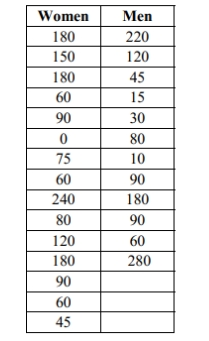
Test the claim at the 1 % level of significance. Assume that the number of minutes that women and men spent in the STEM lab is normally distributed. Do not assume that the population standard deviations are equal. Include your null and alternative hypotheses, the test statistic, P -value or critical value(s), conclusion about the null hypothesis, and conclusion about the claim in your answer.
Test the claim at the 1 % level of significance. Assume that the number of minutes that women and men spent in the STEM lab is normally distributed. Do not assume that the population standard deviations are equal. Include your null and alternative hypotheses, the test statistic, P -value or critical value(s), conclusion about the null hypothesis, and conclusion about the claim in your answer.
Question
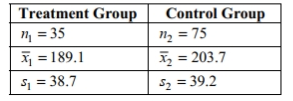
Test the indicated claim about the means of two populations. Assume that the two samples are independent simple random samples selected from normally distributed populations. Do not assume that the population standard deviations are equal. A researcher wishes to determine whether people with high blood pressure can reduce their blood pressure, measured in mm hG, by following a particular diet. Use a significance level of 0.01 to test the claim that the treatment group is from a population with a smaller mean than the control group. Include your null and alternative hypotheses, the test statistic, P -value or critical value(s), conclusion about the null hypothesis, and conclusion about the claim in your answer.
Question
Test the given claim about the means of two populations. Assume that two dependent samples have been randomly selected from normally distributed populations. A coach uses a new technique to train gymnasts. 7 gymnasts were randomly selected and their competition scores were recorded before and after the training. The results are shown below.
Using a 0.01 level of significance, test the claim that the training technique is effective in raising the gymnasts' scores. Include your null and alternative hypotheses, the test statistic, P -value or critical value(s), conclusion about the null hypothesis, and conclusion about the claim in your answer.
Using a 0.01 level of significance, test the claim that the training technique is effective in raising the gymnasts' scores. Include your null and alternative hypotheses, the test statistic, P -value or critical value(s), conclusion about the null hypothesis, and conclusion about the claim in your answer.
Question
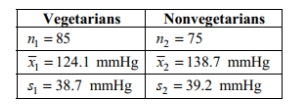
A researcher wishes to determine whether the blood pressure of vegetarians is, on average, lower than the blood pressure of nonvegetarians. Independent simple random samples of 85 vegetarians and 75 nonvegetarians yielded the following sample statistics for systolic blood pressure:
Use a significance level of 0.01 to test the claim that the mean systolic blood pressure of vegetarians is lower than the mean systolic blood pressure of nonvegetarians. Include your null and alternative hypotheses, the test statistic, P -value or critical value(s), conclusion about the null hypothesis, and conclusion about the claim in your answer.
Use a significance level of 0.01 to test the claim that the mean systolic blood pressure of vegetarians is lower than the mean systolic blood pressure of nonvegetarians. Include your null and alternative hypotheses, the test statistic, P -value or critical value(s), conclusion about the null hypothesis, and conclusion about the claim in your answer.

Unlock Deck
Sign up to unlock the cards in this deck!
Unlock Deck
Unlock Deck
1/60
Play
Full screen (f)
Deck 9: Inferences From Two Samples
1
Which distribution is used to test the claim that the standard deviation of the ages (in years)of when girls first learn to ride a bike is equal to the standard deviation of the ages (in years) when boys first lean to ride a bike?
A) Normal
B) t
C) chi-square
D) F
A) Normal
B) t
C) chi-square
D) F
D
2
Determine whether the following statement regarding the hypothesis test for two population proportions is true or false: However small the difference between two population proportions, for sufficiently large
Sample sizes, the null hypothesis of equal population proportions is likely to be rejected.
A) True
B) False
Sample sizes, the null hypothesis of equal population proportions is likely to be rejected.
A) True
B) False
A
3
Assume that two samples are independent simple random samples selected from normally distributed populations, and do not assume that the population standard deviations are equal. Which distribution is used to test the claim that women have a higher mean resting heart rate
Than men?
Than men?
B
4
The two data sets are dependent. Find to the nearest tenth.
A) 50.7
B) 23.4
C) 48.8
D) 39.0
to the nearest tenth.A) 50.7
B) 23.4
C) 48.8
D) 39.0
Unlock Deck
Unlock for access to all 60 flashcards in this deck.
Unlock Deck
k this deck
5
Construct the indicated confidence interval for the difference between the two population means. Assume that the two samples are independent simple random samples selected from normally distributed populations. Do not assume that the population standard deviations are equal. Independent samples from two different populations yield the following data.
The sample size is 478 for both samples. Find the 85% confidence interval for
A)
B)
C)
D)
The sample size is 478 for both samples. Find the 85% confidence interval for
A)
B)
C)
D)
Unlock Deck
Unlock for access to all 60 flashcards in this deck.
Unlock Deck
k this deck
6
Determine the decision criterion for rejecting the null hypothesis in the given hypothesis test; i.e., describe the values of the test statistic that would result in rejection of the null hypothesis. We wish to compare the means of two populations using paired observations. Suppose that
and n=8 , and that you wish to test the following hypothesis at the
10 % level of significance:
What decision rule would you use?
A) Reject if the test statistic is less than 1.415 .
B) Reject if the test statistic is greater than -1.145 .
C) Reject if the test statistic is greater than -1.145 or less than 1.415 .
D) Reject if the test statistic is greater than 1.415 .
and n=8 , and that you wish to test the following hypothesis at the
10 % level of significance:
What decision rule would you use?
A) Reject
if the test statistic is less than 1.415 . B) Reject
if the test statistic is greater than -1.145 . C) Reject
if the test statistic is greater than -1.145 or less than 1.415 .D) Reject
if the test statistic is greater than 1.415 . Unlock Deck
Unlock for access to all 60 flashcards in this deck.
Unlock Deck
k this deck
7
Express the alternative hypothesis in symbolic form. A professor claims that the mean amount of time (in hours) sophomores spent studying for the statistics final exam is more than that of freshmen. Assume that the two samples are independent. Let the freshmen be the first population and the sophomores be the second population.
A)
B)
C)
D)
A)
B)
C)
D)
Unlock Deck
Unlock for access to all 60 flashcards in this deck.
Unlock Deck
k this deck
8
Assume that the following confidence interval for the difference in the mean length of male (sample 1) and female babies (sample 2) at birth was constructed using independent simple random samples. What does the confidence interval suggest about the difference in length between male babies and female babies?
A) Male babies are longer.
B) Female babies are longer.
C) There is no difference in the length between male and female babies.
What does the confidence interval suggest about the difference in length between male babies and female babies?A) Male babies are longer.
B) Female babies are longer.
C) There is no difference in the length between male and female babies.
Unlock Deck
Unlock for access to all 60 flashcards in this deck.
Unlock Deck
k this deck
9
Assume that you plan to use a significance level of to test the claim that Use the given sample sizes and numbers of successes to find the pooled estimate Round your answer to the nearest thousandth.
A) 0.479
B) 0.435
C) 0.305
D) 0.392
to test the claim that Use the given sample sizes and numbers of successes to find the pooled estimate Round your answer to the nearest thousandth.A) 0.479
B) 0.435
C) 0.305
D) 0.392
Unlock Deck
Unlock for access to all 60 flashcards in this deck.
Unlock Deck
k this deck
10
Determine the decision criterion for rejecting the null hypothesis in the given hypothesis test; i.e., describe the values of the test statistic that would result in rejection of the null hypothesis. Suppose you wish to test the claim that the mean value of the differences d for a population of paired data, is greater than 0 . Given a sample of n=15 and a significance level of what criterion would be used for rejecting the null hypothesis?
A) Reject null hypothesis if test statistic <2.624 .
B) Reject null hypothesis if test statistic >2.602 .
C) Reject null hypothesis if test statistic >2.624 .
D) Reject null hypothesis if test statistic >2.977 or <-2.977 .
the mean value of the differences d for a population of paired data, is greater than 0 . Given a sample of n=15 and a significance level of what criterion would be used for rejecting the null hypothesis?A) Reject null hypothesis if test statistic <2.624 .
B) Reject null hypothesis if test statistic >2.602 .
C) Reject null hypothesis if test statistic >2.624 .
D) Reject null hypothesis if test statistic >2.977 or <-2.977 .
Unlock Deck
Unlock for access to all 60 flashcards in this deck.
Unlock Deck
k this deck
11
A) Normal
B) t
C) chi-square
D) F
Unlock Deck
Unlock for access to all 60 flashcards in this deck.
Unlock Deck
k this deck
12
If the heights of male college basketball players and female basketball players are used to construct a 95% confidence interval for the difference between the two population means, the result is 15.35 cm
where heights of male players correspond to population 1 and heights of female players correspond to population 2. Express the confidence interval with heights of female basketball players being population 1 and heights of male basketball players being population 2 .
A)
B)
C)
D) This cannot be determined without having the original data values.
Unlock Deck
Unlock for access to all 60 flashcards in this deck.
Unlock Deck
k this deck
13
Find The differences between two sets of dependent data are 0.4,0.24,0.22,0.26,0.34 . Round to the nearest hundredth.
A) 0.08
B) 0.12
C) 0.04
D) 0.24
The differences between two sets of dependent data are 0.4,0.24,0.22,0.26,0.34 . Round to the nearest hundredth.A) 0.08
B) 0.12
C) 0.04
D) 0.24
Unlock Deck
Unlock for access to all 60 flashcards in this deck.
Unlock Deck
k this deck
14
Assume that you want to test the claim that the paired sample data come from a population for which the mean difference is Compute the value of the t test statistic. Round intermediate calculations to four decimal places as needed and final answers to three decimal places as needed.
A) t=-1.480
B) t=-1.185
C) t=-0.523
D) t=0.690
Compute the value of the t test statistic. Round intermediate calculations to four decimal places as needed and final answers to three decimal places as needed.A) t=-1.480
B) t=-1.185
C) t=-0.523
D) t=0.690
Unlock Deck
Unlock for access to all 60 flashcards in this deck.
Unlock Deck
k this deck
15
Assume that you plan to use a significance level of to the claim that Use the given sample sizes and numbers of successes to find the P -value for the hypothesis test.
A) 0.7794
B) 0.3897
C) 0.6103
D) 0.2206
to the claim that Use the given sample sizes and numbers of successes to find the P -value for the hypothesis test.A) 0.7794
B) 0.3897
C) 0.6103
D) 0.2206
Unlock Deck
Unlock for access to all 60 flashcards in this deck.
Unlock Deck
k this deck
16
When performing a hypothesis test for the ratio of two population variances, the upper critical F value is denoted The lower critical F value, can be found as follows: interchange the degrees of freedom, and then take the reciprocal of the resulting F value found in Table A-5. can be denoted and can be denoted
Find the critical values and for a two-tailed hypothesis test based on the following values:
A) 0.7351,2.2378
B) 0.5327,2.2878
C) 0.4745,2.2878
D) 0.4745,2.4371
The lower critical F value, can be found as follows: interchange the degrees of freedom, and then take the reciprocal of the resulting F value found in Table A-5. can be denoted and can be denoted Find the critical values
and for a two-tailed hypothesis test based on the following values: A) 0.7351,2.2378
B) 0.5327,2.2878
C) 0.4745,2.2878
D) 0.4745,2.4371
Unlock Deck
Unlock for access to all 60 flashcards in this deck.
Unlock Deck
k this deck
17
Find Consider the set of differences between two dependent sets: 84,85,83,63,61,100,98 . Round to the nearest tenth.
A) 15.3
B) 16.2
C) 15.7
D) 13.1
Consider the set of differences between two dependent sets: 84,85,83,63,61,100,98 . Round to the nearest tenth.A) 15.3
B) 16.2
C) 15.7
D) 13.1
Unlock Deck
Unlock for access to all 60 flashcards in this deck.
Unlock Deck
k this deck
18
Assume that you plan to use a significance level of to test the claim that Use the given sample sizes and numbers of successes to find the pooled estimate Round your answer to the nearest thousandth.
A) 0.163
B) 0.452
C) 0.204
D) 0.408
to test the claim that Use the given sample sizes and numbers of successes to find the pooled estimate Round your answer to the nearest thousandth.A) 0.163
B) 0.452
C) 0.204
D) 0.408
Unlock Deck
Unlock for access to all 60 flashcards in this deck.
Unlock Deck
k this deck
19
Determine whether the samples are independent or dependent. The effectiveness of a headache medicine is tested by measuring the intensity of a headache in patients before and after drug treatment. The data consist of before and after intensities for each patient.
Unlock Deck
Unlock for access to all 60 flashcards in this deck.
Unlock Deck
k this deck
20
Construct the indicated confidence interval for the difference between the two population means. Assume that the two samples are independent simple random samples selected from normally distributed populations. Do not assume that the population standard deviations are equal. A paint manufacturer wished to compare the drying times of two different types of paint. Independent simple random samples of 11 cans of type A and 9 cans of type B were selected and applied to similar surfaces. The drying times, in hours, were recorded. The summary statistics are as follows.
Construct a 98% confidence interval for the difference between the mean drying time for paint of type A and the mean drying time for paint of type B.
A)
B)
C)
D)
Construct a 98% confidence interval for
the difference between the mean drying time for paint of type A and the mean drying time for paint of type B.A)
B)
C)
D)
Unlock Deck
Unlock for access to all 60 flashcards in this deck.
Unlock Deck
k this deck
21
Construct a confidence interval for the mean of the differences d for the population of paired data. Assume that the population of paired differences is normally distributed. Using the sample paired data below, construct a 90% confidence interval for the population mean of all differences.
A)
B)
C)
D)
the mean of the differences d for the population of paired data. Assume that the population of paired differences is normally distributed. Using the sample paired data below, construct a 90% confidence interval for the population mean of all differences.A)
B)
C)
D)
Unlock Deck
Unlock for access to all 60 flashcards in this deck.
Unlock Deck
k this deck
22
Find the number of successes x suggested by the given statement. A computer manufacturer randomly selects 2680 of its computers for quality assurance and finds that 1.98% of these computers are found to be defective.
A) 56
B) 51
C) 58
D) 53
A) 56
B) 51
C) 58
D) 53
Unlock Deck
Unlock for access to all 60 flashcards in this deck.
Unlock Deck
k this deck
23
Construct the indicated confidence interval for the difference between the two population means. Assume that the two samples are independent simple random samples selected from normally distributed populations. Also assume that the population standard deviations are equal , so that the standard error of the difference between means is obtained by pooling the sample variances. A paint manufacturer wanted to compare the drying times of two different types of paint. Independent simple random samples of 11 cans of type A and 9 cans of type B were selected and applied to similar surfaces. The drying times, in hours, were recorded. The summary statistics are as follows
Construct a 99 % confidence interval for the difference between the mean drying time for paint type A and the mean drying time for paint type B.
A)
B)
C)
D)
, so that the standard error of the difference between means is obtained by pooling the sample variances. A paint manufacturer wanted to compare the drying times of two different types of paint. Independent simple random samples of 11 cans of type A and 9 cans of type B were selected and applied to similar surfaces. The drying times, in hours, were recorded. The summary statistics are as followsConstruct a 99 % confidence interval for
the difference between the mean drying time for paint type A and the mean drying time for paint type B.A)
B)
C)
D)
Unlock Deck
Unlock for access to all 60 flashcards in this deck.
Unlock Deck
k this deck
24
When performing a hypothesis test for the ratio of two population variances, the upper critical F value is denoted The lower critical F value, can be found as follows: interchange the degrees of freedom, and then take the reciprocal of the resulting F value found in Table A-5. can be denoted and can be denoted
Find the critical values and for a two-tailed hypothesis test based on the following values:
A) 0.2150,5.5996
B) 0.2150,4.8232
C) 0.3931,4.1468
D) 0.2411,4.1468
The lower critical F value, can be found as follows: interchange the degrees of freedom, and then take the reciprocal of the resulting F value found in Table A-5. can be denoted and can be denoted Find the critical values
and for a two-tailed hypothesis test based on the following values: A) 0.2150,5.5996
B) 0.2150,4.8232
C) 0.3931,4.1468
D) 0.2411,4.1468
Unlock Deck
Unlock for access to all 60 flashcards in this deck.
Unlock Deck
k this deck
25
Assume that you want to test the claim that the paired sample data come from a population for which the mean difference is Compute the value of the t test statistics. Round intermediate calculations to four decimal places as needed and final answers to three decimal places as needed.
A) t=0.578
B) t=2.890
C) t=1.292
D) t=0.415
Compute the value of the t test statistics. Round intermediate calculations to four decimal places as needed and final answers to three decimal places as needed.A) t=0.578
B) t=2.890
C) t=1.292
D) t=0.415
Unlock Deck
Unlock for access to all 60 flashcards in this deck.
Unlock Deck
k this deck
26
Express the alternative hypothesis in symbolic form. An automobile technician claims that the mean amount of time (in hours) per domestic car repair is more than that of foreign cars. Assume that two samples are independent. Let the domestic car repair times be the first population and the foreign car repair times be the second population.
A)
B)
C)
D)
A)
B)
C)
D)
Unlock Deck
Unlock for access to all 60 flashcards in this deck.
Unlock Deck
k this deck
27
Determine whether the samples are dependent or independent. The effectiveness of a new headache medicine is tested by measuring the amount of time before the headache is cured for patients who use the medicine and another group of patients who use a placebo drug.
A) Dependent samples
B) Independent samples
A) Dependent samples
B) Independent samples
Unlock Deck
Unlock for access to all 60 flashcards in this deck.
Unlock Deck
k this deck
28
In the context of a hypothesis test for two proportions, which of the following statements about the pooled sample proportion, is/are true?
I. It estimates the common value of text and under the assumption of equal proportions.
II. It is obtained by averaging the two sample proportions and
III. It is equal to the proportion of successes in both samples combined.
A) I and II
B) III only
C) I, II, and III
D) I and III
is/are true?I. It estimates the common value of text
and under the assumption of equal proportions.II. It is obtained by averaging the two sample proportions
and III. It is equal to the proportion of successes in both samples combined.
A) I and II
B) III only
C) I, II, and III
D) I and III
Unlock Deck
Unlock for access to all 60 flashcards in this deck.
Unlock Deck
k this deck
29
Assume that you plan to use a significance level of to test the claim that Use the given sample sizes and numbers of successes to find the P -value for the hypothesis test.
A) 0.1201
B) 0.0032
C) 0.0001
D) 0.0146
to test the claim that Use the given sample sizes and numbers of successes to find the P -value for the hypothesis test.A) 0.1201
B) 0.0032
C) 0.0001
D) 0.0146
Unlock Deck
Unlock for access to all 60 flashcards in this deck.
Unlock Deck
k this deck
30
Which distribution is used to test the claim that the standard deviation of the lengths (in cm) of male babies at birth is equal to the standard deviation of the lengths (in cm)of female
Babies at birth?
A) Normal
B) t
C) chi-square
D) F
Babies at birth?
A) Normal
B) t
C) chi-square
D) F
Unlock Deck
Unlock for access to all 60 flashcards in this deck.
Unlock Deck
k this deck
31
Assume that the following confidence interval for the difference in the mean time (in minutes) for male students to complete a statistics test (sample 1 ) and the mean time for female students to complete a statistics test (sample 2) was constructed using independent simple random samples. -0.2 minutes minutes What does the confidence interval suggest about the difference in length between male and female test completion times?
A) Male students take longer to complete a statistics test.
B) Female students take longer to complete a statistics test.
C) There is no difference in the length of time for statistics test completion between male and female students.
minutes What does the confidence interval suggest about the difference in length between male and female test completion times?A) Male students take longer to complete a statistics test.
B) Female students take longer to complete a statistics test.
C) There is no difference in the length of time for statistics test completion between male and female students.
Unlock Deck
Unlock for access to all 60 flashcards in this deck.
Unlock Deck
k this deck
32
Assume that you want to test the claim that the paired sample data come from a population for which the mean difference is
Compute the value of the t test statistic. Round intermediate calculations to four decimal places as needed and final answers to three decimal places as needed.
A) 9.468
B) 3.156
C) 0.351
D) 1.052
Compute the value of the t test statistic. Round intermediate calculations to four decimal places as needed and final answers to three decimal places as needed.
A) 9.468
B) 3.156
C) 0.351
D) 1.052
Unlock Deck
Unlock for access to all 60 flashcards in this deck.
Unlock Deck
k this deck
33
Construct the indicated confidence interval for the difference between the two population means. Assume that the two samples are independent simple random samples selected from normally distributed populations. Do not assume that the population standard deviations are equal. A paint manufacturer wished to compare the drying times of two different types of paint .Independent simple random samples of 11 cans of type A and 9 cans of type B were selected and applied to similar surfaces. The drying times, in hours, were recorded. The summary statistics are as follows.
Construct a 99 % confidence interval for the difference between the mean drying time for paint type A and the mean drying time for paint type B.
A)
B)
C)
D)
Construct a 99 % confidence interval for
the difference between the mean drying time for paint type A and the mean drying time for paint type B.A)
B)
C)
D)
Unlock Deck
Unlock for access to all 60 flashcards in this deck.
Unlock Deck
k this deck
34
Assume that you plan to use a significance level of to test the claim that Use the given sample sizes and numbers of successes to find the P -value for the hypothesis test.
A) 0.1610
B) 0.2130
C) 0.0412
D) 0.7718
to test the claim that Use the given sample sizes and numbers of successes to find the P -value for the hypothesis test.A) 0.1610
B) 0.2130
C) 0.0412
D) 0.7718
Unlock Deck
Unlock for access to all 60 flashcards in this deck.
Unlock Deck
k this deck
35
Determine whether the samples are dependent or independent. The effectiveness of a headache medicine is tested by measuring the intensity of a headache in patients before and after drug treatment. The data consist of before and after intensities for each patient.
A) Dependent samples
B) Independent samples
A) Dependent samples
B) Independent samples
Unlock Deck
Unlock for access to all 60 flashcards in this deck.
Unlock Deck
k this deck
36
If the lengths of male skis and female skis are used to construct a 95% confidence interval for the difference between the two population means, the result is
14.32 cm
where lengths of male skis correspond to population 1 and engths of female skis correspond to population 2. Express the confidence interval with the engths of female skis being population 1 and lengths of male skis being population
A)
B)
C)
D) This cannot be determined without having the original data values.
14.32 cm
where lengths of male skis correspond to population 1 and engths of female skis correspond to population 2. Express the confidence interval with the engths of female skis being population 1 and lengths of male skis being population
A)
B)
C)
D) This cannot be determined without having the original data values.
Unlock Deck
Unlock for access to all 60 flashcards in this deck.
Unlock Deck
k this deck
37
A test of abstract reasoning is given to a random sample of students before and after they completed a formal logic course. The results are given below. Construct a 95% confidence interval for the mean difference between the before and after scores.
A)
B)
C)
D)
A)
B)
C)
D)
Unlock Deck
Unlock for access to all 60 flashcards in this deck.
Unlock Deck
k this deck
38
Construct a confidence interval for , the mean of the differences for the population of paired data. Assume that the population of paired differences is normally distributed. A test of writing ability is given to a random sample of students before and after they completed a formal writing course. The results are given below. Construct a 99% confidence interval for the mean difference between the before and after scores.
A)
B)
C)
D)
, the mean of the differences for the population of paired data. Assume that the population of paired differences is normally distributed. A test of writing ability is given to a random sample of students before and after they completed a formal writing course. The results are given below. Construct a 99% confidence interval for the mean difference between the before and after scores. A)
B)
C)
D)
Unlock Deck
Unlock for access to all 60 flashcards in this deck.
Unlock Deck
k this deck
39
Assume that two samples are independent simple random samples selected from normally distributed populations, and do not assume that the population standard deviations are equal. Which distribution is used to test the claim that mothers spend more time (in minutes)
Driving their kids to activities than fathers do?
A) Normal
B) t
C) chi-square
D) F
Driving their kids to activities than fathers do?
A) Normal
B) t
C) chi-square
D) F
Unlock Deck
Unlock for access to all 60 flashcards in this deck.
Unlock Deck
k this deck
40
A paint manufacturer made a modification to a paint to speed up its drying time. Independent simple random samples of 11 cans of type A (the original paint)and 9 cans of type B (the modified paint)were selected and applied to similar surfaces. The drying times, in hours, were
Recorded. The summary statistics are as follows.
Recorded. The summary statistics are as follows.
Unlock Deck
Unlock for access to all 60 flashcards in this deck.
Unlock Deck
k this deck
41
Assume marketing survey involves product recognition in New York and California. Of 558 New
Yorkers surveyed, 193 knew the product while 196 out of 614 Californians knew the product.
At the 0.05 significance level, test the claim that the recognition rates are the same in both
states. Include your null and alternative hypotheses, the test statistic, P-value or critical value(s),
conclusion about the null hypothesis, and conclusion about the claim in your answer.
Unlock Deck
Unlock for access to all 60 flashcards in this deck.
Unlock Deck
k this deck
42
Test the indicated claim about the variances or standard deviations of two populations. that both samples are independent simple random samples from populations having normal
distributions. When 25 randomly selected customers enter any one of several waiting lines,
their waiting times have a standard deviation of 5.35 minutes. When 16 randomly selected
customers enter a single main waiting line, their waiting times have a standard deviation of 2.2
minutes. Use a 0.05 significance level to test the claim that there is more variation in the
waiting times when several lines are used. Include your null and alternative hypotheses, the
test statistic, P-value or critical value(s), conclusion about the null hypothesis, and conclusion
about the claim in your answer.
Unlock Deck
Unlock for access to all 60 flashcards in this deck.
Unlock Deck
k this deck
43
Identify the test statistic that should be used for testing the following given claims. a. The mean of the differences between IQ scores of brothers and IQ scores of their sisters is
equal to 0.
b. The proportion of offices with windows is equal to the proportion of offices without
windows.
c. The variation among temperature inside buildings in winter is equal to the variation in the
temperature inside building in summer.
d. The mean age of female math professors is equal to the mean age of male math professors.
Unlock Deck
Unlock for access to all 60 flashcards in this deck.
Unlock Deck
k this deck
44
A researcher wishes to compare how students at two different schools perform on a math test. He randomly selects 40 students from each school and obtains their test scores. He pairs the
first score from school A with the first school from school B, the second score from school A
with the second school from school B and so on. He then performs a hypothesis test for
matched pairs. Is this approach valid? Why or why not? If it is not valid, how should the
researcher have proceeded?
first score from school A with the first school from school B, the second score from school A
with the second school from school B and so on. He then performs a hypothesis test for
matched pairs. Is this approach valid? Why or why not? If it is not valid, how should the
researcher have proceeded?
Unlock Deck
Unlock for access to all 60 flashcards in this deck.
Unlock Deck
k this deck
45
Test the indicated claim about the means of two populations. Assume that the two samples are independent simple random samples selected from normally distributed populations. Do not assume that the population standard deviations are equal.
Use a 0.10 significance level to test the claim that the mean GPA of students at college A is different from the mean GPA of students at college B.
(Note:
Include your null and alternative hypotheses, the test statistic, p -value or critical value(s), conclusion about the null hypothesis, and conclusion about the claim in your answer.
Unlock Deck
Unlock for access to all 60 flashcards in this deck.
Unlock Deck
k this deck
46
In a random sample of 300 women, 45% favored stricter DUI legislation. In a random sample of 200 men, 25% favored stricter DUI legislation. Construct a 95% confidence interval for the difference between the population proportions . Assume that the samples are independent and that they have been randomly selected.
. Assume that the samples are independent and that they have been randomly selected. Unlock Deck
Unlock for access to all 60 flashcards in this deck.
Unlock Deck
k this deck
47
Test the given claim about the means of two populations. Assume that two dependent samples have been randomly selected from normally distributed populations. A test of abstract reasoning is given to a random sample of students before and after they completed a formal logic course. The results are given below. At the 0.05 significance level, test the claim that the mean score is not affected by the course. Include your null and alternative hypotheses, the test statistic, P -value or critical value(s), conclusion about the null hypothesis, and conclusion about the claim in your answer.
Unlock Deck
Unlock for access to all 60 flashcards in this deck.
Unlock Deck
k this deck
48
Test the indicated claim about the variances or standard deviations of two populations. Assume that both samples are independent simple random samples from populations having
normal distributions. A random sample of 16 women resulted in blood pressure levels with a
standard deviation of 23 mm Hg. A random sample of 17 men resulted in blood pressure
levels with a standard deviation of 19.2 mm Hg. Use a 0.05 significance level to test the claim
that blood pressure levels for women vary more than blood pressure levels for men. Include
your null and alternative hypotheses, the test statistic, P-value or critical value(s), conclusion
about the null hypothesis, and conclusion about the claim in your answer.
Unlock Deck
Unlock for access to all 60 flashcards in this deck.
Unlock Deck
k this deck
49
To test the null hypothesis that the difference between two population proportions is equal to a nonzero constant c , use the test statistic
As long as and are both large, the sampling distribution of the test statistic will be approximately the standard normal distribution. Given the sample data below, test the claim that the proportion of male voters who plan to vote Republican at the next presidential election is 15 percentage points more than the percentage of female voters who plan to vote Republican. Use the P -value method of hypothesis testing and use a significance level of 0.10 .
As long as
and are both large, the sampling distribution of the test statistic will be approximately the standard normal distribution. Given the sample data below, test the claim that the proportion of male voters who plan to vote Republican at the next presidential election is 15 percentage points more than the percentage of female voters who plan to vote Republican. Use the P -value method of hypothesis testing and use a significance level of 0.10 . Unlock Deck
Unlock for access to all 60 flashcards in this deck.
Unlock Deck
k this deck
50
Test the indicated claim about the means of two populations. Assume that the two samples are independent simple random samples selected from normally distributed populations. Do not assume that the population standard deviations are equal.
Use a 0.05 significance level to test the claim that the mean amount of time spent watching television by women is smaller than the mean amount of time spent watching television by men. Include your null and alternative hypotheses, the test statistic, P -value or critical value(s), conclusion about the null hypothesis, and conclusion about the claim in your answer.
Use a 0.05 significance level to test the claim that the mean amount of time spent watching television by women is smaller than the mean amount of time spent watching television by men. Include your null and alternative hypotheses, the test statistic, P -value or critical value(s), conclusion about the null hypothesis, and conclusion about the claim in your answer.
Unlock Deck
Unlock for access to all 60 flashcards in this deck.
Unlock Deck
k this deck
51
A random sample of 10 employees of an engineering company was selected. Each employee was asked to report the number of sick days he/she claimed on Wednesdays and Fridays of the previous calendar year. Use this information to test the employer's claim that more employees call in sick on Fridays than on Wednesdays. Use Assume that the differences between Wednesday's and Friday's sick day counts is normally distributed.
Include your null and alternative hypotheses, the test statistic, P -value or critical value(s), conclusion about the null hypothesis, and conclusion about the claim in your answer.
Assume that the differences between Wednesday's and Friday's sick day counts is normally distributed.Include your null and alternative hypotheses, the test statistic, P -value or critical value(s), conclusion about the null hypothesis, and conclusion about the claim in your answer.
Unlock Deck
Unlock for access to all 60 flashcards in this deck.
Unlock Deck
k this deck
52
Test the given claim about the means of two populations. Assume that two dependent samples have been randomly selected from normally distributed populations.
Using a 0.01 level of significance, test the claim that the tutoring has an effect on the math scores. Include your null and alternative hypotheses, the test statistic, P -value or critical value(s), conclusion about the null hypothesis, and conclusion about the claim in your answer.
Using a 0.01 level of significance, test the claim that the tutoring has an effect on the math scores. Include your null and alternative hypotheses, the test statistic, P -value or critical value(s), conclusion about the null hypothesis, and conclusion about the claim in your answer.
Unlock Deck
Unlock for access to all 60 flashcards in this deck.
Unlock Deck
k this deck
53
Assume that the two samples are independent simple random samples selected from normally distributed populations. Do not assume that the population standard deviations are equal. A researcher wishes to determine whether people can reduce their resting heart rate by following a particular diet. Construct a 95% confidence interval estimate for the following data. Does the confidence interval support that the mean resting heart rate for those on the diet is lower than that of those not on the diet? Explain your reasoning.
Unlock Deck
Unlock for access to all 60 flashcards in this deck.
Unlock Deck
k this deck
54
Brian wants to obtain a confidence interval estimate of where represents the proportion of American women who smoke and represents the proportion of American men who smoke. He randomly selects 100 married couples. Among the 100 women in the sample are 21 smokers. Among the 100 men are 29 smokers. Are the requirements for obtaining a confidence interval estimate of satisfied? If not, which requirement is not satisfied?
where represents the proportion of American women who smoke and represents the proportion of American men who smoke. He randomly selects 100 married couples. Among the 100 women in the sample are 21 smokers. Among the 100 men are 29 smokers. Are the requirements for obtaining a confidence interval estimate of satisfied? If not, which requirement is not satisfied? Unlock Deck
Unlock for access to all 60 flashcards in this deck.
Unlock Deck
k this deck
55
When testing for a difference between the means of a treatment group and a placebo group, the computer display below is obtained. Using a 0.05 significance level, is there sufficient evidence to support the claim that the treatment group (variable 1) comes from a population with a mean that is less than the mean for the placebo population? Explain.
Unlock Deck
Unlock for access to all 60 flashcards in this deck.
Unlock Deck
k this deck
56
Suppose you wish to test a claim about the mean of the differences from dependent samples or to construct a confidence interval estimate of the mean of the differences from dependent
samples. What are the requirements?
samples. What are the requirements?
Unlock Deck
Unlock for access to all 60 flashcards in this deck.
Unlock Deck
k this deck
57
A Dean of Students conducted a survey to test the claim that women spend more time visiting the STEM lab than men do. A survey was administered to a simple random sample of 15 female student volunteers and 12 male volunteers that asked, "How many minutes have you spent in the STEM lab this semester?" The results are shown below.
Test the claim at the 1 % level of significance. Assume that the number of minutes that women and men spent in the STEM lab is normally distributed. Do not assume that the population standard deviations are equal. Include your null and alternative hypotheses, the test statistic, P -value or critical value(s), conclusion about the null hypothesis, and conclusion about the claim in your answer.
Test the claim at the 1 % level of significance. Assume that the number of minutes that women and men spent in the STEM lab is normally distributed. Do not assume that the population standard deviations are equal. Include your null and alternative hypotheses, the test statistic, P -value or critical value(s), conclusion about the null hypothesis, and conclusion about the claim in your answer.
Unlock Deck
Unlock for access to all 60 flashcards in this deck.
Unlock Deck
k this deck
58
Test the indicated claim about the means of two populations. Assume that the two samples are independent simple random samples selected from normally distributed populations. Do not assume that the population standard deviations are equal. A researcher wishes to determine whether people with high blood pressure can reduce their blood pressure, measured in mm hG, by following a particular diet. Use a significance level of 0.01 to test the claim that the treatment group is from a population with a smaller mean than the control group. Include your null and alternative hypotheses, the test statistic, P -value or critical value(s), conclusion about the null hypothesis, and conclusion about the claim in your answer.
Unlock Deck
Unlock for access to all 60 flashcards in this deck.
Unlock Deck
k this deck
59
Test the given claim about the means of two populations. Assume that two dependent samples have been randomly selected from normally distributed populations. A coach uses a new technique to train gymnasts. 7 gymnasts were randomly selected and their competition scores were recorded before and after the training. The results are shown below.
Using a 0.01 level of significance, test the claim that the training technique is effective in raising the gymnasts' scores. Include your null and alternative hypotheses, the test statistic, P -value or critical value(s), conclusion about the null hypothesis, and conclusion about the claim in your answer.
Using a 0.01 level of significance, test the claim that the training technique is effective in raising the gymnasts' scores. Include your null and alternative hypotheses, the test statistic, P -value or critical value(s), conclusion about the null hypothesis, and conclusion about the claim in your answer.
Unlock Deck
Unlock for access to all 60 flashcards in this deck.
Unlock Deck
k this deck
60
A researcher wishes to determine whether the blood pressure of vegetarians is, on average, lower than the blood pressure of nonvegetarians. Independent simple random samples of 85 vegetarians and 75 nonvegetarians yielded the following sample statistics for systolic blood pressure:
Use a significance level of 0.01 to test the claim that the mean systolic blood pressure of vegetarians is lower than the mean systolic blood pressure of nonvegetarians. Include your null and alternative hypotheses, the test statistic, P -value or critical value(s), conclusion about the null hypothesis, and conclusion about the claim in your answer.
Use a significance level of 0.01 to test the claim that the mean systolic blood pressure of vegetarians is lower than the mean systolic blood pressure of nonvegetarians. Include your null and alternative hypotheses, the test statistic, P -value or critical value(s), conclusion about the null hypothesis, and conclusion about the claim in your answer.
Unlock Deck
Unlock for access to all 60 flashcards in this deck.
Unlock Deck
k this deck
Unlock Deck
Unlock for access to all 60 flashcards in this deck.


