Exam 9: Inferences From Two Samples
Exam 1: Introduction to Statistics60 Questions
Exam 2: Exploring Data With Tables and Graphs60 Questions
Exam 3: Describing, Exploring, and Comparing Data60 Questions
Exam 4: Probability60 Questions
Exam 5: Discrete Probability Distributions60 Questions
Exam 6: Normal Probability Distributions60 Questions
Exam 7: Estimating Parameters and Determining Sample Sizes60 Questions
Exam 8: Hypothesis Testing60 Questions
Exam 9: Inferences From Two Samples60 Questions
Exam 10: Correlation and Regression60 Questions
Exam 11: Goodness-Of-Fit and Contingency Tables60 Questions
Exam 12: Analysis of Variance59 Questions
Exam 13: Nonparametric Tests60 Questions
Exam 14: Statistical Process Control60 Questions
Select questions type
Assume that you plan to use a significance level of to test the claim that Use the given sample sizes and numbers of successes to find the pooled estimate Round your answer to the nearest thousandth.
=677 =3377 =172 =654
Free
(Multiple Choice)
4.9/5  (36)
(36)
Correct Answer: Verified
C
A Dean of Students conducted a survey to test the claim that women spend more time visiting the STEM lab than men do. A survey was administered to a simple random sample of 15 female student volunteers and 12 male volunteers that asked, "How many minutes have you spent in the STEM lab this semester?" The results are shown below.
Women Men 180 220 150 120 180 45 60 15 90 30 0 80 75 10 60 90 240 180 80 90 120 60 180 280 90 60 45
Test the claim at the 1 % level of significance. Assume that the number of minutes that women and men spent in the STEM lab is normally distributed. Do not assume that the population standard deviations are equal. Include your null and alternative hypotheses, the test statistic, P -value or critical value(s), conclusion about the null hypothesis, and conclusion about the claim in your answer.
Free
(Essay)
4.8/5 (38)
Correct Answer:Verified
Test statistic: t=0.19 critical value: t=2.485 p -value =0.425
Do not reject the null hypothesis. There is not sufficient evidence to support the claim that that women spend more time visiting the STEM lab than men do.
A researcher wishes to determine whether the blood pressure of vegetarians is, on average, lower than the blood pressure of nonvegetarians. Independent simple random samples of 85 vegetarians and 75 nonvegetarians yielded the following sample statistics for systolic blood pressure:
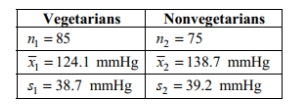 Use a significance level of 0.01 to test the claim that the mean systolic blood pressure of vegetarians is lower than the mean systolic blood pressure of nonvegetarians. Include your null and alternative hypotheses, the test statistic, P -value or critical value(s), conclusion about the null hypothesis, and conclusion about the claim in your answer.
Free
(Essay)
4.8/5 (37)
Correct Answer:Verified
Test statistic: t=-2.365
0.005<P -value <0.01
Reject . At the 1% significance level, there is sufficient evidence to support the claim that the mean systolic blood pressure of vegetarians is lower than the mean systolic blood pressure of nonvegetarians.
Construct the indicated confidence interval for the difference between the two population means. Assume that the two samples are independent simple random samples selected from normally distributed populations. Do not assume that the population standard deviations are equal. A paint manufacturer wished to compare the drying times of two different types of paint .Independent simple random samples of 11 cans of type A and 9 cans of type B were selected and applied to similar surfaces. The drying times, in hours, were recorded. The summary statistics are as follows.
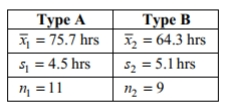 Construct a 99 % confidence interval for the difference between the mean drying time for paint type A and the mean drying time for paint type B.
(Multiple Choice)
4.8/5 (31)
Test the indicated claim about the means of two populations. Assume that the two samples are independent simple random samples selected from normally distributed populations. Do not assume that the population standard deviations are equal.
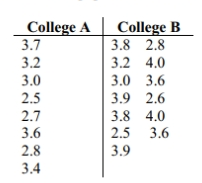 Use a 0.10 significance level to test the claim that the mean GPA of students at college A is different from the mean GPA of students at college B.
(Note:
Include your null and alternative hypotheses, the test statistic, p -value or critical value(s), conclusion about the null hypothesis, and conclusion about the claim in your answer.
Use a 0.10 significance level to test the claim that the mean GPA of students at college A is different from the mean GPA of students at college B.
(Note:
Include your null and alternative hypotheses, the test statistic, p -value or critical value(s), conclusion about the null hypothesis, and conclusion about the claim in your answer.
(Essay)
4.9/5 (34)
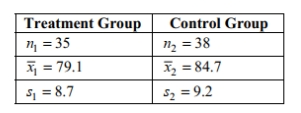
Assume that the two samples are independent simple random samples selected from normally distributed populations. Do not assume that the population standard deviations are equal. A researcher wishes to determine whether people can reduce their resting heart rate by following a particular diet. Construct a 95% confidence interval estimate for the following data. Does the confidence interval support that the mean resting heart rate for those on the diet is lower than that of those not on the diet? Explain your reasoning.
(Essay)
4.8/5 (42)
A researcher wishes to compare how students at two different schools perform on a math test. He randomly selects 40 students from each school and obtains their test scores. He pairs the
first score from school A with the first school from school B, the second score from school A
with the second school from school B and so on. He then performs a hypothesis test for
matched pairs. Is this approach valid? Why or why not? If it is not valid, how should the
researcher have proceeded?
(Essay)
4.8/5 (32)
Brian wants to obtain a confidence interval estimate of where represents the proportion of American women who smoke and represents the proportion of American men who smoke. He randomly selects 100 married couples. Among the 100 women in the sample are 21 smokers. Among the 100 men are 29 smokers. Are the requirements for obtaining a confidence interval estimate of satisfied? If not, which requirement is not satisfied?
(Essay)
4.7/5 (43)
Determine whether the samples are independent or dependent. The effectiveness of a headache medicine is tested by measuring the intensity of a headache in patients before and after drug treatment. The data consist of before and after intensities for each patient.
(Multiple Choice)
4.9/5 (34)
Express the alternative hypothesis in symbolic form. An automobile technician claims that the mean amount of time (in hours) per domestic car repair is more than that of foreign cars. Assume that two samples are independent. Let the domestic car repair times be the first population and the foreign car repair times be the second population.
(Multiple Choice)
4.9/5 (37)
Determine whether the following statement regarding the hypothesis test for two population proportions is true or false: However small the difference between two population proportions, for sufficiently large
Sample sizes, the null hypothesis of equal population proportions is likely to be rejected.
(Multiple Choice)
4.7/5 (36)
Assume that you want to test the claim that the paired sample data come from a population for which the mean difference is Compute the value of the t test statistic. Round intermediate calculations to four decimal places as needed and final answers to three decimal places as needed.
x 28 31 20 25 28 27 33 35 y 26 27 26 25 29 32 33 34
(Multiple Choice)
4.8/5 (42)
If the heights of male college basketball players and female basketball players are used to construct a 95% confidence interval for the difference between the two population means, the result is 15.35 cm
where heights of male players correspond to population 1 and heights of female players correspond to population 2. Express the confidence interval with heights of female basketball players being population 1 and heights of male basketball players being population 2 .
(Multiple Choice)
4.9/5 (37)
Test the given claim about the means of two populations. Assume that two dependent samples have been randomly selected from normally distributed populations. A coach uses a new technique to train gymnasts. 7 gymnasts were randomly selected and their competition scores were recorded before and after the training. The results are shown below.
Subject A B C D E F G Before 9.5 9.4 9.6 9.5 9.5 9.6 9.7 After 9.6 9.6 9.6 9.4 9.6 9.9 9.5
Using a 0.01 level of significance, test the claim that the training technique is effective in raising the gymnasts' scores. Include your null and alternative hypotheses, the test statistic, P -value or critical value(s), conclusion about the null hypothesis, and conclusion about the claim in your answer.
(Essay)
4.9/5 (30)
When performing a hypothesis test for the ratio of two population variances, the upper critical F value is denoted The lower critical F value, can be found as follows: interchange the degrees of freedom, and then take the reciprocal of the resulting F value found in Table A-5. can be denoted and can be denoted
Find the critical values and for a two-tailed hypothesis test based on the following values:
(Multiple Choice)
4.8/5 (37)
A test of abstract reasoning is given to a random sample of students before and after they completed a formal logic course. The results are given below. Construct a 95% confidence interval for the mean difference between the before and after scores.
Before 74 83 75 88 84 63 93 84 91 77 After 73 77 70 77 74 67 95 83 84 75
(Multiple Choice)
4.8/5 (23)
The two data sets are dependent. Find to the nearest tenth.
A 69 66 61 63 51 B 25 23 20 25 22
(Multiple Choice)
4.9/5 (32)
Test the indicated claim about the variances or standard deviations of two populations. Assume that both samples are independent simple random samples from populations having normal distributions. A random sample of 16 women resulted in blood pressure levels with a standard deviation of 23 mm Hg. A random sample of 17 men resulted in blood pressure levels with a standard deviation of 19.2 mm Hg. Use a 0.05 significance level to test the claim that blood pressure levels for women vary more than blood pressure levels for men. Include your null and alternative hypotheses, the test statistic, P-value or critical value(s), conclusion about the null hypothesis, and conclusion about the claim in your answer.
(Essay)
5.0/5 (33)
A random sample of 10 employees of an engineering company was selected. Each employee was asked to report the number of sick days he/she claimed on Wednesdays and Fridays of the previous calendar year. Use this information to test the employer's claim that more employees call in sick on Fridays than on Wednesdays. Use Assume that the differences between Wednesday's and Friday's sick day counts is normally distributed.
Wednesdays Fridays 1 2 1 3 0 1 2 1 1 6 3 2 0 4 1 0 4 5 2 2
Include your null and alternative hypotheses, the test statistic, P -value or critical value(s), conclusion about the null hypothesis, and conclusion about the claim in your answer.
(Essay)
4.9/5 (38)
Assume that the following confidence interval for the difference in the mean time (in minutes) for male students to complete a statistics test (sample 1 ) and the mean time for female students to complete a statistics test (sample 2) was constructed using independent simple random samples. -0.2 minutes minutes What does the confidence interval suggest about the difference in length between male and female test completion times?
(Multiple Choice)
4.7/5 (31)
Filters
- Essay(0)
- Multiple Choice(0)
- Short Answer(0)
- True False(0)
- Matching(0)