Deck 8: Inferences From Two Samples
Full screen (f)
Question
Use the following sample sizes and numbers of successes for the next six questions.
Medical researchers reviewing the risk of death for elderly patients taking
dementia drugs found the following data. Assume a .05 significance level for
testing the claim that the proportions are not equal. Also, assume the two simple
random samples are independent and that the conditions are
are
satisfied.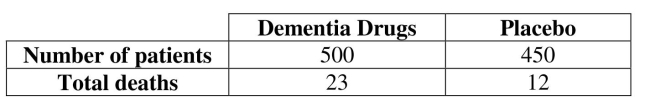
Construct a 95% confidence interval for the difference between the two proportions.
Medical researchers reviewing the risk of death for elderly patients taking
dementia drugs found the following data. Assume a .05 significance level for
testing the claim that the proportions are not equal. Also, assume the two simple
random samples are independent and that the conditions
aresatisfied.
Construct a 95% confidence interval for the difference between the two proportions.
Question
Question
Question
Use the following sample sizes and numbers of successes for the next questions.
Medical researchers studying two therapies for treating patients infected with
Hepatitis C found the following data. Assume a .05 significance level for testing the claim that the proportions are not equal. Also, assume the two simple random samples are independent and that the conditions are satisfied.
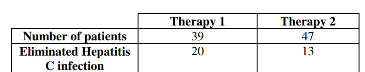
Find the odds ratio of the odds for having Hepatitis C after Therapy 1 to the odds for having Hepatitis C after Therapy 2.
Medical researchers studying two therapies for treating patients infected with
Hepatitis C found the following data. Assume a .05 significance level for testing the claim that the proportions are not equal. Also, assume the two simple random samples are independent and that the conditions
are satisfied.Find the odds ratio of the odds for having Hepatitis C after Therapy 1 to the odds for having Hepatitis C after Therapy 2.
Question
Use the following sample sizes and numbers of successes for the next questions.
Medical researchers reviewing the risk of death for elderly patients taking
dementia drugs found the following data. Assume a .05 significance level for
testing the claim that the proportions are not equal. Also, assume the two simple
random samples are independent and that the conditions are
satisfied.
Find the pooled estimate .
Medical researchers reviewing the risk of death for elderly patients taking
dementia drugs found the following data. Assume a .05 significance level for
testing the claim that the proportions are not equal. Also, assume the two simple
random samples are independent and that the conditions
aresatisfied.
Find the pooled estimate .
Question
Question
Question
Use the following sample sizes and numbers of successes for the next questions.
Medical researchers studying two therapies for treating patients infected with
Hepatitis C found the following data. Assume a .05 significance level for testing the claim that the proportions are not equal. Also, assume the two simple random samples are independent and that the conditions are satisfied.
Test the given claim using the traditional or P-value method for hypothesis testing about two proportions. Identify the null hypothesis and alternative hypothesis, state a conclusion about the null hypothesis, and state a final conclusion that addresses the original claim.
Medical researchers studying two therapies for treating patients infected with
Hepatitis C found the following data. Assume a .05 significance level for testing the claim that the proportions are not equal. Also, assume the two simple random samples are independent and that the conditions
are satisfied.Test the given claim using the traditional or P-value method for hypothesis testing about two proportions. Identify the null hypothesis and alternative hypothesis, state a conclusion about the null hypothesis, and state a final conclusion that addresses the original claim.
Question
Question
Use the following sample sizes and numbers of successes for the next questions.
Medical researchers reviewing the risk of death for elderly patients taking
dementia drugs found the following data. Assume a .05 significance level for
testing the claim that the proportions are not equal. Also, assume the two simple
random samples are independent and that the conditions are
satisfied.
Find the test statistic.
Medical researchers reviewing the risk of death for elderly patients taking
dementia drugs found the following data. Assume a .05 significance level for
testing the claim that the proportions are not equal. Also, assume the two simple
random samples are independent and that the conditions
aresatisfied.
Find the
test statistic. Question
Use the following sample sizes and numbers of successes for the next questions.
Medical researchers studying two therapies for treating patients infected with
Hepatitis C found the following data. Assume a .05 significance level for testing the claim that the proportions are not equal. Also, assume the two simple random samples are independent and that the conditions are satisfied.
Find the test statistic.
Medical researchers studying two therapies for treating patients infected with
Hepatitis C found the following data. Assume a .05 significance level for testing the claim that the proportions are not equal. Also, assume the two simple random samples are independent and that the conditions
are satisfied.Find the
test statistic. Question
Question
Use the following sample sizes and numbers of successes for the next six questions.
Medical researchers reviewing the risk of death for elderly patients taking
dementia drugs found the following data. Assume a .05 significance level for
testing the claim that the proportions are not equal. Also, assume the two simple
random samples are independent and that the conditions are
satisfied.
Test the given claim using the traditional or P-value method for hypothesis testing about two proportions. Identify the null hypothesis and alternative hypothesis, state a conclusion about the null hypothesis, and state a final conclusion that addresses the original claim.
Medical researchers reviewing the risk of death for elderly patients taking
dementia drugs found the following data. Assume a .05 significance level for
testing the claim that the proportions are not equal. Also, assume the two simple
random samples are independent and that the conditions
aresatisfied.
Test the given claim using the traditional or P-value method for hypothesis testing about two proportions. Identify the null hypothesis and alternative hypothesis, state a conclusion about the null hypothesis, and state a final conclusion that addresses the original claim.
Question
Question
Question
Question
Use the following data for the next five questions. Researchers studying sleep loss followed the length of sleep, in hours, of 10 individuals with insomnia before and after cognitive behavioral therapy (CBT). Assume a .05 significance level to test the claim that there is a difference between the length of sleep of individuals before
and after CBT. Also, assume the data consist of matched pairs, the samples are
simple random samples, and the pairs of values are from a population having a
distribution that is approximately normal.
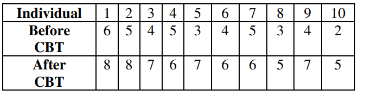
Test the given claim using the traditional or P-value method for hypothesis testing from matched pairs. Identify the null hypothesis and alternative hypothesis, state a conclusion about the null hypothesis, and state a final conclusion that addresses the original claim.
and after CBT. Also, assume the data consist of matched pairs, the samples are
simple random samples, and the pairs of values are from a population having a
distribution that is approximately normal.
Test the given claim using the traditional or P-value method for hypothesis testing from matched pairs. Identify the null hypothesis and alternative hypothesis, state a conclusion about the null hypothesis, and state a final conclusion that addresses the original claim.
Question
Use the following sample sizes and numbers of successes for the next six questions.
Medical researchers reviewing the risk of death for elderly patients taking
dementia drugs found the following data. Assume a .05 significance level for
testing the claim that the proportions are not equal. Also, assume the two simple
random samples are independent and that the conditions are
satisfied.
Find the odds ratio of the odds for death in the placebo group to the odds for death in the dementia drugs group.
Medical researchers reviewing the risk of death for elderly patients taking
dementia drugs found the following data. Assume a .05 significance level for
testing the claim that the proportions are not equal. Also, assume the two simple
random samples are independent and that the conditions
aresatisfied.
Find the odds ratio of the odds for death in the placebo group to the odds for death in the dementia drugs group.
Question
Use the following data for the next five questions. Researchers studying sleep loss followed the length of sleep, in hours, of 10 individuals with insomnia before and after cognitive behavioral therapy (CBT). Assume a .05 significance level to test the claim that there is a difference between the length of sleep of individuals before
and after CBT. Also, assume the data consist of matched pairs, the samples are
simple random samples, and the pairs of values are from a population having a
distribution that is approximately normal.
Construct a 95% confidence interval estimate of the mean difference between the lengths of sleep.
and after CBT. Also, assume the data consist of matched pairs, the samples are
simple random samples, and the pairs of values are from a population having a
distribution that is approximately normal.
Construct a 95% confidence interval estimate of the mean difference between the lengths of sleep.
Question
Question
Question
Question
Use the following data for the next questions. Ophthalmologists studying the treatment of using an infrared laser procedure in ten patients with vision loss caused by dry age-related macular degeneration (AMD) found the following data on visual acuity (VA) before and after the procedure. Assume a .05 significance level to test the claim that there is a difference between the number of VA lines that can be read by individuals before and after the procedure. Also, assume the data consist of matched pairs, the samples are simple random samples, and the pairs of values are from a population having a distribution that is approximately
normal.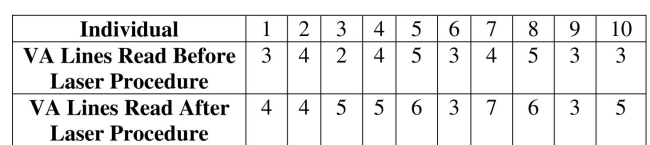
Find of visual acuity lines read.
normal.
Find
of visual acuity lines read. Question
Question
Use the following data for the next questions. Ophthalmologists studying the treatment of using an infrared laser procedure in ten patients with vision loss caused by dry age-related macular degeneration (AMD) found the following data on visual acuity (VA) before and after the procedure. Assume a .05 significance level to test the claim that there is a difference between the number of VA lines that can be read by individuals before and after the procedure. Also, assume the data consist of matched pairs, the samples are simple random samples, and the pairs of values are from a population having a distribution that is approximately
normal.
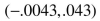
Construct a 95% confidence interval estimate of the mean difference between the before and after number of visual acuity lines read.
normal.
Construct a 95% confidence interval estimate of the mean difference between the before and after number of visual acuity lines read.
Question
Use the following data for the next questions. Ophthalmologists studying the treatment of using an infrared laser procedure in ten patients with vision loss caused by dry age-related macular degeneration (AMD) found the following data on visual acuity (VA) before and after the procedure. Assume a .05 significance level to test the claim that there is a difference between the number of VA lines that can be read by individuals before and after the procedure. Also, assume the data consist of matched pairs, the samples are simple random samples, and the pairs of values are from a population having a distribution that is approximately
normal.
Find the t test statistic.
normal.
Find the t test statistic.
Question
Question
Use the following data for the next questions. Ophthalmologists studying the treatment of using an infrared laser procedure in ten patients with vision loss caused by dry age-related macular degeneration (AMD) found the following data on visual acuity (VA) before and after the procedure. Assume a .05 significance level to test the claim that there is a difference between the number of VA lines that can be read by individuals before and after the procedure. Also, assume the data consist of matched pairs, the samples are simple random samples, and the pairs of values are from a population having a distribution that is approximately
normal.
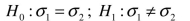
Test the given claim using the traditional or P-value method for hypothesis testing from matched pairs. Identify the null hypothesis and alternative hypothesis, state a conclusion about the null hypothesis, and state a final conclusion that addresses the original claim.
normal.
Test the given claim using the traditional or P-value method for hypothesis testing from matched pairs. Identify the null hypothesis and alternative hypothesis, state a conclusion about the null hypothesis, and state a final conclusion that addresses the original claim.
Question
Question
Question

Unlock Deck
Sign up to unlock the cards in this deck!
Unlock Deck
Unlock Deck
1/31
Play
Full screen (f)
Deck 8: Inferences From Two Samples
1
Use the following sample sizes and numbers of successes for the next six questions.
Medical researchers reviewing the risk of death for elderly patients taking
dementia drugs found the following data. Assume a .05 significance level for
testing the claim that the proportions are not equal. Also, assume the two simple
random samples are independent and that the conditions are
satisfied.
Construct a 95% confidence interval for the difference between the two proportions.
Medical researchers reviewing the risk of death for elderly patients taking
dementia drugs found the following data. Assume a .05 significance level for
testing the claim that the proportions are not equal. Also, assume the two simple
random samples are independent and that the conditions
aresatisfied.
Construct a 95% confidence interval for the difference between the two proportions.
2
Use the following data for the next questions. Biologists, researching the effects
of adding limestone sand as buffer for acid rain effects in streams, monitored the
pH levels of two streams each month for 36 months. The first stream had a mean
pH level of 6.8 with a standard deviation of 2.3. The control stream had a mean pH
level of 9.2 with a standard deviation of 1.5. Assume a .05 significance level for
testing the claim that the mean pH of the first stream was less (more acidic) than
the mean pH of the control stream. Also, assume the two samples are independent
simple random samples selected from normally distributed populations.
Identify the null hypothesis and alternative hypothesis for the claim that the pH level in the first stream has a standard deviation different from that in the second stream.
3
Determine the number of successes x suggested by the given statement.
70% of 300 osteoporosis patients surveyed said they would prefer to take a monthly pill as compared to a daily or weekly pill.
70% of 300 osteoporosis patients surveyed said they would prefer to take a monthly pill as compared to a daily or weekly pill.

4
Use the following sample sizes and numbers of successes for the next questions.
Medical researchers studying two therapies for treating patients infected with
Hepatitis C found the following data. Assume a .05 significance level for testing the claim that the proportions are not equal. Also, assume the two simple random samples are independent and that the conditions are satisfied.
Find the odds ratio of the odds for having Hepatitis C after Therapy 1 to the odds for having Hepatitis C after Therapy 2.
Medical researchers studying two therapies for treating patients infected with
Hepatitis C found the following data. Assume a .05 significance level for testing the claim that the proportions are not equal. Also, assume the two simple random samples are independent and that the conditions
are satisfied.Find the odds ratio of the odds for having Hepatitis C after Therapy 1 to the odds for having Hepatitis C after Therapy 2.
Unlock Deck
Unlock for access to all 31 flashcards in this deck.
Unlock Deck
k this deck
5
Use the following sample sizes and numbers of successes for the next questions.
Medical researchers reviewing the risk of death for elderly patients taking
dementia drugs found the following data. Assume a .05 significance level for
testing the claim that the proportions are not equal. Also, assume the two simple
random samples are independent and that the conditions are
satisfied.
Find the pooled estimate .
Medical researchers reviewing the risk of death for elderly patients taking
dementia drugs found the following data. Assume a .05 significance level for
testing the claim that the proportions are not equal. Also, assume the two simple
random samples are independent and that the conditions
aresatisfied.
Find the pooled estimate .
Unlock Deck
Unlock for access to all 31 flashcards in this deck.
Unlock Deck
k this deck
6
Use the following data for the next questions. Biologists, researching the effects
of adding limestone sand as buffer for acid rain effects in streams, monitored the
pH levels of two streams each month for 36 months. The first stream had a mean
pH level of 6.8 with a standard deviation of 2.3. The control stream had a mean pH
level of 9.2 with a standard deviation of 1.5. Assume a .05 significance level for
testing the claim that the mean pH of the first stream was less (more acidic) than
the mean pH of the control stream. Also, assume the two samples are independent
simple random samples selected from normally distributed populations.
Find the t test statistic.
Unlock Deck
Unlock for access to all 31 flashcards in this deck.
Unlock Deck
k this deck
7
Determine which samples are independent samples.
A) Women given hormones for menopause; Women given placebos
B) Cordgrass monitored for survival on the left bank of a creek; Cordgrass monitored for survival on the right bank of a creek
C) Black willow tree cuttings monitored for survival at 7 days; Black willow tree cuttings monitored for survival at 14 days
D) Mothers who smoked during pregnancy; Their babies who developed asthma
Unlock Deck
Unlock for access to all 31 flashcards in this deck.
Unlock Deck
k this deck
8
Use the following sample sizes and numbers of successes for the next questions.
Medical researchers studying two therapies for treating patients infected with
Hepatitis C found the following data. Assume a .05 significance level for testing the claim that the proportions are not equal. Also, assume the two simple random samples are independent and that the conditions are satisfied.
Test the given claim using the traditional or P-value method for hypothesis testing about two proportions. Identify the null hypothesis and alternative hypothesis, state a conclusion about the null hypothesis, and state a final conclusion that addresses the original claim.
Medical researchers studying two therapies for treating patients infected with
Hepatitis C found the following data. Assume a .05 significance level for testing the claim that the proportions are not equal. Also, assume the two simple random samples are independent and that the conditions
are satisfied.Test the given claim using the traditional or P-value method for hypothesis testing about two proportions. Identify the null hypothesis and alternative hypothesis, state a conclusion about the null hypothesis, and state a final conclusion that addresses the original claim.
Unlock Deck
Unlock for access to all 31 flashcards in this deck.
Unlock Deck
k this deck
9
Use the following data for the next questions. Biologists, researching the effects
of adding limestone sand as buffer for acid rain effects in streams, monitored the
pH levels of two streams each month for 36 months. The first stream had a mean
pH level of 6.8 with a standard deviation of 2.3. The control stream had a mean pH
level of 9.2 with a standard deviation of 1.5. Assume a .05 significance level for
testing the claim that the mean pH of the first stream was less (more acidic) than
the mean pH of the control stream. Also, assume the two samples are independent
simple random samples selected from normally distributed populations.
Use a .05 significance level to find the F test statistic for the claim that the pH level in the first stream has a standard deviation different from that in the second stream.
Unlock Deck
Unlock for access to all 31 flashcards in this deck.
Unlock Deck
k this deck
10
Use the following sample sizes and numbers of successes for the next questions.
Medical researchers reviewing the risk of death for elderly patients taking
dementia drugs found the following data. Assume a .05 significance level for
testing the claim that the proportions are not equal. Also, assume the two simple
random samples are independent and that the conditions are
satisfied.
Find the test statistic.
Medical researchers reviewing the risk of death for elderly patients taking
dementia drugs found the following data. Assume a .05 significance level for
testing the claim that the proportions are not equal. Also, assume the two simple
random samples are independent and that the conditions
aresatisfied.
Find the
test statistic. Unlock Deck
Unlock for access to all 31 flashcards in this deck.
Unlock Deck
k this deck
11
Use the following sample sizes and numbers of successes for the next questions.
Medical researchers studying two therapies for treating patients infected with
Hepatitis C found the following data. Assume a .05 significance level for testing the claim that the proportions are not equal. Also, assume the two simple random samples are independent and that the conditions are satisfied.
Find the test statistic.
Medical researchers studying two therapies for treating patients infected with
Hepatitis C found the following data. Assume a .05 significance level for testing the claim that the proportions are not equal. Also, assume the two simple random samples are independent and that the conditions
are satisfied.Find the
test statistic. Unlock Deck
Unlock for access to all 31 flashcards in this deck.
Unlock Deck
k this deck
12
Use the following data for the next questions. Biologists, researching the effects
of adding limestone sand as buffer for acid rain effects in streams, monitored the
pH levels of two streams each month for 36 months. The first stream had a mean
pH level of 6.8 with a standard deviation of 2.3. The control stream had a mean pH
level of 9.2 with a standard deviation of 1.5. Assume a .05 significance level for
testing the claim that the mean pH of the first stream was less (more acidic) than
the mean pH of the control stream. Also, assume the two samples are independent
simple random samples selected from normally distributed populations.
Construct a 90% confidence interval for the difference between the two means.
Unlock Deck
Unlock for access to all 31 flashcards in this deck.
Unlock Deck
k this deck
13
Use the following sample sizes and numbers of successes for the next six questions.
Medical researchers reviewing the risk of death for elderly patients taking
dementia drugs found the following data. Assume a .05 significance level for
testing the claim that the proportions are not equal. Also, assume the two simple
random samples are independent and that the conditions are
satisfied.
Test the given claim using the traditional or P-value method for hypothesis testing about two proportions. Identify the null hypothesis and alternative hypothesis, state a conclusion about the null hypothesis, and state a final conclusion that addresses the original claim.
Medical researchers reviewing the risk of death for elderly patients taking
dementia drugs found the following data. Assume a .05 significance level for
testing the claim that the proportions are not equal. Also, assume the two simple
random samples are independent and that the conditions
aresatisfied.
Test the given claim using the traditional or P-value method for hypothesis testing about two proportions. Identify the null hypothesis and alternative hypothesis, state a conclusion about the null hypothesis, and state a final conclusion that addresses the original claim.
Unlock Deck
Unlock for access to all 31 flashcards in this deck.
Unlock Deck
k this deck
14
Determine which samples are dependent samples.
A) Children given flu vaccine; Children given placebo vaccine
B) Survival rate of reestablishing the Gliricidia sepium tree; Survival rate of reestablishing the Bursera simaruba tree
C) Numerical abundance of floating insects in a certain river; Number of insect- eating fish in the river
D) Women given osteoporosis drug; Women given placebo
Unlock Deck
Unlock for access to all 31 flashcards in this deck.
Unlock Deck
k this deck
15
Determine the number of successes X suggested by the given statement.
64% of 500 Americans surveyed said they picked a restaurant based on how much time they have.
64% of 500 Americans surveyed said they picked a restaurant based on how much time they have.
Unlock Deck
Unlock for access to all 31 flashcards in this deck.
Unlock Deck
k this deck
16
Use the following data for the next questions. Biologists, researching the effects
of adding limestone sand as buffer for acid rain effects in streams, monitored the
pH levels of two streams each month for 36 months. The first stream had a mean
pH level of 6.8 with a standard deviation of 2.3. The control stream had a mean pH
level of 9.2 with a standard deviation of 1.5. Assume a .05 significance level for
testing the claim that the mean pH of the first stream was less (more acidic) than
the mean pH of the control stream. Also, assume the two samples are independent
simple random samples selected from normally distributed populations.
Use a .05 significance level and the traditional or P-value method for hypothesis testing the claim that the pH level in the first stream has a standard deviation different from that in the second stream. State a conclusion about the null hypothesis and a final conclusion that addresses the original claim.
Unlock Deck
Unlock for access to all 31 flashcards in this deck.
Unlock Deck
k this deck
17
Use the following data for the next five questions. Researchers studying sleep loss followed the length of sleep, in hours, of 10 individuals with insomnia before and after cognitive behavioral therapy (CBT). Assume a .05 significance level to test the claim that there is a difference between the length of sleep of individuals before
and after CBT. Also, assume the data consist of matched pairs, the samples are
simple random samples, and the pairs of values are from a population having a
distribution that is approximately normal.
Test the given claim using the traditional or P-value method for hypothesis testing from matched pairs. Identify the null hypothesis and alternative hypothesis, state a conclusion about the null hypothesis, and state a final conclusion that addresses the original claim.
Unlock Deck
Unlock for access to all 31 flashcards in this deck.
Unlock Deck
k this deck
18
Use the following sample sizes and numbers of successes for the next six questions.
Medical researchers reviewing the risk of death for elderly patients taking
dementia drugs found the following data. Assume a .05 significance level for
testing the claim that the proportions are not equal. Also, assume the two simple
random samples are independent and that the conditions are
satisfied.
Find the odds ratio of the odds for death in the placebo group to the odds for death in the dementia drugs group.
Medical researchers reviewing the risk of death for elderly patients taking
dementia drugs found the following data. Assume a .05 significance level for
testing the claim that the proportions are not equal. Also, assume the two simple
random samples are independent and that the conditions
aresatisfied.
Find the odds ratio of the odds for death in the placebo group to the odds for death in the dementia drugs group.
Unlock Deck
Unlock for access to all 31 flashcards in this deck.
Unlock Deck
k this deck
19
Use the following data for the next five questions. Researchers studying sleep loss followed the length of sleep, in hours, of 10 individuals with insomnia before and after cognitive behavioral therapy (CBT). Assume a .05 significance level to test the claim that there is a difference between the length of sleep of individuals before
and after CBT. Also, assume the data consist of matched pairs, the samples are
simple random samples, and the pairs of values are from a population having a
distribution that is approximately normal.
Construct a 95% confidence interval estimate of the mean difference between the lengths of sleep.
and after CBT. Also, assume the data consist of matched pairs, the samples are
simple random samples, and the pairs of values are from a population having a
distribution that is approximately normal.
Construct a 95% confidence interval estimate of the mean difference between the lengths of sleep.
Unlock Deck
Unlock for access to all 31 flashcards in this deck.
Unlock Deck
k this deck
20
Use the following data for the next questions. Biologists, researching the effects
of adding limestone sand as buffer for acid rain effects in streams, monitored the
pH levels of two streams each month for 36 months. The first stream had a mean
pH level of 6.8 with a standard deviation of 2.3. The control stream had a mean pH
level of 9.2 with a standard deviation of 1.5. Assume a .05 significance level for
testing the claim that the mean pH of the first stream was less (more acidic) than
the mean pH of the control stream. Also, assume the two samples are independent
simple random samples selected from normally distributed populations.
Test the given claim using the traditional or P-value method for hypothesis testing about two means. Do not assume that the population standard deviations are equal. Identify the null hypothesis and alternative hypothesis, state a conclusion about the null hypothesis, and state a final conclusion that addresses the original claim.
Unlock Deck
Unlock for access to all 31 flashcards in this deck.
Unlock Deck
k this deck
21
Use the following data for the next questions. Scientists, researching large
woody debris (LWD), surveyed the number of LWD pieces from aerial photos
taken annually for the past 35 years at two different sites. Over the 35 years of
photos examined, the first site had a mean number of LWD pieces per hectare per
year (LWD/ha/yr) of 3.7 pieces with a standard deviation of 1.9. The second site
had a mean number of LWD/ha/yr of 4.3 with a standard deviation of 2.4. Assume
a .05 significance level for testing the claim that the mean LWD/ha at the first site
had less than the mean LWD/ha/yr at the second site. Also, assume the two
samples are independent simple random samples selected from normally
distributed populations.
Test the given claim using the traditional or P-value method for hypothesis testing about two means. Do not assume that the population standard deviations are equal. Identify the null hypothesis and alternative hypothesis, state a conclusion about the null hypothesis, and state a final conclusion that addresses the original claim.
Unlock Deck
Unlock for access to all 31 flashcards in this deck.
Unlock Deck
k this deck
22
Determine which samples are dependent samples.
A) Survival rate of reestablishing saguaro cacti; Survival rate of reestablishing sagebrush
B) Children given DtaP vaccine; Children given placebo vaccine
C) Number of in-channel pools within a certain river; Number of pool-inhabiting juvenile coho salmon in the river
D) Patients given the drug Avastin for lung cancer; Patients given a placebo for lung cancer
Unlock Deck
Unlock for access to all 31 flashcards in this deck.
Unlock Deck
k this deck
23
Use the following data for the next questions. Ophthalmologists studying the treatment of using an infrared laser procedure in ten patients with vision loss caused by dry age-related macular degeneration (AMD) found the following data on visual acuity (VA) before and after the procedure. Assume a .05 significance level to test the claim that there is a difference between the number of VA lines that can be read by individuals before and after the procedure. Also, assume the data consist of matched pairs, the samples are simple random samples, and the pairs of values are from a population having a distribution that is approximately
normal.
Find of visual acuity lines read.
normal.
Find
of visual acuity lines read. Unlock Deck
Unlock for access to all 31 flashcards in this deck.
Unlock Deck
k this deck
24
Use the following data for the next questions. Scientists, researching large
woody debris (LWD), surveyed the number of LWD pieces from aerial photos
taken annually for the past 35 years at two different sites. Over the 35 years of
photos examined, the first site had a mean number of LWD pieces per hectare per
year (LWD/ha/yr) of 3.7 pieces with a standard deviation of 1.9. The second site
had a mean number of LWD/ha/yr of 4.3 with a standard deviation of 2.4. Assume
a .05 significance level for testing the claim that the mean LWD/ha at the first site
had less than the mean LWD/ha/yr at the second site. Also, assume the two
samples are independent simple random samples selected from normally
distributed populations.
Use a .05 significance level to find the F test statistic for the claim that the LWD abundance at the first site has a standard deviation different from that at the second site.
Unlock Deck
Unlock for access to all 31 flashcards in this deck.
Unlock Deck
k this deck
25
Use the following data for the next questions. Ophthalmologists studying the treatment of using an infrared laser procedure in ten patients with vision loss caused by dry age-related macular degeneration (AMD) found the following data on visual acuity (VA) before and after the procedure. Assume a .05 significance level to test the claim that there is a difference between the number of VA lines that can be read by individuals before and after the procedure. Also, assume the data consist of matched pairs, the samples are simple random samples, and the pairs of values are from a population having a distribution that is approximately
normal.
Construct a 95% confidence interval estimate of the mean difference between the before and after number of visual acuity lines read.
normal.
Construct a 95% confidence interval estimate of the mean difference between the before and after number of visual acuity lines read.
Unlock Deck
Unlock for access to all 31 flashcards in this deck.
Unlock Deck
k this deck
26
Use the following data for the next questions. Ophthalmologists studying the treatment of using an infrared laser procedure in ten patients with vision loss caused by dry age-related macular degeneration (AMD) found the following data on visual acuity (VA) before and after the procedure. Assume a .05 significance level to test the claim that there is a difference between the number of VA lines that can be read by individuals before and after the procedure. Also, assume the data consist of matched pairs, the samples are simple random samples, and the pairs of values are from a population having a distribution that is approximately
normal.
Find the t test statistic.
normal.
Find the t test statistic.
Unlock Deck
Unlock for access to all 31 flashcards in this deck.
Unlock Deck
k this deck
27
Determine which samples are independent samples.
A) Savannah moths monitored for survival at plot 1 of Iowa prairie; Savannah moths monitored for survival at plot 2 of Iowa prairie
B) Patients given the drug Requip for Restless Leg Syndrome; Patients given a placebo for Restless Leg Syndrome
C) Number of macroinvertebrates in a stream at first month; Number of macroinvertebrates in a stream at second month
D) Mothers who gave birth before week 35 of pregnancy; Their babies who developed autism
Unlock Deck
Unlock for access to all 31 flashcards in this deck.
Unlock Deck
k this deck
28
Use the following data for the next questions. Ophthalmologists studying the treatment of using an infrared laser procedure in ten patients with vision loss caused by dry age-related macular degeneration (AMD) found the following data on visual acuity (VA) before and after the procedure. Assume a .05 significance level to test the claim that there is a difference between the number of VA lines that can be read by individuals before and after the procedure. Also, assume the data consist of matched pairs, the samples are simple random samples, and the pairs of values are from a population having a distribution that is approximately
normal.
Test the given claim using the traditional or P-value method for hypothesis testing from matched pairs. Identify the null hypothesis and alternative hypothesis, state a conclusion about the null hypothesis, and state a final conclusion that addresses the original claim.
normal.
Test the given claim using the traditional or P-value method for hypothesis testing from matched pairs. Identify the null hypothesis and alternative hypothesis, state a conclusion about the null hypothesis, and state a final conclusion that addresses the original claim.
Unlock Deck
Unlock for access to all 31 flashcards in this deck.
Unlock Deck
k this deck
29
Use the following data for the next questions. Scientists, researching large
woody debris (LWD), surveyed the number of LWD pieces from aerial photos
taken annually for the past 35 years at two different sites. Over the 35 years of
photos examined, the first site had a mean number of LWD pieces per hectare per
year (LWD/ha/yr) of 3.7 pieces with a standard deviation of 1.9. The second site
had a mean number of LWD/ha/yr of 4.3 with a standard deviation of 2.4. Assume
a .05 significance level for testing the claim that the mean LWD/ha at the first site
had less than the mean LWD/ha/yr at the second site. Also, assume the two
samples are independent simple random samples selected from normally
distributed populations.
Find the t test statistic.
Unlock Deck
Unlock for access to all 31 flashcards in this deck.
Unlock Deck
k this deck
30
Use the following data for the next questions. Scientists, researching large
woody debris (LWD), surveyed the number of LWD pieces from aerial photos
taken annually for the past 35 years at two different sites. Over the 35 years of
photos examined, the first site had a mean number of LWD pieces per hectare per
year (LWD/ha/yr) of 3.7 pieces with a standard deviation of 1.9. The second site
had a mean number of LWD/ha/yr of 4.3 with a standard deviation of 2.4. Assume
a .05 significance level for testing the claim that the mean LWD/ha at the first site
had less than the mean LWD/ha/yr at the second site. Also, assume the two
samples are independent simple random samples selected from normally
distributed populations.
Identify the null hypothesis and alternative hypothesis for the claim that the LWD abundance at the first site has a standard deviation different from that at the second site.
Unlock Deck
Unlock for access to all 31 flashcards in this deck.
Unlock Deck
k this deck
31
Use the following data for the next questions. Scientists, researching large
woody debris (LWD), surveyed the number of LWD pieces from aerial photos
taken annually for the past 35 years at two different sites. Over the 35 years of
photos examined, the first site had a mean number of LWD pieces per hectare per
year (LWD/ha/yr) of 3.7 pieces with a standard deviation of 1.9. The second site
had a mean number of LWD/ha/yr of 4.3 with a standard deviation of 2.4. Assume
a .05 significance level for testing the claim that the mean LWD/ha at the first site
had less than the mean LWD/ha/yr at the second site. Also, assume the two
samples are independent simple random samples selected from normally
distributed populations.
Use a .05 significance level and the traditional or P-value method for hypothesis testing the claim that over time, the LWD abundance at the first site has a standard deviation different from that at the second site. State a conclusion about the null hypothesis and a final conclusion that addresses the original claim.
Unlock Deck
Unlock for access to all 31 flashcards in this deck.
Unlock Deck
k this deck
Unlock Deck
Unlock for access to all 31 flashcards in this deck.


