Exam 8: Inferences From Two Samples
Exam 1: Introduction to Statistics36 Questions
Exam 2: Describing, Exploring, and Comparing Data40 Questions
Exam 3: Probability40 Questions
Exam 4: Discrete Probability Distributions38 Questions
Exam 5: Normal Probability Distributions38 Questions
Exam 6: Estimates and Sample Sizes With One Sample29 Questions
Exam 7: Hypothesis Testing With One Sample39 Questions
Exam 8: Inferences From Two Samples31 Questions
Exam 9: Correlation and Regression25 Questions
Exam 10: Multinomial Experiments and Contingency Tables40 Questions
Exam 11: Analysis of Variance40 Questions
Exam 12: Nonparametric Statistics40 Questions
Exam 13: Life Tables40 Questions
Select questions type
Use the following data for the next questions. Biologists, researching the effects
of adding limestone sand as buffer for acid rain effects in streams, monitored the
pH levels of two streams each month for 36 months. The first stream had a mean
pH level of 6.8 with a standard deviation of 2.3. The control stream had a mean pH
level of 9.2 with a standard deviation of 1.5. Assume a .05 significance level for
testing the claim that the mean pH of the first stream was less (more acidic) than
the mean pH of the control stream. Also, assume the two samples are independent
simple random samples selected from normally distributed populations.
-Test the given claim using the traditional or P-value method for hypothesis testing about two means. Do not assume that the population standard deviations are equal. Identify the null hypothesis and alternative hypothesis, state a conclusion about the null hypothesis, and state a final conclusion that addresses the original claim.
Free
(Essay)
4.8/5  (36)
(36)
Correct Answer: Verified

The sample data support the claim that the
mean pH of the first stream was less than the mean pH of the control stream.
Use the following sample sizes and numbers of successes for the next six questions.
Medical researchers reviewing the risk of death for elderly patients taking
dementia drugs found the following data. Assume a .05 significance level for
testing the claim that the proportions are not equal. Also, assume the two simple
random samples are independent and that the conditions 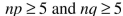 are
satisfied.
are
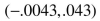
satisfied. 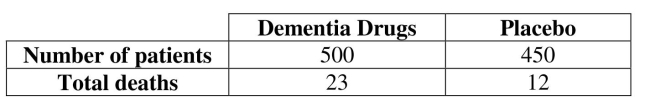 -Construct a 95% confidence interval for the difference between the two proportions.
Free
(Short Answer)
4.7/5 (28)
Correct Answer:Verified
Determine which samples are dependent samples.
Free
(Multiple Choice)
4.9/5 (31)
Correct Answer:Verified
C
Determine the number of successes x suggested by the given statement.
-70% of 300 osteoporosis patients surveyed said they would prefer to take a monthly pill as compared to a daily or weekly pill.
(Short Answer)
4.8/5 (37)
Use the following data for the next questions. Scientists, researching large
woody debris (LWD), surveyed the number of LWD pieces from aerial photos
taken annually for the past 35 years at two different sites. Over the 35 years of
photos examined, the first site had a mean number of LWD pieces per hectare per
year (LWD/ha/yr) of 3.7 pieces with a standard deviation of 1.9. The second site
had a mean number of LWD/ha/yr of 4.3 with a standard deviation of 2.4. Assume
a .05 significance level for testing the claim that the mean LWD/ha at the first site
had less than the mean LWD/ha/yr at the second site. Also, assume the two
samples are independent simple random samples selected from normally
distributed populations.
-Use a .05 significance level and the traditional or P-value method for hypothesis testing the claim that over time, the LWD abundance at the first site has a standard deviation different from that at the second site. State a conclusion about the null hypothesis and a final conclusion that addresses the original claim.
(Essay)
4.9/5 (36)
Use the following data for the next questions. Ophthalmologists studying the treatment of using an infrared laser procedure in ten patients with vision loss caused by dry age-related macular degeneration (AMD) found the following data on visual acuity (VA) before and after the procedure. Assume a .05 significance level to test the claim that there is a difference between the number of VA lines that can be read by individuals before and after the procedure. Also, assume the data consist of matched pairs, the samples are simple random samples, and the pairs of values are from a population having a distribution that is approximately
normal. 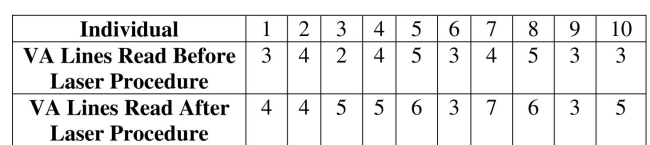 -Test the given claim using the traditional or P-value method for hypothesis testing from matched pairs. Identify the null hypothesis and alternative hypothesis, state a conclusion about the null hypothesis, and state a final conclusion that addresses the original claim.
(Essay)
4.9/5 (23)
Use the following data for the next questions. Biologists, researching the effects
of adding limestone sand as buffer for acid rain effects in streams, monitored the
pH levels of two streams each month for 36 months. The first stream had a mean
pH level of 6.8 with a standard deviation of 2.3. The control stream had a mean pH
level of 9.2 with a standard deviation of 1.5. Assume a .05 significance level for
testing the claim that the mean pH of the first stream was less (more acidic) than
the mean pH of the control stream. Also, assume the two samples are independent
simple random samples selected from normally distributed populations.
-Use a .05 significance level and the traditional or P-value method for hypothesis testing the claim that the pH level in the first stream has a standard deviation different from that in the second stream. State a conclusion about the null hypothesis and a final conclusion that addresses the original claim.
(Essay)
4.8/5 (39)
Determine the number of successes X suggested by the given statement.
-64% of 500 Americans surveyed said they picked a restaurant based on how much time they have.
(Short Answer)
4.7/5 (40)
Use the following data for the next questions. Biologists, researching the effects
of adding limestone sand as buffer for acid rain effects in streams, monitored the
pH levels of two streams each month for 36 months. The first stream had a mean
pH level of 6.8 with a standard deviation of 2.3. The control stream had a mean pH
level of 9.2 with a standard deviation of 1.5. Assume a .05 significance level for
testing the claim that the mean pH of the first stream was less (more acidic) than
the mean pH of the control stream. Also, assume the two samples are independent
simple random samples selected from normally distributed populations.
-Use a .05 significance level to find the F test statistic for the claim that the pH level in the first stream has a standard deviation different from that in the second stream.
(Short Answer)
4.8/5 (40)
Use the following data for the next questions. Ophthalmologists studying the treatment of using an infrared laser procedure in ten patients with vision loss caused by dry age-related macular degeneration (AMD) found the following data on visual acuity (VA) before and after the procedure. Assume a .05 significance level to test the claim that there is a difference between the number of VA lines that can be read by individuals before and after the procedure. Also, assume the data consist of matched pairs, the samples are simple random samples, and the pairs of values are from a population having a distribution that is approximately
normal.
-Find the t test statistic.
(Short Answer)
4.8/5 (26)
Use the following data for the next questions. Ophthalmologists studying the treatment of using an infrared laser procedure in ten patients with vision loss caused by dry age-related macular degeneration (AMD) found the following data on visual acuity (VA) before and after the procedure. Assume a .05 significance level to test the claim that there is a difference between the number of VA lines that can be read by individuals before and after the procedure. Also, assume the data consist of matched pairs, the samples are simple random samples, and the pairs of values are from a population having a distribution that is approximately
normal.
-Find  of visual acuity lines read.
(Short Answer)
4.8/5 (33)
Use the following sample sizes and numbers of successes for the next questions.
Medical researchers reviewing the risk of death for elderly patients taking
dementia drugs found the following data. Assume a .05 significance level for
testing the claim that the proportions are not equal. Also, assume the two simple
random samples are independent and that the conditions are
satisfied.
-Find the pooled estimate . 
(Short Answer)
4.8/5 (37)
Use the following sample sizes and numbers of successes for the next questions.
Medical researchers reviewing the risk of death for elderly patients taking
dementia drugs found the following data. Assume a .05 significance level for
testing the claim that the proportions are not equal. Also, assume the two simple
random samples are independent and that the conditions are
satisfied.
-Find the  test statistic.
(Short Answer)
4.9/5 (34)
Use the following data for the next questions. Biologists, researching the effects
of adding limestone sand as buffer for acid rain effects in streams, monitored the
pH levels of two streams each month for 36 months. The first stream had a mean
pH level of 6.8 with a standard deviation of 2.3. The control stream had a mean pH
level of 9.2 with a standard deviation of 1.5. Assume a .05 significance level for
testing the claim that the mean pH of the first stream was less (more acidic) than
the mean pH of the control stream. Also, assume the two samples are independent
simple random samples selected from normally distributed populations.
-Construct a 90% confidence interval for the difference between the two means.
(Short Answer)
4.8/5 (41)
Use the following data for the next five questions. Researchers studying sleep loss followed the length of sleep, in hours, of 10 individuals with insomnia before and after cognitive behavioral therapy (CBT). Assume a .05 significance level to test the claim that there is a difference between the length of sleep of individuals before
and after CBT. Also, assume the data consist of matched pairs, the samples are
simple random samples, and the pairs of values are from a population having a
distribution that is approximately normal.
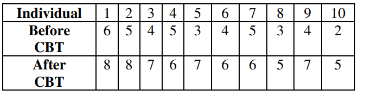 -Construct a 95% confidence interval estimate of the mean difference between the lengths of sleep.
(Short Answer)
4.8/5 (41)
Use the following data for the next five questions. Researchers studying sleep loss followed the length of sleep, in hours, of 10 individuals with insomnia before and after cognitive behavioral therapy (CBT). Assume a .05 significance level to test the claim that there is a difference between the length of sleep of individuals before
and after CBT. Also, assume the data consist of matched pairs, the samples are
simple random samples, and the pairs of values are from a population having a
distribution that is approximately normal.
-Test the given claim using the traditional or P-value method for hypothesis testing from matched pairs. Identify the null hypothesis and alternative hypothesis, state a conclusion about the null hypothesis, and state a final conclusion that addresses the original claim.
(Essay)
4.8/5 (33)
Use the following sample sizes and numbers of successes for the next questions.
Medical researchers studying two therapies for treating patients infected with
Hepatitis C found the following data. Assume a .05 significance level for testing the claim that the proportions are not equal. Also, assume the two simple random samples are independent and that the conditions  are satisfied.
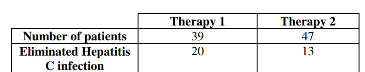 -Test the given claim using the traditional or P-value method for hypothesis testing about two proportions. Identify the null hypothesis and alternative hypothesis, state a conclusion about the null hypothesis, and state a final conclusion that addresses the original claim.
(Essay)
4.7/5 (26)
Use the following data for the next questions. Ophthalmologists studying the treatment of using an infrared laser procedure in ten patients with vision loss caused by dry age-related macular degeneration (AMD) found the following data on visual acuity (VA) before and after the procedure. Assume a .05 significance level to test the claim that there is a difference between the number of VA lines that can be read by individuals before and after the procedure. Also, assume the data consist of matched pairs, the samples are simple random samples, and the pairs of values are from a population having a distribution that is approximately
normal.
-Construct a 95% confidence interval estimate of the mean difference between the before and after number of visual acuity lines read.
(Short Answer)
4.8/5 (38)
Use the following data for the next questions. Biologists, researching the effects
of adding limestone sand as buffer for acid rain effects in streams, monitored the
pH levels of two streams each month for 36 months. The first stream had a mean
pH level of 6.8 with a standard deviation of 2.3. The control stream had a mean pH
level of 9.2 with a standard deviation of 1.5. Assume a .05 significance level for
testing the claim that the mean pH of the first stream was less (more acidic) than
the mean pH of the control stream. Also, assume the two samples are independent
simple random samples selected from normally distributed populations.
-Identify the null hypothesis and alternative hypothesis for the claim that the pH level in the first stream has a standard deviation different from that in the second stream.
(Short Answer)
4.8/5 (21)
Filters
- Essay(0)
- Multiple Choice(0)
- Short Answer(0)
- True False(0)
- Matching(0)