Deck 26: Exploring and Collecting Data
Full screen (f)
Question
Question
Question
Question
Question
Question
Boxplots of earnings per share (EPS) data for a sample of retail company stocks
And a sample of energy company stocks are shown below. Which of the following
Statement is true about the distributions of EPS for retail and energy stocks?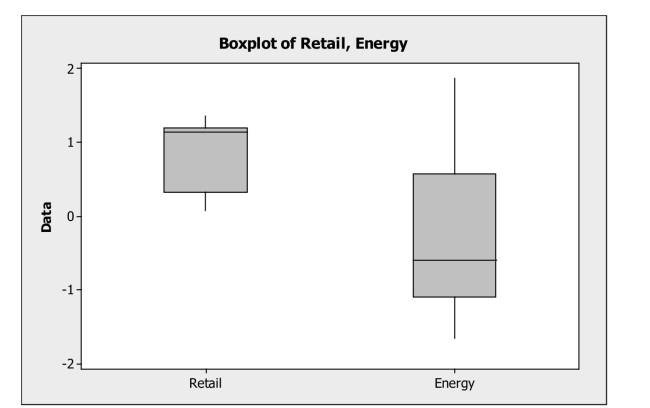
A) The distribution of EPS for retail stocks is skewed to the right.
B) The distribution of EPS for energy stocks is symmetric.
C) Both distributions of EPS are symmetric.
D) The distribution of EPS for retail stocks is skewed to the left.
E) The distribution of EPS for energy stocks is skewed to the left.
Question
Question
Question
Question
Which is true for the data shown in the histogram? 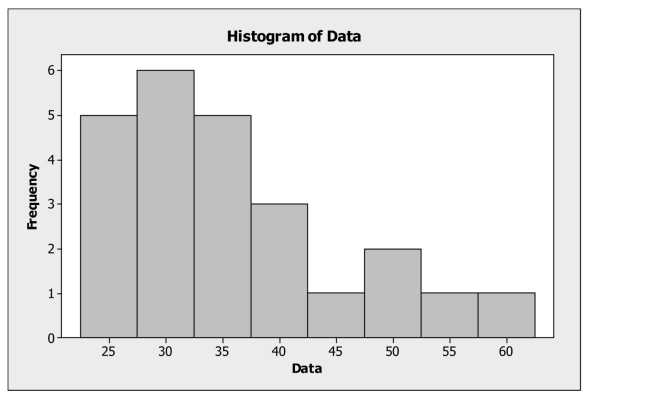 I. The distribution is skewed to the right.
II) The mean is probably smaller than the median.
III) It is appropriate to summarize these data with the mean and standard deviation.
A) I only
B) II only
C) I and II
D) I and III
E) I, II and III
I. The distribution is skewed to the right.II) The mean is probably smaller than the median.
III) It is appropriate to summarize these data with the mean and standard deviation.
A) I only
B) II only
C) I and II
D) I and III
E) I, II and III
Question
Question
A government agency has 6000 employees. As an alternative to the traditional
Five day work week, employees were asked whether they preferred a four day work week
(10 hours per day) or flexible hours. The segmented bar chart below is based on the data
Collected. Which of the following statements is true about work week preferences and
Age category?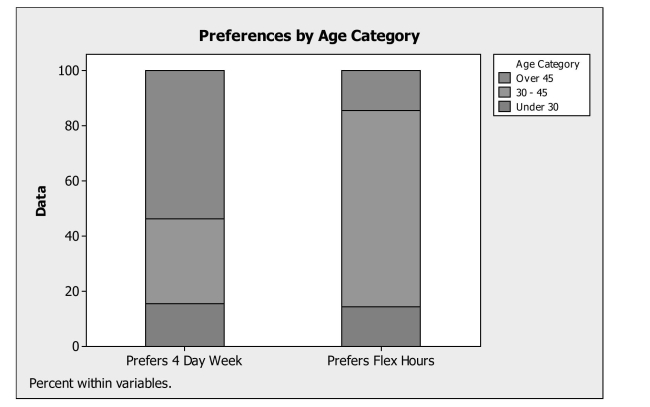
A) A greater percentage of employees who prefer a 4 day work week are in the over 45 age category compared to those who prefer flex hours.
B) A greater percentage of employees who prefer flex hours are in the over 45 age category compared to those who prefer a 4 day work week.
C) Preferences appear to be independent of age.
D) The distribution of preferences are the same across different age groups.
E) The segmented bar chart is not appropriate for these data.
Question
Question
Question
Question
Question
Question
Boxplots of earnings per share (EPS) data for a sample of retail company stocks
And a sample of energy company stocks are shown below. Which of the following
Statements is correct?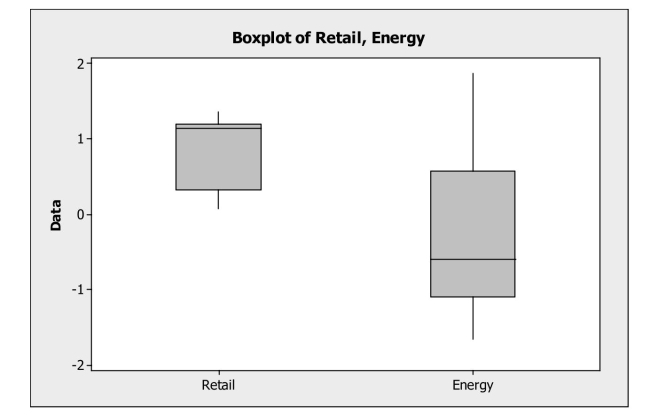
A) The median EPS is higher for energy stocks compared to retail stocks.
B) The median EPS is higher for retail stocks compared to energy stocks.
C) The IQR for the EPS data is larger for retail stocks than for energy stocks.
D) The EPS data are more variable for retail stocks than for energy stocks.
E) The mean is higher for energy stocks compared to retail stocks.
Question
Question
Question
Question
Question
An office supply chain has stores in two locations, Dayton and Scranton. One of
These stores is to be closed within the coming year, and to help make the decision,
Management reviews sales data. Below are boxplots for monthly unit sales for both
Locations.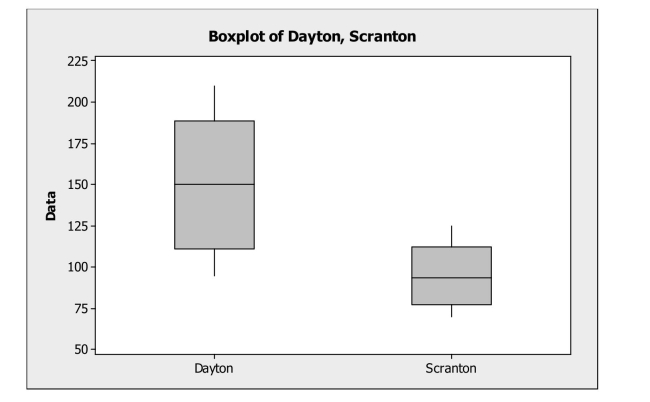
Which of the following statement is not correct?
A) Monthly sales are higher in Dayton compared to Scranton.
B) The IQR for sales in Dayton is larger than that for Scranton.
C) Monthly sales are less variable in Scranton compared to Dayton.
D) Both distributions are fairly symmetric.
E) Monthly sales are more variable in Scranton compared to Dayton.
Question
Question
In 2002 data were collected on the percent of people in the U.S. not covered by
Health insurance. Summary statistics and a histogram for these data are shown below.
The IQR for these data is
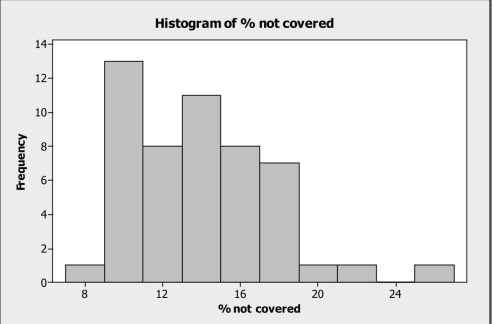
A) 16.7 %
B) 5.9 %
C) 17.9 %
D) 3.6 %
E) 13.4
Health insurance. Summary statistics and a histogram for these data are shown below.
The IQR for these data is
A) 16.7 %
B) 5.9 %
C) 17.9 %
D) 3.6 %
E) 13.4
Question
Question
Question
Question
Question
Question
An advocacy group is investigating whether gender has an effect on job category
In large investment firms. She surveyed a sample of firms with the results shown below.
Which of the following statements is true about gender and job category?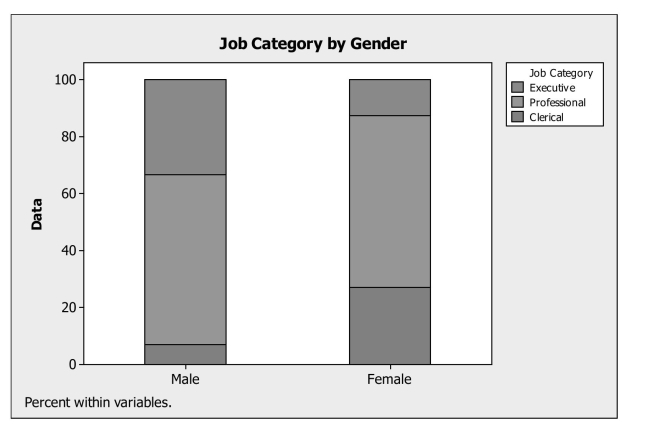
A) A greater percentage of males are executives compared to females.
B) A greater percentage of females are executives compared to males.
C) Job category appears to be independent of gender.
D) A smaller percentage of females are clerical compared to males.
E) The segmented bar chart is not appropriate for these data.
Question
Question
Which is true of the data shown in the histogram? 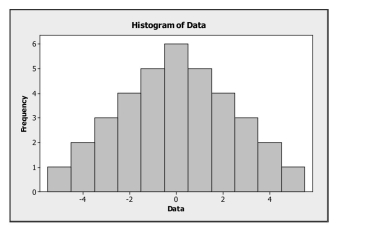 I. The distribution is approximately symmetric.
II) The mean and median are approximately equal.
III) The median and IQR summarize the data better than the mean and standard
Deviation.
A) I only
B) III only
C) I and II
D) I and III
E) I, II and III
I. The distribution is approximately symmetric.II) The mean and median are approximately equal.
III) The median and IQR summarize the data better than the mean and standard
Deviation.
A) I only
B) III only
C) I and II
D) I and III
E) I, II and III
Question
Question
Question
In 2002 data were collected on the percent of people in the U.S. not covered by
Health insurance. Summary statistics and a histogram for these data are shown below.
What is the most appropriate measure to describe the center of these data?
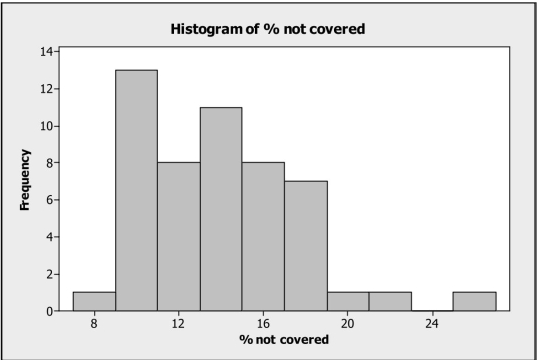
A) Range
B) Mean
C) Standard Deviation
D) Median
E) IQR
Health insurance. Summary statistics and a histogram for these data are shown below.
What is the most appropriate measure to describe the center of these data?
A) Range
B) Mean
C) Standard Deviation
D) Median
E) IQR
Question
Question
Question
Question
Question
Question
Question

Unlock Deck
Sign up to unlock the cards in this deck!
Unlock Deck
Unlock Deck
1/43
Play
Full screen (f)
Deck 26: Exploring and Collecting Data
1
A researcher is conducting a study on Internet use. He decides to first categorize
The population by education level (high school, college graduate, advanced degree, etc.)
And then survey a select number from each category. This sampling strategy is called
A) Systematic
B) Cluster
C) Random
D) Judgmental
E) Stratified
The population by education level (high school, college graduate, advanced degree, etc.)
And then survey a select number from each category. This sampling strategy is called
A) Systematic
B) Cluster
C) Random
D) Judgmental
E) Stratified
E
2
A government agency has 6000 employees. As an alternative to the traditional
Five day work week, employees were asked whether they preferred a four day work week
(10 hours per day) or flexible hours. The table below shows the results by age category.
The most appropriate display for these data is a
A) histogram.
B) stem and leaf display.
C) boxplot.
D) segmented bar chart.
E) frequency table.
segmented bar chart.
3
Suppose a sample of 60 cans of soda has a mean of 12.1 ounces and a standard
Deviation of 0.05 ounces. If a can of soda has 12 ounces, what is its corresponding z
Score?
A) 2.0
B) -2.0
C) 1.8
D) -3.0
E) -1.8
Deviation of 0.05 ounces. If a can of soda has 12 ounces, what is its corresponding z
Score?
A) 2.0
B) -2.0
C) 1.8
D) -3.0
E) -1.8
B
4
If a parameter is computed from a set of data, which of the following statements is
True?
A) The data are obtained from a census.
B) The data are obtained from a random sample.
C) The data is from a sample that is representative of the population.
D) The data are obtained from a stratified sample.
E) The data must be quantitative.
True?
A) The data are obtained from a census.
B) The data are obtained from a random sample.
C) The data is from a sample that is representative of the population.
D) The data are obtained from a stratified sample.
E) The data must be quantitative.
Unlock Deck
Unlock for access to all 43 flashcards in this deck.
Unlock Deck
k this deck
5
A manufacturer of batteries routinely tests its products to determine lifetime
(hours of continuous usage). Suppose they select a sample of 30 AAA batteries and find
That the average lifetime is 1500 hours. This is a
A) parameter.
B) statistic.
C) sampling frame.
D) sample.
E) population.
(hours of continuous usage). Suppose they select a sample of 30 AAA batteries and find
That the average lifetime is 1500 hours. This is a
A) parameter.
B) statistic.
C) sampling frame.
D) sample.
E) population.
Unlock Deck
Unlock for access to all 43 flashcards in this deck.
Unlock Deck
k this deck
6
Boxplots of earnings per share (EPS) data for a sample of retail company stocks
And a sample of energy company stocks are shown below. Which of the following
Statement is true about the distributions of EPS for retail and energy stocks?
A) The distribution of EPS for retail stocks is skewed to the right.
B) The distribution of EPS for energy stocks is symmetric.
C) Both distributions of EPS are symmetric.
D) The distribution of EPS for retail stocks is skewed to the left.
E) The distribution of EPS for energy stocks is skewed to the left.
Unlock Deck
Unlock for access to all 43 flashcards in this deck.
Unlock Deck
k this deck
7
In their October 2003 issue, Consumer Reports evaluated the price and
Performance of 23 models of cordless phones. Computer output gives the summary
Statistics for the prices ($) shown in the table. Based on these results, which of the
Following is true?
A) The distribution is symmetric.
B) The distribution is skewed to the right.
C) The distribution is skewed to the left.
D) The mean is a better measure of center for these data than the median.
E) The standard deviation is larger than the range.
Unlock Deck
Unlock for access to all 43 flashcards in this deck.
Unlock Deck
k this deck
8
The U.S. Bureau of Labor Statistics (BLS) compiles data on a number of
Variables. Which of the following BLS variables is categorical?
A) Consumer expenditures
B) Type of workplace injuries
C) Wages by occupation
D) Employment costs
E) Productivity by industry
Variables. Which of the following BLS variables is categorical?
A) Consumer expenditures
B) Type of workplace injuries
C) Wages by occupation
D) Employment costs
E) Productivity by industry
Unlock Deck
Unlock for access to all 43 flashcards in this deck.
Unlock Deck
k this deck
9
A recent survey of online shoppers asked them to indicate the primary reason they
Shop via the Internet. The table summarizes responses by reason and gender. What
Percent of respondents cite Convenience as the primary reason they shop online?
A) 42%
B) 23%
C) 62%
D) 85%
E) 33%
Shop via the Internet. The table summarizes responses by reason and gender. What
Percent of respondents cite Convenience as the primary reason they shop online?
A) 42%
B) 23%
C) 62%
D) 85%
E) 33%
Unlock Deck
Unlock for access to all 43 flashcards in this deck.
Unlock Deck
k this deck
10
Which is true for the data shown in the histogram? I. The distribution is skewed to the right.
II) The mean is probably smaller than the median.
III) It is appropriate to summarize these data with the mean and standard deviation.
A) I only
B) II only
C) I and II
D) I and III
E) I, II and III
I. The distribution is skewed to the right.II) The mean is probably smaller than the median.
III) It is appropriate to summarize these data with the mean and standard deviation.
A) I only
B) II only
C) I and II
D) I and III
E) I, II and III
Unlock Deck
Unlock for access to all 43 flashcards in this deck.
Unlock Deck
k this deck
11
A recent survey of online shoppers asked them to indicate the primary reason they
Shop via the Internet. The table summarizes responses by reason and gender. What
Percent of males cite Convenience as the primary reason they shop online?
A) 42%
B) 73%
C) 62%
D) 31%
E) 50%
Shop via the Internet. The table summarizes responses by reason and gender. What
Percent of males cite Convenience as the primary reason they shop online?
A) 42%
B) 73%
C) 62%
D) 31%
E) 50%
Unlock Deck
Unlock for access to all 43 flashcards in this deck.
Unlock Deck
k this deck
12
A government agency has 6000 employees. As an alternative to the traditional
Five day work week, employees were asked whether they preferred a four day work week
(10 hours per day) or flexible hours. The segmented bar chart below is based on the data
Collected. Which of the following statements is true about work week preferences and
Age category?
A) A greater percentage of employees who prefer a 4 day work week are in the over 45 age category compared to those who prefer flex hours.
B) A greater percentage of employees who prefer flex hours are in the over 45 age category compared to those who prefer a 4 day work week.
C) Preferences appear to be independent of age.
D) The distribution of preferences are the same across different age groups.
E) The segmented bar chart is not appropriate for these data.
Unlock Deck
Unlock for access to all 43 flashcards in this deck.
Unlock Deck
k this deck
13
A customer service center keeps track of the number of complaints received each
Day about one of their new products. The numbers of complaints received over the last
11 day period are 19, 18, 22, 21, 17, 18, 22, 19, 16, 23, and 25. The median for this
Sample of data is
A) 22. B 20 .
C 19.
D) 17.
E) 16. 6
Day about one of their new products. The numbers of complaints received over the last
11 day period are 19, 18, 22, 21, 17, 18, 22, 19, 16, 23, and 25. The median for this
Sample of data is
A) 22. B 20 .
C 19.
D) 17.
E) 16. 6
Unlock Deck
Unlock for access to all 43 flashcards in this deck.
Unlock Deck
k this deck
14
A customer service center keeps track of the number of complaints received each
Day about one of their new products. The numbers of complaints received over the last
11 day period are 19, 18, 22, 21, 17, 18, 22, 19, 16, 23, and 25. The IQR for this sample
Of data is
A) 25. B 22.
C 18.
D) 9.
E) 4.
Day about one of their new products. The numbers of complaints received over the last
11 day period are 19, 18, 22, 21, 17, 18, 22, 19, 16, 23, and 25. The IQR for this sample
Of data is
A) 25. B 22.
C 18.
D) 9.
E) 4.
Unlock Deck
Unlock for access to all 43 flashcards in this deck.
Unlock Deck
k this deck
15
What scale of measurement is type of workplace injuries (slip and fall, stress
Related, etc.)?
A) Quantitative
B) Interval
C) Nominal
D) Ordinal
E) Numerical
Related, etc.)?
A) Quantitative
B) Interval
C) Nominal
D) Ordinal
E) Numerical
Unlock Deck
Unlock for access to all 43 flashcards in this deck.
Unlock Deck
k this deck
16
A customer service center keeps track of the number of complaints received each
Day about one of their new products. The numbers of complaints received over the last
11 day period are 19, 18, 22, 21, 17, 18, 22, 19, 16, 23, and 25. The standard deviation
For this sample of data is
A) 0.842. B 2.794.
C 1)845.
D) 0.569.
E) None of the above..
Day about one of their new products. The numbers of complaints received over the last
11 day period are 19, 18, 22, 21, 17, 18, 22, 19, 16, 23, and 25. The standard deviation
For this sample of data is
A) 0.842. B 2.794.
C 1)845.
D) 0.569.
E) None of the above..
Unlock Deck
Unlock for access to all 43 flashcards in this deck.
Unlock Deck
k this deck
17
The U.S. Bureau of Labor Statistics publishes the monthly CPI (consumer price
Index). This index shows the change in prices paid by urban consumers for a market
Basket of goods and services. These data are
A) Cross-sectional
B) Nominal
C) Categorical
D) Time Series
E) Ordinal
Index). This index shows the change in prices paid by urban consumers for a market
Basket of goods and services. These data are
A) Cross-sectional
B) Nominal
C) Categorical
D) Time Series
E) Ordinal
Unlock Deck
Unlock for access to all 43 flashcards in this deck.
Unlock Deck
k this deck
18
Boxplots of earnings per share (EPS) data for a sample of retail company stocks
And a sample of energy company stocks are shown below. Which of the following
Statements is correct?
A) The median EPS is higher for energy stocks compared to retail stocks.
B) The median EPS is higher for retail stocks compared to energy stocks.
C) The IQR for the EPS data is larger for retail stocks than for energy stocks.
D) The EPS data are more variable for retail stocks than for energy stocks.
E) The mean is higher for energy stocks compared to retail stocks.
Unlock Deck
Unlock for access to all 43 flashcards in this deck.
Unlock Deck
k this deck
19
In their October 2003 issue, Consumer Reports evaluated the price and
Performance of 23 models of cordless phones. Computer output gives the summary
Statistics for the prices ($) shown in the table. The IQR for these data is
A) $ 80
B) $ 185
C) $ 55
D) $ 90
E) $52.08
Performance of 23 models of cordless phones. Computer output gives the summary
Statistics for the prices ($) shown in the table. The IQR for these data is
A) $ 80
B) $ 185
C) $ 55
D) $ 90
E) $52.08
Unlock Deck
Unlock for access to all 43 flashcards in this deck.
Unlock Deck
k this deck
20
A recent survey of online shoppers asked them to indicate the primary reason they
Shop via the Internet. The table summarizes responses by reason and gender. What
Percent of respondents who cited Greater Selection as the primary reason they shop
Online were females?
A) 53%
B) 27%
C) 50%
D) 84%
E) 42%
Shop via the Internet. The table summarizes responses by reason and gender. What
Percent of respondents who cited Greater Selection as the primary reason they shop
Online were females?
A) 53%
B) 27%
C) 50%
D) 84%
E) 42%
Unlock Deck
Unlock for access to all 43 flashcards in this deck.
Unlock Deck
k this deck
21
A magazine that publishes product reviews conducted a survey of teenagers'
Preferences for cell phones. Three brands of cell phone designed specifically with teens
In mind were the focus of the study. The table summarizes responses by brand and
Gender. What percent of teenagers preferred LG Rumor?
A) 50%
B) 41%
C) 25%
D) 16%
E) 20%
Preferences for cell phones. Three brands of cell phone designed specifically with teens
In mind were the focus of the study. The table summarizes responses by brand and
Gender. What percent of teenagers preferred LG Rumor?
A) 50%
B) 41%
C) 25%
D) 16%
E) 20%
Unlock Deck
Unlock for access to all 43 flashcards in this deck.
Unlock Deck
k this deck
22
A magazine that publishes product reviews conducted a survey of teenagers'
Preferences for cell phones. Three brands of cell phone designed specifically with teens
In mind were the focus of the study. The table summarizes responses by brand and
Gender. Which of the following charts would be appropriate for displaying the marginal
Distribution of brands?
A) Histogram
B) Boxplot
C) Pie Chart
D) Line Graph
E) Stem and Leaf Display
Unlock Deck
Unlock for access to all 43 flashcards in this deck.
Unlock Deck
k this deck
23
An office supply chain has stores in two locations, Dayton and Scranton. One of
These stores is to be closed within the coming year, and to help make the decision,
Management reviews sales data. Below are boxplots for monthly unit sales for both
Locations.
Which of the following statement is not correct?
A) Monthly sales are higher in Dayton compared to Scranton.
B) The IQR for sales in Dayton is larger than that for Scranton.
C) Monthly sales are less variable in Scranton compared to Dayton.
D) Both distributions are fairly symmetric.
E) Monthly sales are more variable in Scranton compared to Dayton.
These stores is to be closed within the coming year, and to help make the decision,
Management reviews sales data. Below are boxplots for monthly unit sales for both
Locations.
Which of the following statement is not correct?
A) Monthly sales are higher in Dayton compared to Scranton.
B) The IQR for sales in Dayton is larger than that for Scranton.
C) Monthly sales are less variable in Scranton compared to Dayton.
D) Both distributions are fairly symmetric.
E) Monthly sales are more variable in Scranton compared to Dayton.
Unlock Deck
Unlock for access to all 43 flashcards in this deck.
Unlock Deck
k this deck
24
A researcher is conducting a study on eating disorders. Using a list of recent
Participants in the online Weight Watchers program, she randomly selects a name from
The alphabetized list. She then chooses every tenth person from that point on to include
In her study. This sampling strategy is called
A) Systematic
B) Cluster
C) Random
D) Stratified
E) Judgmental
Participants in the online Weight Watchers program, she randomly selects a name from
The alphabetized list. She then chooses every tenth person from that point on to include
In her study. This sampling strategy is called
A) Systematic
B) Cluster
C) Random
D) Stratified
E) Judgmental
Unlock Deck
Unlock for access to all 43 flashcards in this deck.
Unlock Deck
k this deck
25
In 2002 data were collected on the percent of people in the U.S. not covered by
Health insurance. Summary statistics and a histogram for these data are shown below.
The IQR for these data is
A) 16.7 %
B) 5.9 %
C) 17.9 %
D) 3.6 %
E) 13.4
Health insurance. Summary statistics and a histogram for these data are shown below.
The IQR for these data is
A) 16.7 %
B) 5.9 %
C) 17.9 %
D) 3.6 %
E) 13.4
Unlock Deck
Unlock for access to all 43 flashcards in this deck.
Unlock Deck
k this deck
26
Real estate agencies also keep track of housing prices in a given area. Suppose
They also provide their clients with quarterly median selling prices for homes in a given
Area for the past three year period. These data are
A) Cross-sectional
B) Time Series
C) Categorical
D) Nominal
E) Ordinal
They also provide their clients with quarterly median selling prices for homes in a given
Area for the past three year period. These data are
A) Cross-sectional
B) Time Series
C) Categorical
D) Nominal
E) Ordinal
Unlock Deck
Unlock for access to all 43 flashcards in this deck.
Unlock Deck
k this deck
27
Below is a stem and leaf display of prices for a sample homes recently sold in a
Metropolitan area in the southeastern region of the U.S.
Stem-and-Leaf Display: Home Prices Stem-and-leaf of Home Prices
Leaf Unit
Which of the following statements is true?
A) The mean would be more appropriate than the median to describe the center of this distribution.
B) This distribution is fairly symmetric.
C) This distribution is right skewed.
D) This distribution is left skewed.
E) Both A and C
Unlock Deck
Unlock for access to all 43 flashcards in this deck.
Unlock Deck
k this deck
28
In listing a property, real estate agencies provides information on a number of
Variables. Which of the following variables related to property listings is categorical?
A) Real Estate Tax
B) Number of Bedrooms
C) Style of Home
D) Asking Price
E) Number of Bathrooms
Variables. Which of the following variables related to property listings is categorical?
A) Real Estate Tax
B) Number of Bedrooms
C) Style of Home
D) Asking Price
E) Number of Bathrooms
Unlock Deck
Unlock for access to all 43 flashcards in this deck.
Unlock Deck
k this deck
29
A magazine that publishes product reviews conducted a survey of teenagers'
Preferences for cell phones. Three brands of cell phone designed specifically with teens
In mind were the focus of the study. The table summarizes responses by brand and
Gender. What percent of teenagers who preferred the BlackJack II were males?
A) 63%
B) 32%
C) 16%
D) 50%
E) 41%
Preferences for cell phones. Three brands of cell phone designed specifically with teens
In mind were the focus of the study. The table summarizes responses by brand and
Gender. What percent of teenagers who preferred the BlackJack II were males?
A) 63%
B) 32%
C) 16%
D) 50%
E) 41%
Unlock Deck
Unlock for access to all 43 flashcards in this deck.
Unlock Deck
k this deck
30
A magazine that publishes product reviews conducted a survey of teenagers'
Preferences for cell phones. Three brands of cell phone designed specifically with teens
In mind were the focus of the study. The table summarizes responses by brand and
Gender. What percent of female teenagers preferred the Sidekick LX?
A) 43%
B) 60%
C) 21%
D) 50%
E) 16%
Preferences for cell phones. Three brands of cell phone designed specifically with teens
In mind were the focus of the study. The table summarizes responses by brand and
Gender. What percent of female teenagers preferred the Sidekick LX?
A) 43%
B) 60%
C) 21%
D) 50%
E) 16%
Unlock Deck
Unlock for access to all 43 flashcards in this deck.
Unlock Deck
k this deck
31
An advocacy group is investigating whether gender has an effect on job category
In large investment firms. She surveyed a sample of firms with the results shown below.
Which of the following statements is true about gender and job category?
A) A greater percentage of males are executives compared to females.
B) A greater percentage of females are executives compared to males.
C) Job category appears to be independent of gender.
D) A smaller percentage of females are clerical compared to males.
E) The segmented bar chart is not appropriate for these data.
In large investment firms. She surveyed a sample of firms with the results shown below.
Which of the following statements is true about gender and job category?
A) A greater percentage of males are executives compared to females.
B) A greater percentage of females are executives compared to males.
C) Job category appears to be independent of gender.
D) A smaller percentage of females are clerical compared to males.
E) The segmented bar chart is not appropriate for these data.
Unlock Deck
Unlock for access to all 43 flashcards in this deck.
Unlock Deck
k this deck
32
A researcher is conducting a study to determine how knowledgeable teenagers are
About making good food choices. She decides to interview teenagers eating at a fast food
Restaurant. The results may be biased because this is a
A) simple random sample.
B) voluntary response sample.
C) convenience sample.
D) stratified sample.
E) census.
About making good food choices. She decides to interview teenagers eating at a fast food
Restaurant. The results may be biased because this is a
A) simple random sample.
B) voluntary response sample.
C) convenience sample.
D) stratified sample.
E) census.
Unlock Deck
Unlock for access to all 43 flashcards in this deck.
Unlock Deck
k this deck
33
Which is true of the data shown in the histogram? I. The distribution is approximately symmetric.
II) The mean and median are approximately equal.
III) The median and IQR summarize the data better than the mean and standard
Deviation.
A) I only
B) III only
C) I and II
D) I and III
E) I, II and III
I. The distribution is approximately symmetric.II) The mean and median are approximately equal.
III) The median and IQR summarize the data better than the mean and standard
Deviation.
A) I only
B) III only
C) I and II
D) I and III
E) I, II and III
Unlock Deck
Unlock for access to all 43 flashcards in this deck.
Unlock Deck
k this deck
34
An advocacy group is investigating whether gender has an effect on job category
In large investment firms. She surveyed a sample of firms with the results shown below.
The most appropriate display for these data is a
A) histogram.
B) stem and leaf display.
C) boxplot.
D) segmented bar chart.
E) frequency table.
In large investment firms. She surveyed a sample of firms with the results shown below.
The most appropriate display for these data is a
A) histogram.
B) stem and leaf display.
C) boxplot.
D) segmented bar chart.
E) frequency table.
Unlock Deck
Unlock for access to all 43 flashcards in this deck.
Unlock Deck
k this deck
35
What scale of measurement is the style of a home (colonial, split level, ranch etc)?
A) Nominal
B) Interval
C) Quantitative
D) Ordinal
E) Numerical
A) Nominal
B) Interval
C) Quantitative
D) Ordinal
E) Numerical
Unlock Deck
Unlock for access to all 43 flashcards in this deck.
Unlock Deck
k this deck
36
In 2002 data were collected on the percent of people in the U.S. not covered by
Health insurance. Summary statistics and a histogram for these data are shown below.
What is the most appropriate measure to describe the center of these data?
A) Range
B) Mean
C) Standard Deviation
D) Median
E) IQR
Health insurance. Summary statistics and a histogram for these data are shown below.
What is the most appropriate measure to describe the center of these data?
A) Range
B) Mean
C) Standard Deviation
D) Median
E) IQR
Unlock Deck
Unlock for access to all 43 flashcards in this deck.
Unlock Deck
k this deck
37
A manufacturer of cable wire periodically selects samples to monitor the process.
A sample of ten wires is selected and the diameters (in cm.) are 0.493, 0.534, 0.527,0.511, 0.565, 0.559, 0.519, 0.562, 0.551, and 0.530. The mean diameter is
A) 0.455 cm.
B) 0.535 cm.
C) 0.511 cm.
D) 0.565 cm.
E) 0.499 cm.
A sample of ten wires is selected and the diameters (in cm.) are 0.493, 0.534, 0.527,0.511, 0.565, 0.559, 0.519, 0.562, 0.551, and 0.530. The mean diameter is
A) 0.455 cm.
B) 0.535 cm.
C) 0.511 cm.
D) 0.565 cm.
E) 0.499 cm.
Unlock Deck
Unlock for access to all 43 flashcards in this deck.
Unlock Deck
k this deck
38
A manufacturer of cable wire periodically selects samples to monitor the process.
A sample of ten wires is selected and the diameters (in cm.) are 0.493, 0.534, 0.527,0.511, 0.565, 0.559, 0.519, 0.562, 0.551, and 0.530. The standard deviation is
A) 0.455 cm.
B) 0.005 cm.
C) 0.045 cm.
D) 0.024 cm.
E) 0.099 cm.
A sample of ten wires is selected and the diameters (in cm.) are 0.493, 0.534, 0.527,0.511, 0.565, 0.559, 0.519, 0.562, 0.551, and 0.530. The standard deviation is
A) 0.455 cm.
B) 0.005 cm.
C) 0.045 cm.
D) 0.024 cm.
E) 0.099 cm.
Unlock Deck
Unlock for access to all 43 flashcards in this deck.
Unlock Deck
k this deck
39
A researcher is conducting a study on eating disorders. Using a list of recent
Participants in the online Weight Watchers program, she randomly selects a sample from
The alphabetized list. This list represents the
A) Sample
B) Parameter
C) Population
D) Sampling frame
E) Statistic
Participants in the online Weight Watchers program, she randomly selects a sample from
The alphabetized list. This list represents the
A) Sample
B) Parameter
C) Population
D) Sampling frame
E) Statistic
Unlock Deck
Unlock for access to all 43 flashcards in this deck.
Unlock Deck
k this deck
40
For families who live in apartments the correlation between the family's income
And the amount of rent they pay is r = 0.60. Which is true?
I) In general, families with higher incomes pay more in rent.
II) On average, families spend 60% of their income on rent.
III) The regression line passes through 60% of the (income$, rent$) data
Points.
A) I only
B) II only
C) I and II
D) I and III
E) I, II and III
Unlock Deck
Unlock for access to all 43 flashcards in this deck.
Unlock Deck
k this deck
41
Suppose a sample of 60 business majors revealed that the average time spent
Studying per week is 22 hours with a standard deviation of 4 hours. For one student
Reporting that he studies 16 hours per week, the corresponding z score is
A) -1.5
B) 1.5
C) 2.2
D) -2.2
E) -3.0
Studying per week is 22 hours with a standard deviation of 4 hours. For one student
Reporting that he studies 16 hours per week, the corresponding z score is
A) -1.5
B) 1.5
C) 2.2
D) -2.2
E) -3.0
Unlock Deck
Unlock for access to all 43 flashcards in this deck.
Unlock Deck
k this deck
42
A correlation of zero between two quantitative variables means that
A) we have done something wrong in our calculation of r.
B) there is no association between the two variables.
C) there is no linear association between the two variables.
D) re-expressing the data will guarantee a linear association between the two variables.
E) none of the above
A) we have done something wrong in our calculation of r.
B) there is no association between the two variables.
C) there is no linear association between the two variables.
D) re-expressing the data will guarantee a linear association between the two variables.
E) none of the above
Unlock Deck
Unlock for access to all 43 flashcards in this deck.
Unlock Deck
k this deck
43
A regression analysis of company profits and the amount of money the company spent on advertising produced a . Which of these is true?
I. This model can correctly predict the profit for of companies.
II. of the variance in company profit can be accounted for by the model.
III. On average, companies spend about of their profits on advertising.
A) None
B) I only
C) II only
D) III only
E) I and III
I. This model can correctly predict the profit for of companies.
II. of the variance in company profit can be accounted for by the model.
III. On average, companies spend about of their profits on advertising.
A) None
B) I only
C) II only
D) III only
E) I and III
Unlock Deck
Unlock for access to all 43 flashcards in this deck.
Unlock Deck
k this deck
Unlock Deck
Unlock for access to all 43 flashcards in this deck.


