Exam 26: Exploring and Collecting Data
Exam 2: Data20 Questions
Exam 3: Surveys and Sampling26 Questions
Exam 4: Displaying and Describing Categorical Data21 Questions
Exam 5: Displaying and Describing Quantitative Data24 Questions
Exam 6: Correlation and Linear Regression36 Questions
Exam 7: Randomness and Probability28 Questions
Exam 8: Random Variables and Probability Models24 Questions
Exam 9: The Normal Distribution21 Questions
Exam 10: Confidence Intervals for Means20 Questions
Exam 11: Confidence Intervals for Proportions28 Questions
Exam 12: Confidence Intervals for Means21 Questions
Exam 13: Testing Hypotheses18 Questions
Exam 14: Comparing Two Groups19 Questions
Exam 15: Inference for Counts: Chi-Square20 Questions
Exam 16: Inference for Regression22 Questions
Exam 17: Understanding Residuals22 Questions
Exam 18: Multiple Regression15 Questions
Exam 19: Data13 Questions
Exam 22: Business Statistics20 Questions
Exam 24: Decision Making and Risk25 Questions
Exam 25: Introduction to Data Mining11 Questions
Exam 26: Exploring and Collecting Data43 Questions
Exam 27: Modeling With Probability20 Questions
Exam 28: Inference for Decision Making25 Questions
Exam 29: Models for Decision Making38 Questions
Exam 30: Selected Topics in Decision Making22 Questions
Select questions type
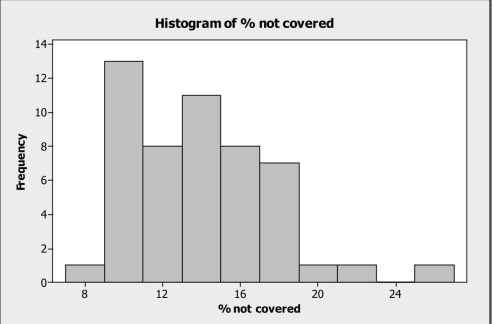
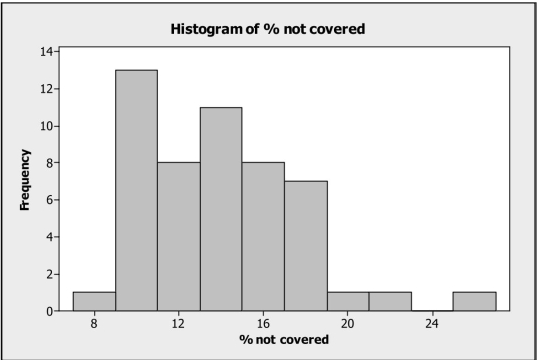
In 2002 data were collected on the percent of people in the U.S. not covered by
Health insurance. Summary statistics and a histogram for these data are shown below.
The IQR for these data is Min Q1 Median Q3 Max Mean SD 7.9 10.8 13.4 16.7 25.8 13.9 3.6
Free
(Multiple Choice)
4.8/5  (34)
(34)
Correct Answer: Verified
B
A manufacturer of cable wire periodically selects samples to monitor the process.
A sample of ten wires is selected and the diameters (in cm.) are 0.493, 0.534, 0.527,0.511, 0.565, 0.559, 0.519, 0.562, 0.551, and 0.530. The mean diameter is
Free
(Multiple Choice)
4.9/5 (34)
Correct Answer:Verified
B
Boxplots of earnings per share (EPS) data for a sample of retail company stocks
And a sample of energy company stocks are shown below. Which of the following
Statements is correct? 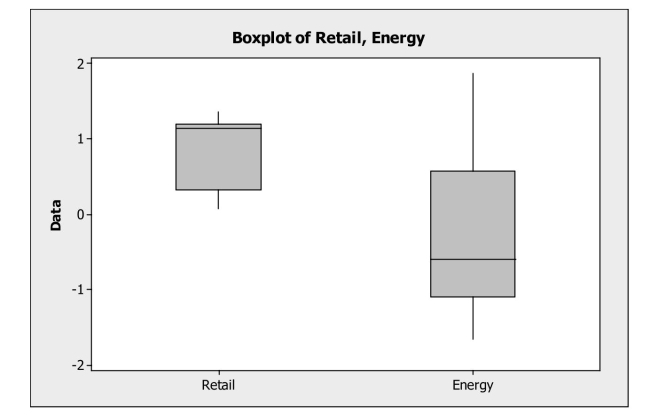
Free
(Multiple Choice)
4.8/5 (39)
Correct Answer:Verified
B
Real estate agencies also keep track of housing prices in a given area. Suppose
They also provide their clients with quarterly median selling prices for homes in a given
Area for the past three year period. These data are
(Multiple Choice)
4.9/5 (30)
A magazine that publishes product reviews conducted a survey of teenagers'
Preferences for cell phones. Three brands of cell phone designed specifically with teens
In mind were the focus of the study. The table summarizes responses by brand and
Gender. What percent of teenagers preferred LG Rumor? Cell Phone Male Female LG Rumor 55 87 Sidekick LX 99 150 BlackJack II 196 113
(Multiple Choice)
4.9/5 (39)
A customer service center keeps track of the number of complaints received each
Day about one of their new products. The numbers of complaints received over the last
11 day period are 19, 18, 22, 21, 17, 18, 22, 19, 16, 23, and 25. The IQR for this sample
Of data is
(Multiple Choice)
4.7/5 (31)
A government agency has 6000 employees. As an alternative to the traditional
Five day work week, employees were asked whether they preferred a four day work week
(10 hours per day) or flexible hours. The table below shows the results by age category.
The most appropriate display for these data is a Age Category Prefers 4 Day Week Prefers Flex Hours Under 30 600 300 30-45 1200 1500 Over 45 2100 300
(Multiple Choice)
4.8/5 (40)
What scale of measurement is the style of a home (colonial, split level, ranch etc)?
(Multiple Choice)
4.9/5 (34)
A recent survey of online shoppers asked them to indicate the primary reason they
Shop via the Internet. The table summarizes responses by reason and gender. What
Percent of respondents cite Convenience as the primary reason they shop online? Reason for Shopping Online Male Female Convenience 249 90 Better Prices 110 99 Greater Selection 41 211
(Multiple Choice)
4.9/5 (29)
A magazine that publishes product reviews conducted a survey of teenagers'
Preferences for cell phones. Three brands of cell phone designed specifically with teens
In mind were the focus of the study. The table summarizes responses by brand and
Gender. What percent of teenagers who preferred the BlackJack II were males? Cell Phone Male Female LG Rumor 55 87 Sidekick LX 99 150 BlackJack II 196 113
(Multiple Choice)
4.8/5 (29)
A customer service center keeps track of the number of complaints received each
Day about one of their new products. The numbers of complaints received over the last
11 day period are 19, 18, 22, 21, 17, 18, 22, 19, 16, 23, and 25. The standard deviation
For this sample of data is
(Multiple Choice)
4.8/5 (43)
Suppose a sample of 60 cans of soda has a mean of 12.1 ounces and a standard
Deviation of 0.05 ounces. If a can of soda has 12 ounces, what is its corresponding z
Score?
(Multiple Choice)
4.7/5 (33)
A manufacturer of cable wire periodically selects samples to monitor the process.
A sample of ten wires is selected and the diameters (in cm.) are 0.493, 0.534, 0.527,0.511, 0.565, 0.559, 0.519, 0.562, 0.551, and 0.530. The standard deviation is
(Multiple Choice)
4.9/5 (39)
A magazine that publishes product reviews conducted a survey of teenagers'
Preferences for cell phones. Three brands of cell phone designed specifically with teens
In mind were the focus of the study. The table summarizes responses by brand and
Gender. Which of the following charts would be appropriate for displaying the marginal
Distribution of brands? Cell Phone Male Female LG Rumor 55 87 Sidekick LX 99 150 BlackJack II 196 113
(Multiple Choice)
4.8/5 (26)
An advocacy group is investigating whether gender has an effect on job category
In large investment firms. She surveyed a sample of firms with the results shown below.
The most appropriate display for these data is a Job Category Male Female Clerical / Technical 85 215 Professional Staff 720 480 Executive / Managerial 400 100
(Multiple Choice)
4.8/5 (36)
A magazine that publishes product reviews conducted a survey of teenagers'
Preferences for cell phones. Three brands of cell phone designed specifically with teens
In mind were the focus of the study. The table summarizes responses by brand and
Gender. What percent of female teenagers preferred the Sidekick LX? Cell Phone Male Female LG Rumor 55 87 Sidekick LX 99 150 BlackJack II 196 113
(Multiple Choice)
4.8/5 (35)
The U.S. Bureau of Labor Statistics (BLS) compiles data on a number of
Variables. Which of the following BLS variables is categorical?
(Multiple Choice)
4.8/5 (42)
Boxplots of earnings per share (EPS) data for a sample of retail company stocks
And a sample of energy company stocks are shown below. Which of the following
Statement is true about the distributions of EPS for retail and energy stocks? 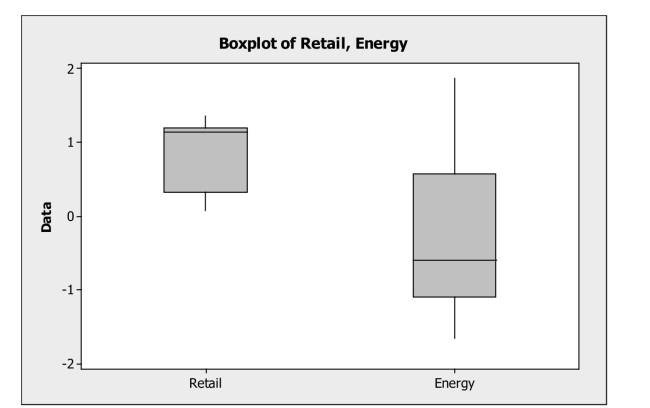
(Multiple Choice)
4.9/5 (22)
In 2002 data were collected on the percent of people in the U.S. not covered by
Health insurance. Summary statistics and a histogram for these data are shown below.
What is the most appropriate measure to describe the center of these data? Min Q1 Median Q3 Max Mean SD 7.9 10.8 13.4 16.7 25.8 13.9 3.6
(Multiple Choice)
4.8/5 (40)
A researcher is conducting a study on eating disorders. Using a list of recent
Participants in the online Weight Watchers program, she randomly selects a name from
The alphabetized list. She then chooses every tenth person from that point on to include
In her study. This sampling strategy is called
(Multiple Choice)
4.7/5 (35)
Filters
- Essay(0)
- Multiple Choice(0)
- Short Answer(0)
- True False(0)
- Matching(0)