Deck 12: Statistics
Full screen (f)
Question
Construct a stem and leaf display for given data.
The numbers below represent the commute times (in minutes)for a group of college students.
The numbers below represent the commute times (in minutes)for a group of college students.
Question
Construct a stem and leaf display for given data.
The ages of the instructors at a local college are given below.
The ages of the instructors at a local college are given below.
Question
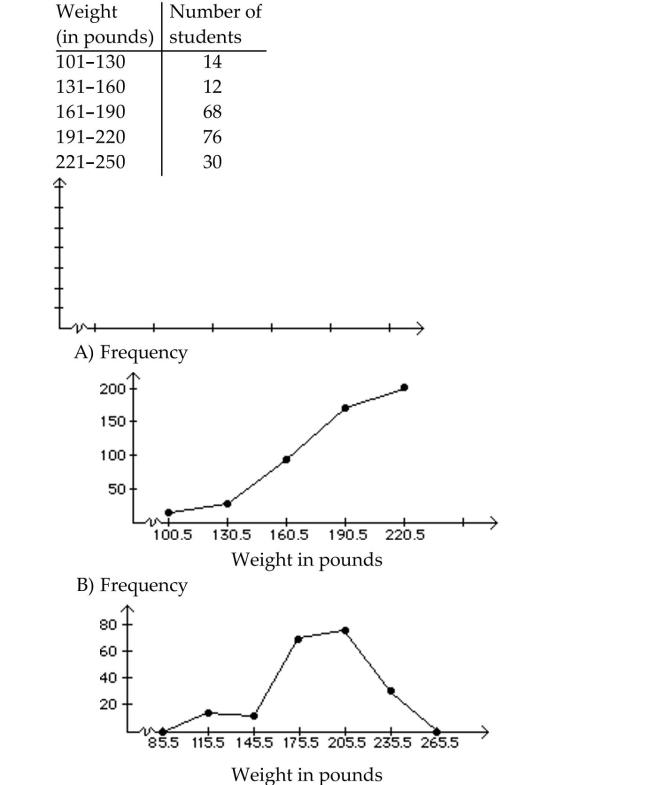
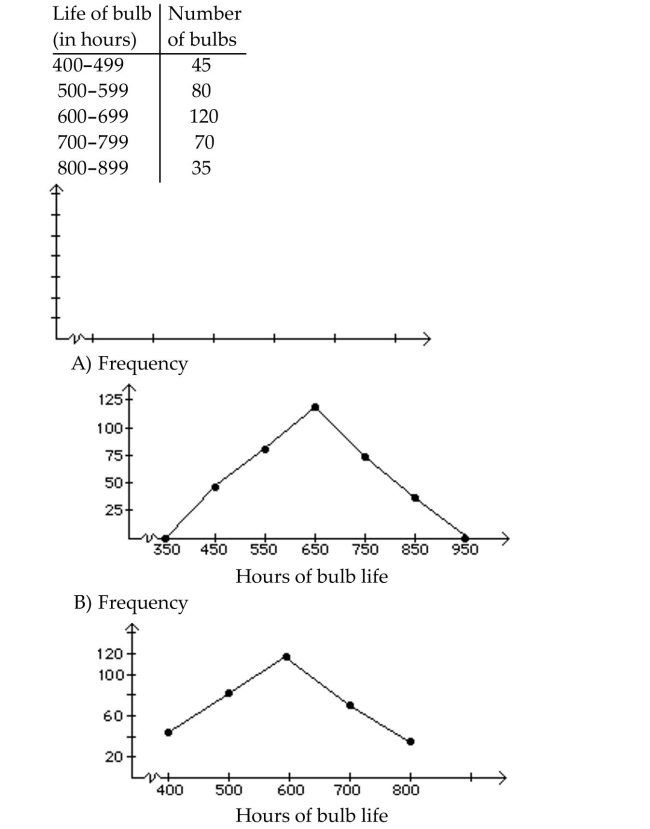
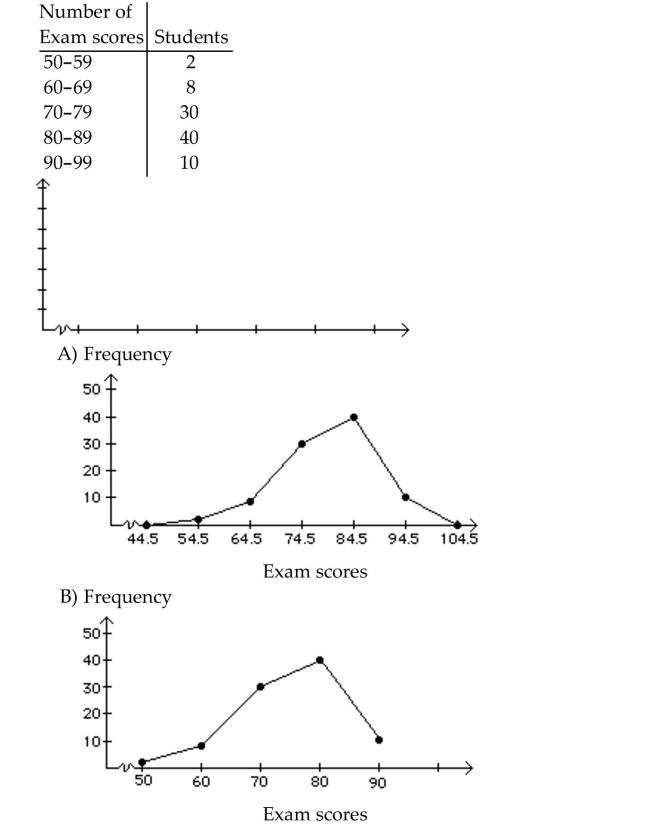
Construct a frequency polygon.
Question
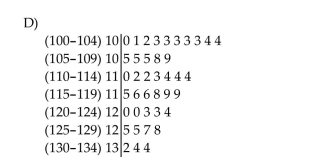
On a math test, the scores of 24 students were 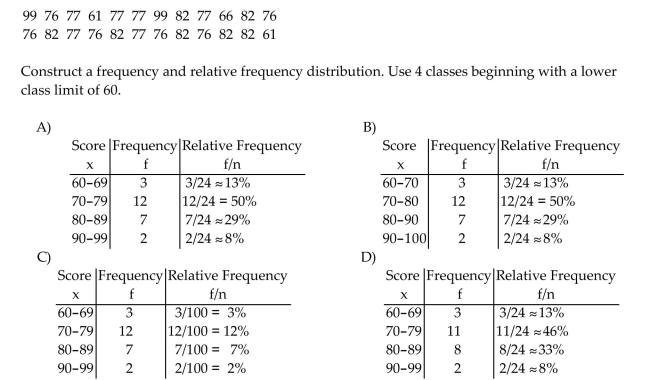
Question
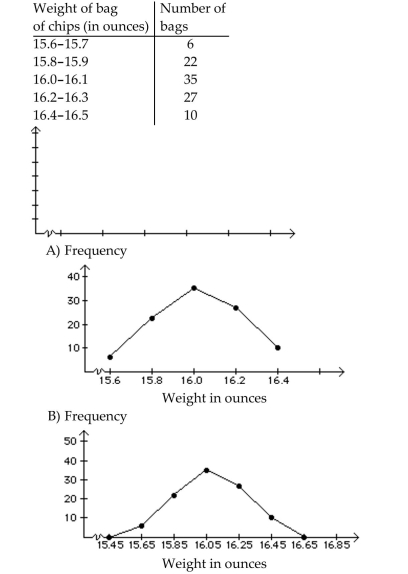
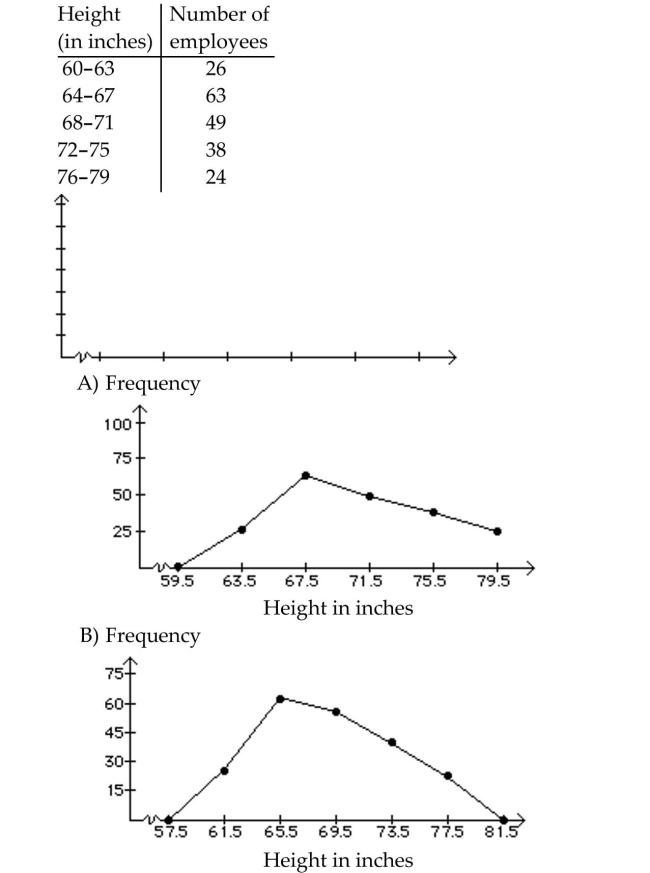
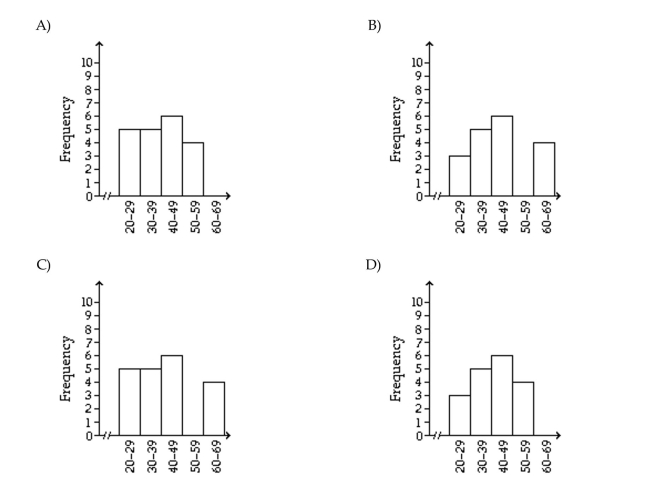
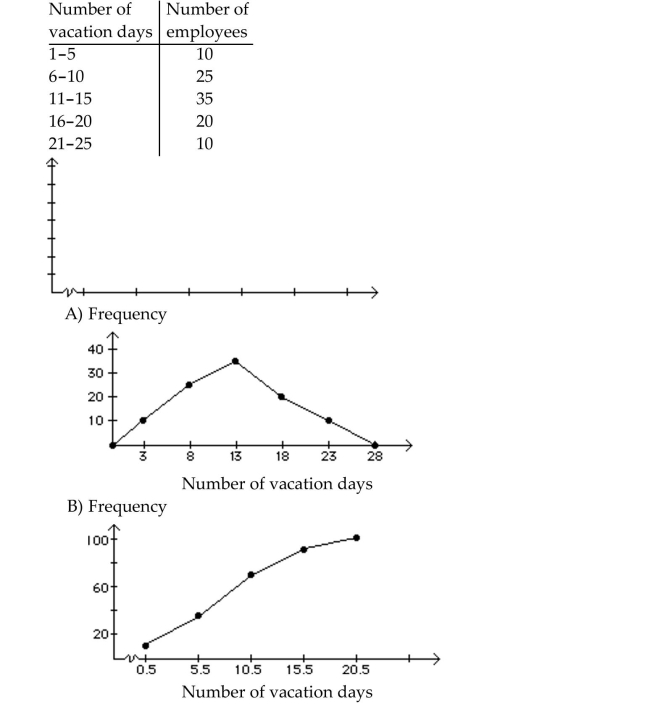
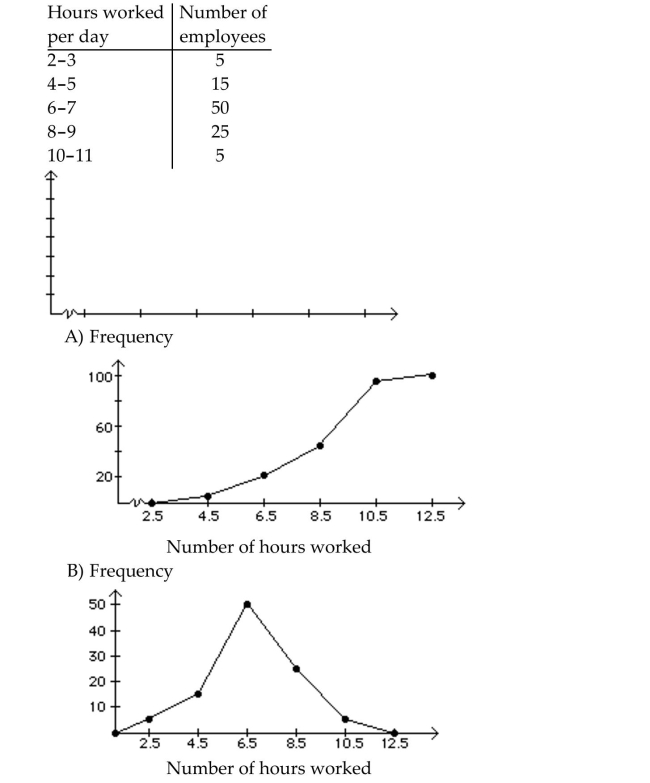
Construct a frequency polygon.
Question
Construct a frequency polygon.
Question
Construct the specified histogram.
In a survey, 20 voters were asked their age. The results are summarized in the frequency
table below. Construct a histogram .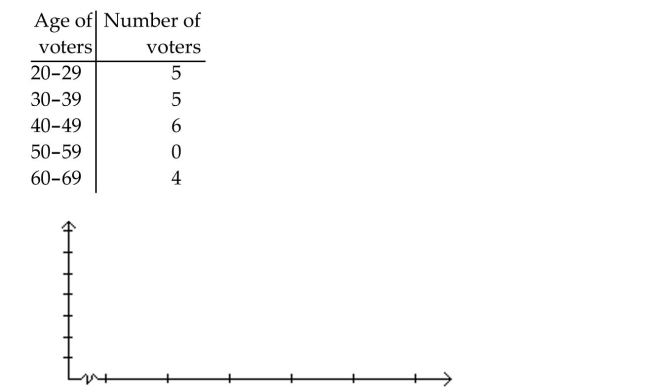
In a survey, 20 voters were asked their age. The results are summarized in the frequency
table below. Construct a histogram .
Question
Construct a stem and leaf display for given data.
Mr. Johnson wants to display his employees' ages in a graph. Below are their ages.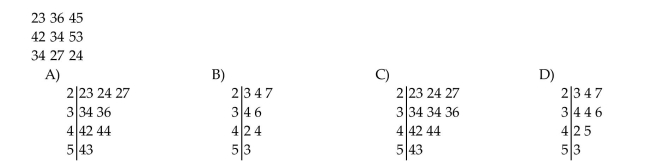
Mr. Johnson wants to display his employees' ages in a graph. Below are their ages.
Question
Construct a stem and leaf display for given data.
Here are the final scores for the last 16 games played by the local basketball team.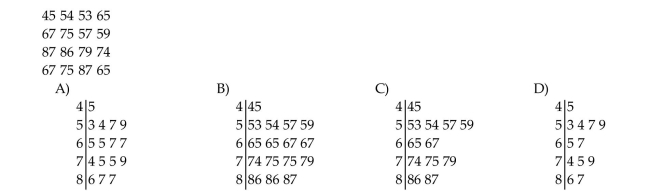
Here are the final scores for the last 16 games played by the local basketball team.
Question
Construct a frequency polygon.
Question
A car insurance company conducted a survey to find out how many car accidents people had been involved in. They selected a sample of 32 adults between the ages of 30 and 70 and asked each
Person how many accidents they had been involved in in the past ten years. The following data
Were obtained.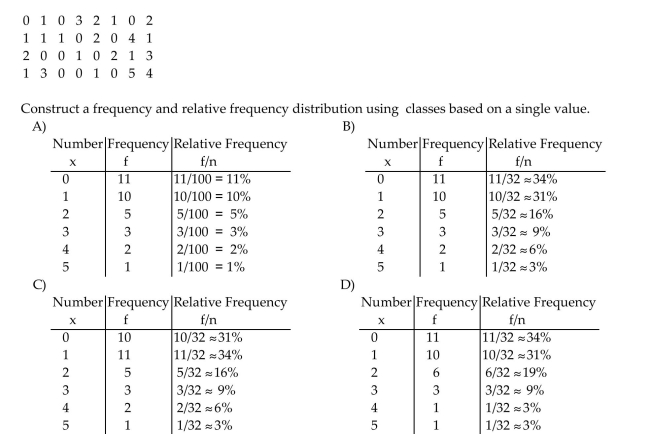
Person how many accidents they had been involved in in the past ten years. The following data
Were obtained.
Question
Construct the specified histogram.
The ages of the voters at a poll during a 20-minute period are listed below. Use five classes with a uniform width of 10 years, where the lower limit of the first class is 20 years.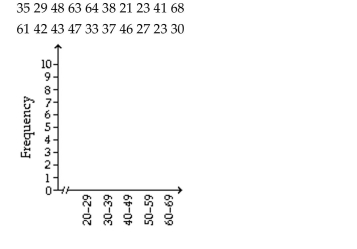
The ages of the voters at a poll during a 20-minute period are listed below. Use five classes with a uniform width of 10 years, where the lower limit of the first class is 20 years.
Question
Construct a frequency polygon.
Question
Construct a frequency polygon.
Question
Construct a frequency polygon.
Question
A medical research team studied the ages of patients who had strokes caused by stress. The ages of 34 patients who suffered stress strokes were as follows. 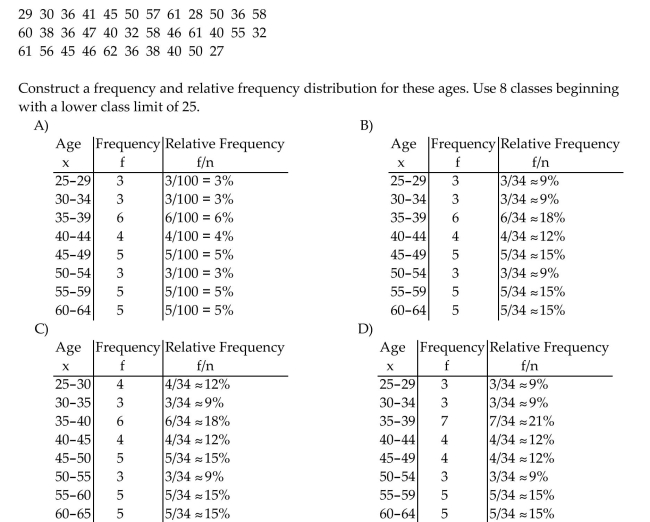
Question
Kevin asked some of his friends how many hours they had worked during the previous week at their after-school jobs. The results are shown below. 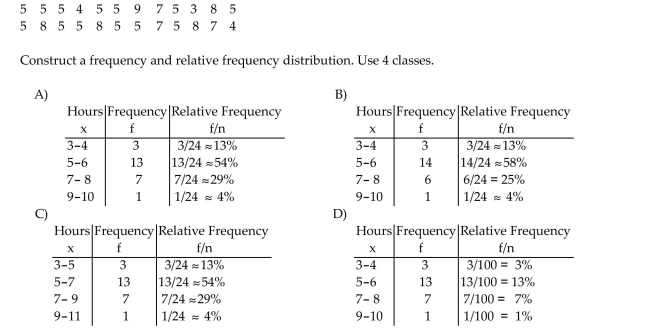
Question
Construct a stem and leaf display for given data.
The instructor of an introductory mathematics class has recorded the number of students attending his class in the last 4 weeks. Below are his recordings.
The instructor of an introductory mathematics class has recorded the number of students attending his class in the last 4 weeks. Below are his recordings.
Question
Construct a frequency polygon.
Question
Construct the specified histogram.
The frequency table below shows the number of days off in a given year for 30 police
detectives.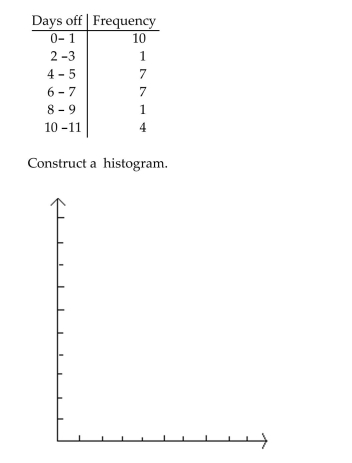
The frequency table below shows the number of days off in a given year for 30 police
detectives.
Question
Answer the question.
The bar graph below shows the number of students by major in the College of Arts and Sciences.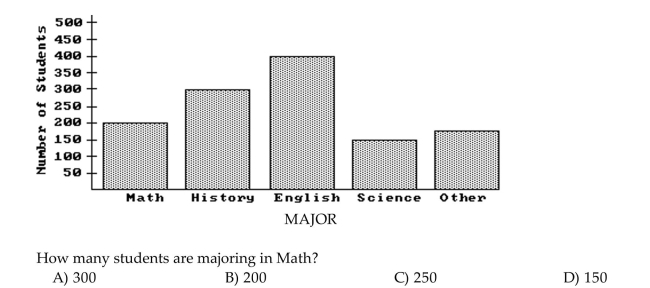
The bar graph below shows the number of students by major in the College of Arts and Sciences.
Question
Use this graph to answer the question. 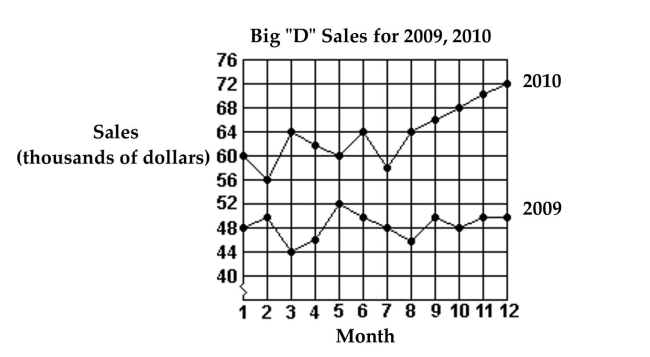
What was the total increase in sales from 2009 to 2010?
A)$182,000
B)$12,000
C)$1,342,000
D)$22,000
What was the total increase in sales from 2009 to 2010?
A)$182,000
B)$12,000
C)$1,342,000
D)$22,000
Question
Use this graph to answer the question.
What were the total sales for the first 6 months of 2010?
A)$366,000
B)$286,000
C)$64,000
D)$302,000
What were the total sales for the first 6 months of 2010?
A)$366,000
B)$286,000
C)$64,000
D)$302,000
Question
This double-bar graph shows the number of male (M)and female (F)athletes at a university over a four-year period.
Answer the question.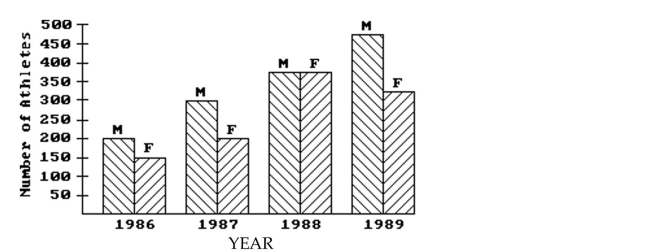
Which year had the greatest number of male athletes?
A)1988
B)1989
C)1986
D)1987
Answer the question.
Which year had the greatest number of male athletes?
A)1988
B)1989
C)1986
D)1987
Question
Use this graph to answer the question.
Which month in 2010 had the highest sales?
A)Month 6
B)Month 3
C)Month 12
D)Month 5
Which month in 2010 had the highest sales?
A)Month 6
B)Month 3
C)Month 12
D)Month 5
Question
Answer the question.
The bar graph below shows the number of students by major in the College of Arts and Sciences.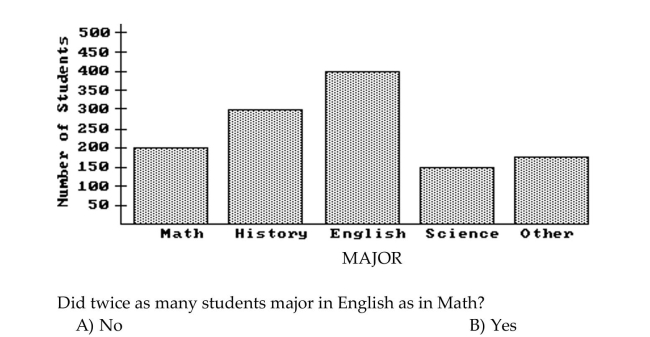
The bar graph below shows the number of students by major in the College of Arts and Sciences.
Question
Construct a stem and leaf display for given data.
The numbers of attendees at an annual convention, for each of the last 20 years, are given below. Use a double-stem display.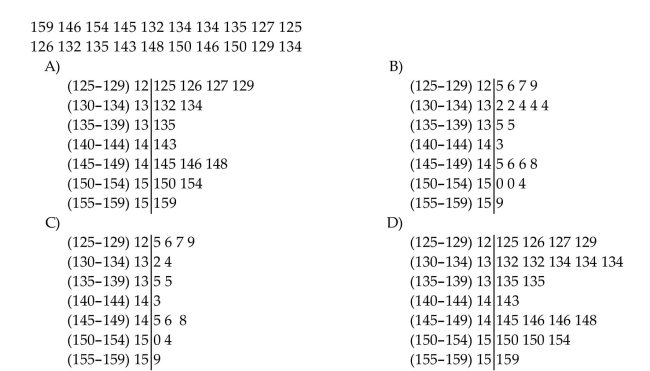
The numbers of attendees at an annual convention, for each of the last 20 years, are given below. Use a double-stem display.
Question
Use this graph to answer the question.
What were the total sales for the first 6 months of 2009?
A)$240,000
B)$366,000
C)$290,000
D)$46,000
What were the total sales for the first 6 months of 2009?
A)$240,000
B)$366,000
C)$290,000
D)$46,000
Question
Answer the question.
The bar graph below shows the number of students by major in the College of Arts and Sciences.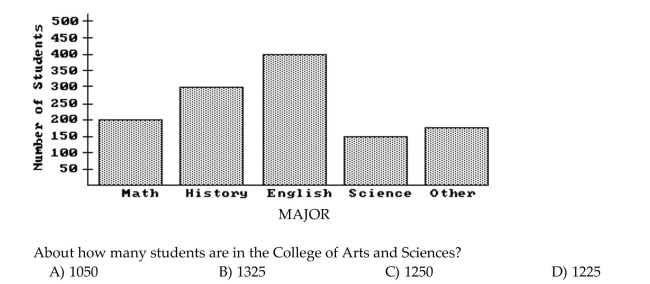
The bar graph below shows the number of students by major in the College of Arts and Sciences.
Question
Use this graph to answer the question.
What month in 2009 had the highest sales?
A)Month 3
B)Month 5
C)Month 2
D)Month 12
What month in 2009 had the highest sales?
A)Month 3
B)Month 5
C)Month 2
D)Month 12
Question
Answer the question.
The bar graph below shows the number of students by major in the College of Arts and Sciences.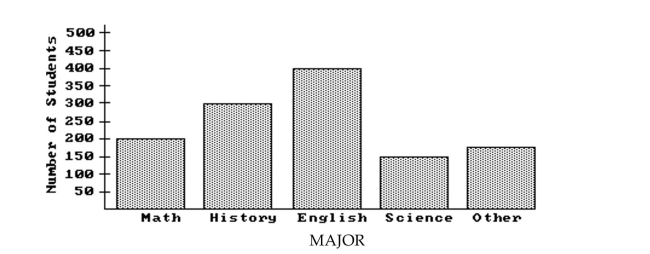 Did twice as many students major in Math as in Science?
A)Yes
B)No
The bar graph below shows the number of students by major in the College of Arts and Sciences.
Did twice as many students major in Math as in Science?A)Yes
B)No
Question
This double-bar graph shows the number of male (M)and female (F)athletes at a university over a four-year period.
Answer the question.
Which year had the smallest number of male athletes?
A)1989
B)1986
C)1988
D)1987
Answer the question.
Which year had the smallest number of male athletes?
A)1989
B)1986
C)1988
D)1987
Question
Use this graph to answer the question.
What were the total sales for 2010?
A)$60,000
B)$578,000
C)$764,000
D)$72,000
What were the total sales for 2010?
A)$60,000
B)$578,000
C)$764,000
D)$72,000
Question
Answer the question.
The bar graph below shows the number of students by major in the College of Arts and Sciences.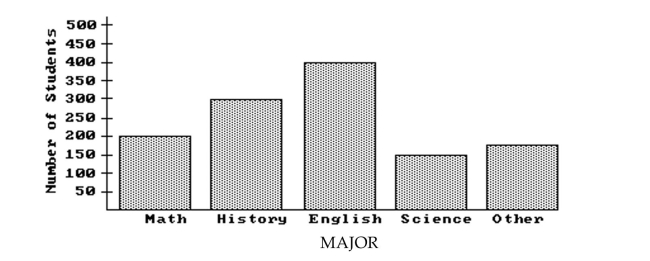 Did twice as many students major in History as in Science?
A)No
B)Yes
The bar graph below shows the number of students by major in the College of Arts and Sciences.
Did twice as many students major in History as in Science?A)No
B)Yes
Question
Use this graph to answer the question.
Which month in 2009 had the lowest sales?
A)Month 2
B)Month 8
C)Month 3
D)Month 6
Which month in 2009 had the lowest sales?
A)Month 2
B)Month 8
C)Month 3
D)Month 6
Question
Use this graph to answer the question.
What month in 2010 had the lowest sales?
A)Month 3
B)Month 5
C)Month 2
D)Month 12
What month in 2010 had the lowest sales?
A)Month 3
B)Month 5
C)Month 2
D)Month 12
Question
Answer the question.
The bar graph below shows the number of students by major in the College of Arts and Sciences.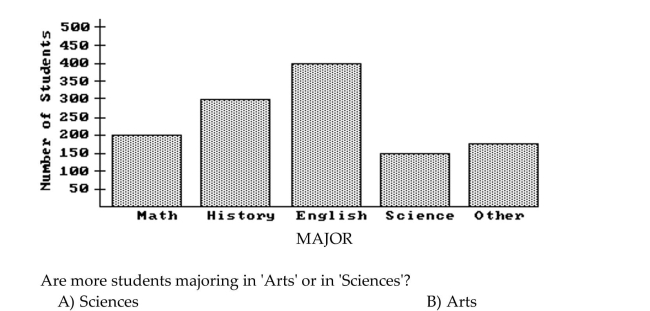
The bar graph below shows the number of students by major in the College of Arts and Sciences.
Question
Use this graph to answer the question.
What was the total increase in sales for the first 6 months from 2009 to 2010?
A)$18,000
B)$652,000
C)$12,000
D)$76,000
What was the total increase in sales for the first 6 months from 2009 to 2010?
A)$18,000
B)$652,000
C)$12,000
D)$76,000
Question
Construct a stem and leaf display for given data.
A professional basketball team plays 80 games a season. Below are the highest scores reached by one particular team. Use a double-stem display.
A professional basketball team plays 80 games a season. Below are the highest scores reached by one particular team. Use a double-stem display.
Question
Use this graph to answer the question.
What were the total sales for 2009?
A)$48,000
B)$582,000
C)$764,000
D)$50,000
What were the total sales for 2009?
A)$48,000
B)$582,000
C)$764,000
D)$50,000
Question
This double-bar graph shows the number of male (M)and female (F)athletes at a university over a four-year period.
Answer the question.
How many students were involved in athletics in 1989?
A)775
B)825
C)800
D)750
Answer the question.
How many students were involved in athletics in 1989?
A)775
B)825
C)800
D)750
Question
This double-bar graph shows the number of male (M)and female (F)athletes at a university over a four-year period.
Answer the question.
Which year had the same number of male and female athletes?
A)1988
B)1986
C)1987
D)1989
Answer the question.
Which year had the same number of male and female athletes?
A)1988
B)1986
C)1987
D)1989
Question
In a school survey, students showed these preferences for instructional materials. Answer the question. 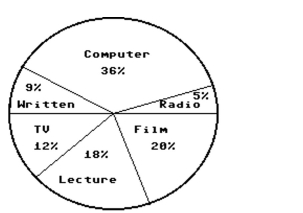
About how many students would you expect to prefer radio in a school of 600 students?
A)About 30 students
B)About 216 students
C)About 108 students
D)About 5 students
About how many students would you expect to prefer radio in a school of 600 students?
A)About 30 students
B)About 216 students
C)About 108 students
D)About 5 students
Question
In a school survey, students showed these preferences for instructional materials. Answer the question.
How many degrees are in the central angle for the "Computer" sector?
A)64.8°
B)129.6°
C)36°
D)10°
How many degrees are in the central angle for the "Computer" sector?
A)64.8°
B)129.6°
C)36°
D)10°
Question
In a school survey, students showed these preferences for instructional materials. Answer the question.
About how many students would you expect to prefer lectures in a school of 900 students?
A)About 324 students
B)About 162 students
C)About 180 students
D)About 18 students
About how many students would you expect to prefer lectures in a school of 900 students?
A)About 324 students
B)About 162 students
C)About 180 students
D)About 18 students
Question
Use the information to complete a circle graph. Note that the circle is divided into 100 equal sections.
Intended major of high school students: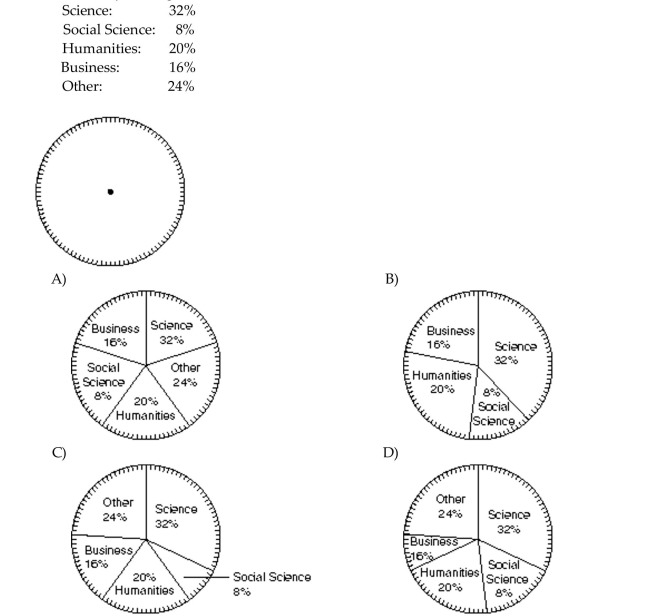
Intended major of high school students:
Question
In a school survey, students showed these preferences for instructional materials. Answer the question.
About how many students would you expect to prefer computers in a school of 650 students?
A)About 234 students
B)About 130 students
C)About 117 students
D)About 36 students
About how many students would you expect to prefer computers in a school of 650 students?
A)About 234 students
B)About 130 students
C)About 117 students
D)About 36 students
Question
This double-bar graph shows the number of male (M)and female (F)athletes at a university over a four-year period.
Answer the question.
Which year had the greatest number of female athletes?
A)1987
B)1988
C)1986
D)1989
Answer the question.
Which year had the greatest number of female athletes?
A)1987
B)1988
C)1986
D)1989
Question
This double-bar graph shows the number of male (M)and female (F)athletes at a university over a four-year period.
Answer the question.
What percentage of all students involved in athletics in 1989 was male? (Round to the nearest percent.)
A)41%
B)35%
C)59%
D)68%
Answer the question.
What percentage of all students involved in athletics in 1989 was male? (Round to the nearest percent.)
A)41%
B)35%
C)59%
D)68%
Question
This double-bar graph shows the number of male (M)and female (F)athletes at a university over a four-year period.
Answer the question.
Which year had the smallest number of female athletes?
A)1988
B)1987
C)1986
D)1989
Answer the question.
Which year had the smallest number of female athletes?
A)1988
B)1987
C)1986
D)1989
Question
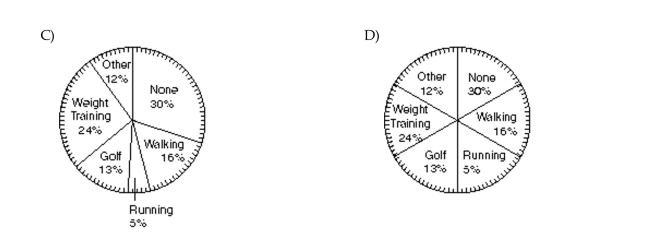
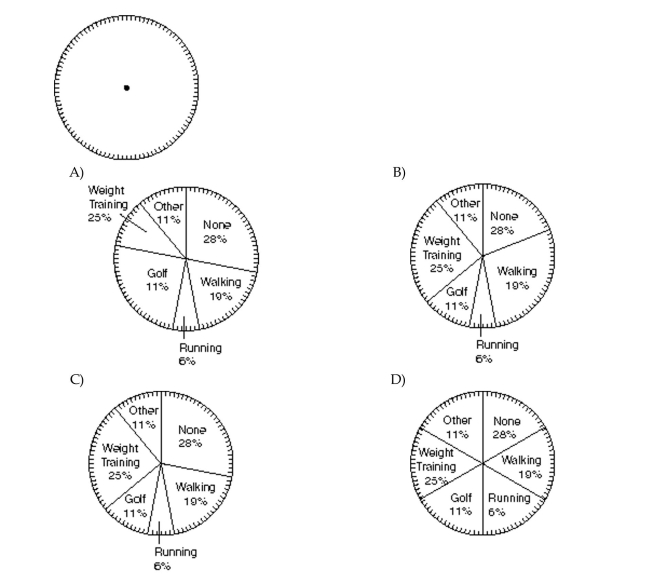
Use the information to complete a circle graph. Note that the circle is divided into 100 equal sections.
Main form of exercise for employees of one company: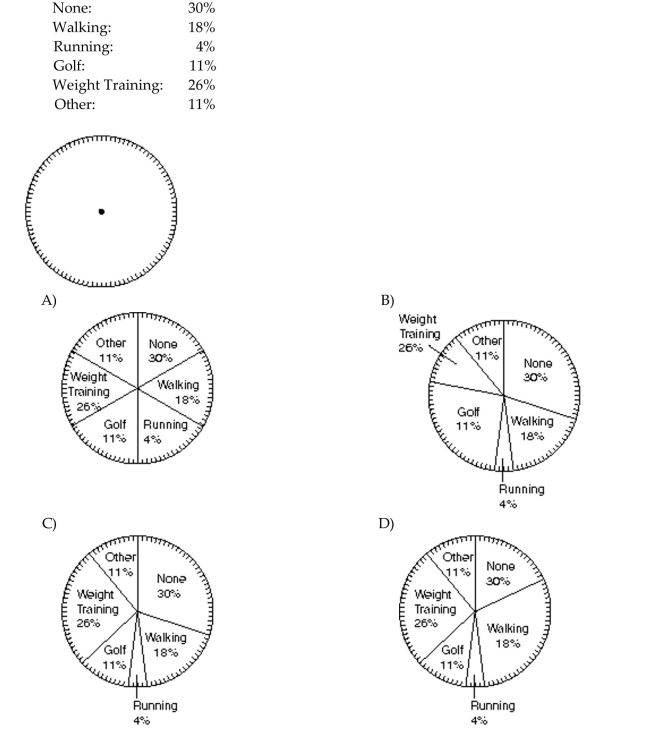
Main form of exercise for employees of one company:
Question
This double-bar graph shows the number of male (M)and female (F)athletes at a university over a four-year period.
Answer the question.
Has the total number of students involved in athletics increased each year?
A)Yes.
B)No.
Answer the question.
Has the total number of students involved in athletics increased each year?
A)Yes.
B)No.
Question
In a school survey, students showed these preferences for instructional materials. Answer the question.
How many degrees are in the central angle for the "radio" sector?
A)5°
B)9°
C)18°
D)180°
How many degrees are in the central angle for the "radio" sector?
A)5°
B)9°
C)18°
D)180°
Question
In a school survey, students showed these preferences for instructional materials. Answer the question.
How many degrees are in the central angle for the "Lecture" sector?
A)64.8°
B)20°
C)32.4°
D)18°
How many degrees are in the central angle for the "Lecture" sector?
A)64.8°
B)20°
C)32.4°
D)18°
Question
In a school survey, students showed these preferences for instructional materials. Answer the question.
How many degrees are in the central angle for the "TV" sector?
A)21.6°
B)43.2°
C)30°
D)12°
How many degrees are in the central angle for the "TV" sector?
A)21.6°
B)43.2°
C)30°
D)12°
Question
In a school survey, students showed these preferences for instructional materials. Answer the question.
About how many students would you expect to prefer written materials in a school of 400 students?
A)About 144 students
B)About 72 students
C)About 9 students
D)About 36 students
About how many students would you expect to prefer written materials in a school of 400 students?
A)About 144 students
B)About 72 students
C)About 9 students
D)About 36 students
Question
This double-bar graph shows the number of male (M)and female (F)athletes at a university over a four-year period.
Answer the question.
What percentage of all students involved in athletics in 1986 was female? (Round to the nearest percent.)
A)57%
B)43%
C)75%
D)14%
Answer the question.
What percentage of all students involved in athletics in 1986 was female? (Round to the nearest percent.)
A)57%
B)43%
C)75%
D)14%
Question
In a school survey, students showed these preferences for instructional materials. Answer the question.
About how many students would you expect to prefer films in a school of 1000 students?
A)About 200 students
B)About 180 students
C)About 20 students
D)About 120 students
About how many students would you expect to prefer films in a school of 1000 students?
A)About 200 students
B)About 180 students
C)About 20 students
D)About 120 students
Question
This double-bar graph shows the number of male (M)and female (F)athletes at a university over a four-year period.
Answer the question.
What is the only year in which the number of female athletes declined from its previous value?
A)1986
B)1987
C)1989
D)1988
Answer the question.
What is the only year in which the number of female athletes declined from its previous value?
A)1986
B)1987
C)1989
D)1988
Question
In a school survey, students showed these preferences for instructional materials. Answer the question.
About how many students would you expect to prefer TV in a school of 650 students?
A)About 130 students
B)About 78 students
C)About 12 students
D)About 117 students
About how many students would you expect to prefer TV in a school of 650 students?
A)About 130 students
B)About 78 students
C)About 12 students
D)About 117 students
Question
Use the graph to answer the question.
 Mike decides to buy shares of companies X and Y, which were initially selling for the same price. The changes in each stock's value over 90 days are shown in the graph above. When did the two
Stocks have the same value, other than when he bought them?
A)day 80
B)day 50
C)day 85
D)day 90
Mike decides to buy shares of companies X and Y, which were initially selling for the same price. The changes in each stock's value over 90 days are shown in the graph above. When did the twoStocks have the same value, other than when he bought them?
A)day 80
B)day 50
C)day 85
D)day 90
Question
Use the graph to answer the question.
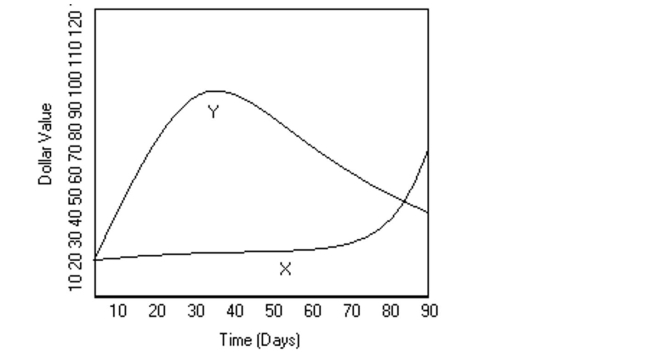 Mike decides to buy shares of companies X and Y, which were initially selling for the same price. The changes in each stock's value over 90 days are shown in the graph above. Using the trend of
The graph at 90 days, do you expect the value of Stock X to increase or decrease over the upcoming
Days?
A)Decrease
B)Increase
Mike decides to buy shares of companies X and Y, which were initially selling for the same price. The changes in each stock's value over 90 days are shown in the graph above. Using the trend ofThe graph at 90 days, do you expect the value of Stock X to increase or decrease over the upcoming
Days?
A)Decrease
B)Increase
Question
Find the indicated probability.
A relative frequency distribution is given below for the size of families in one U.S. city.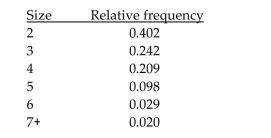 A family is selected at random. Find the probability that the size of the family is between 2 and 5 inclusive. Round your answer to three decimal places.
A)0.951
B)0.5
C)0.853
D)0.451
A relative frequency distribution is given below for the size of families in one U.S. city.
A family is selected at random. Find the probability that the size of the family is between 2 and 5 inclusive. Round your answer to three decimal places.A)0.951
B)0.5
C)0.853
D)0.451
Question
Find the indicated probability.
In a survey, 50 students were asked to name their favorite color. The table below shows the results.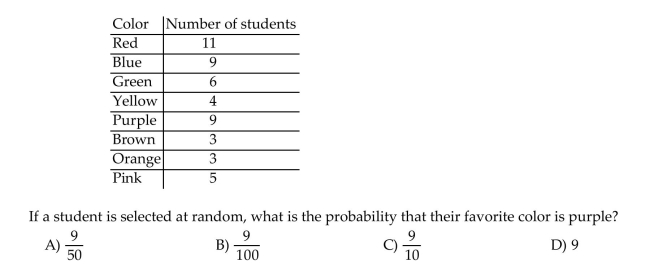
In a survey, 50 students were asked to name their favorite color. The table below shows the results.
Question
Find the indicated probability.
The age distribution of students at a community college is given below.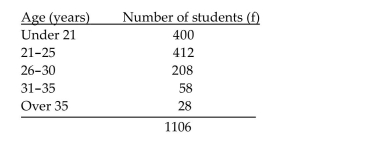 A student from the community college is selected at random. Find the probability that the student is between 26 and 35 inclusive. Round your answer to three decimal places.
A)0.188
B)0.052
C)266
D)0.241
The age distribution of students at a community college is given below.
A student from the community college is selected at random. Find the probability that the student is between 26 and 35 inclusive. Round your answer to three decimal places.A)0.188
B)0.052
C)266
D)0.241
Question
Use the information to complete a circle graph. Note that the circle is divided into 100 equal sections.
Main form of exercise for employees of one company: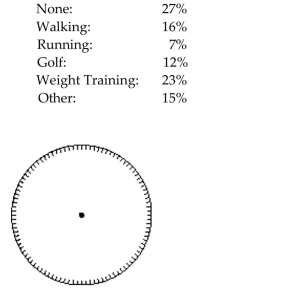
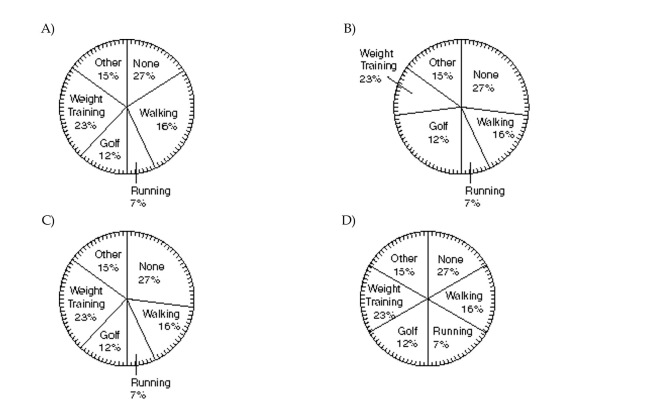
Main form of exercise for employees of one company:
Question
Find the indicated probability.
The table shows the percentage of college students who prefer a given pizza topping.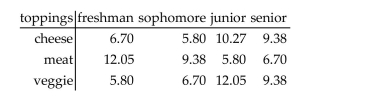 What is the probability that a randomly selected junior prefers meat toppings? Round to the nearest hundredth.
A)0.21
B)0.06
C)0.35
D)0.17
The table shows the percentage of college students who prefer a given pizza topping.
What is the probability that a randomly selected junior prefers meat toppings? Round to the nearest hundredth.A)0.21
B)0.06
C)0.35
D)0.17
Question
Use the graph to answer the question.
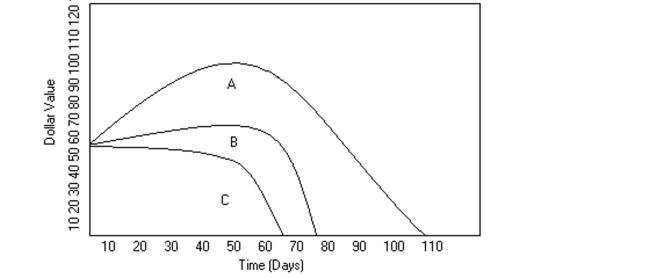 Mike decides to buy shares of companies A, B, and C, which were initially selling for the same price. The changes in each stock's value are shown in the graph above. Knowing what he knows
Now, after how many days should he have sold in his stock in company A?
A)30
B)50
C)60
D)80
Mike decides to buy shares of companies A, B, and C, which were initially selling for the same price. The changes in each stock's value are shown in the graph above. Knowing what he knowsNow, after how many days should he have sold in his stock in company A?
A)30
B)50
C)60
D)80
Question
Find the indicated probability.
A relative frequency distribution is given below for the size of families in one U.S. city.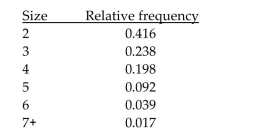 A family is selected at random. Find the probability that the size of the family is less than 5. Round your answer to three decimal places.
A)0.528
B)0.436
C)0.852
D)0.092
A relative frequency distribution is given below for the size of families in one U.S. city.
A family is selected at random. Find the probability that the size of the family is less than 5. Round your answer to three decimal places.A)0.528
B)0.436
C)0.852
D)0.092
Question
Find the indicated probability.
The table shows the percentage of college students who prefer a given pizza topping.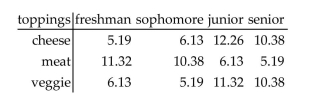 What is the probability that a randomly selected student prefers cheese toppings? Round to the nearest hundredth.
A)0.31
B)0.33
C)0.34
D)0.10
The table shows the percentage of college students who prefer a given pizza topping.
What is the probability that a randomly selected student prefers cheese toppings? Round to the nearest hundredth.A)0.31
B)0.33
C)0.34
D)0.10
Question
Use the graph to answer the question.
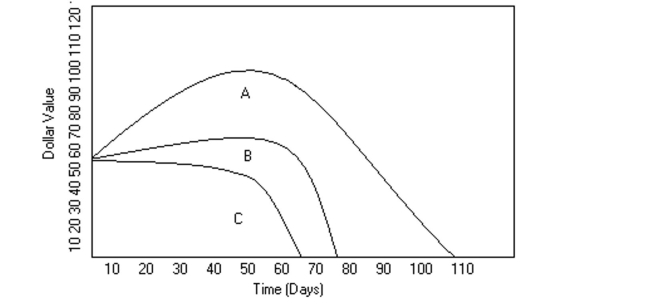 Mike decides to buy shares of companies A, B, and C, which were initially selling for the same price. The changes in each stock's value are shown in the graph above. After how many days did
Stock C's value go below $20?
A)30
B)40
C)60
D)80
Mike decides to buy shares of companies A, B, and C, which were initially selling for the same price. The changes in each stock's value are shown in the graph above. After how many days didStock C's value go below $20?
A)30
B)40
C)60
D)80
Question
Use the graph to answer the question.
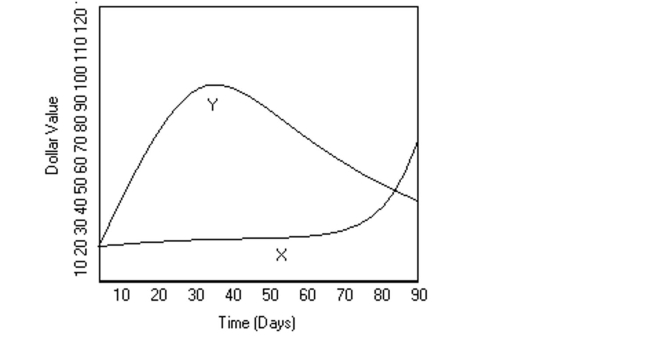 Mike decides to buy shares of companies X and Y, which were initially selling for the same price. The changes in each stock's value over 90 days are shown in the graph above. At its peak, about
How much more was stock Y worth than X?
A)$65
B)$90
C)$45
D)$75
Mike decides to buy shares of companies X and Y, which were initially selling for the same price. The changes in each stock's value over 90 days are shown in the graph above. At its peak, aboutHow much more was stock Y worth than X?
A)$65
B)$90
C)$45
D)$75
Question
Solve the problem.
Sixteen workers were surveyed about how long it takes them to travel to work each day. The data below are given in minutes. Represent the data in a double-stem display.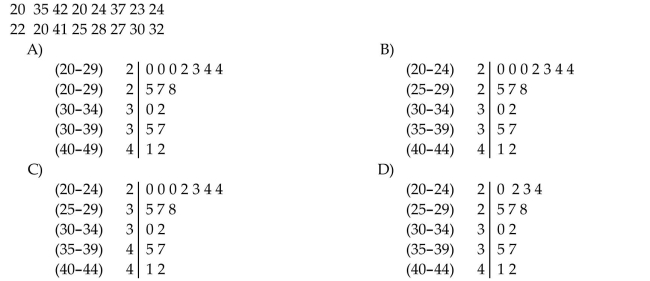
Sixteen workers were surveyed about how long it takes them to travel to work each day. The data below are given in minutes. Represent the data in a double-stem display.
Question
Use the information to complete a circle graph. Note that the circle is divided into 100 equal sections.
Main form of exercise for employees of one company: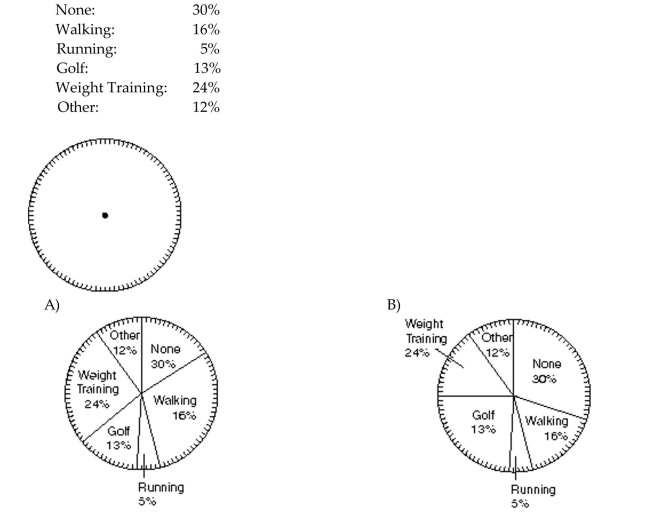
Main form of exercise for employees of one company:
Question
Find the indicated probability.
The age distribution of students at a community college is given below.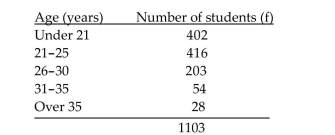 A student from the community college is selected at random. Find the probability that the student is at least 31. Round your answer to three decimal places.
A)82
B)0.926
C)0.074
D)0.049
The age distribution of students at a community college is given below.
A student from the community college is selected at random. Find the probability that the student is at least 31. Round your answer to three decimal places.A)82
B)0.926
C)0.074
D)0.049
Question
Use the graph to answer the question.
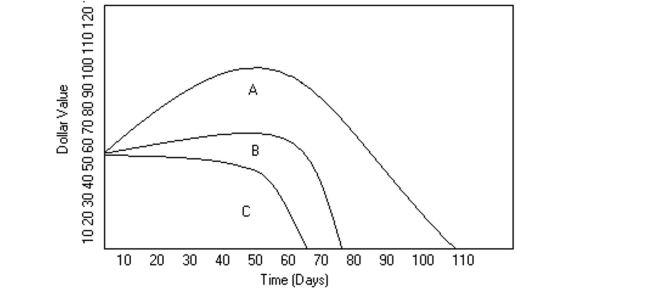 Mike decides to buy shares of companies A, B, and C, which were initially selling for the same price. The changes in each stock's value are shown in the graph above. At its peak, stock A was
Valued at approximately how much more than either B or C?
A)$15
B)$30
C)$10
D)$35
Mike decides to buy shares of companies A, B, and C, which were initially selling for the same price. The changes in each stock's value are shown in the graph above. At its peak, stock A wasValued at approximately how much more than either B or C?
A)$15
B)$30
C)$10
D)$35
Question
Use the graph to answer the question.
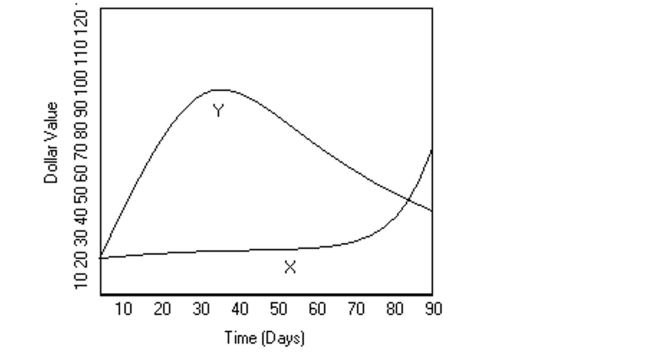 Mike decides to buy shares of companies X and Y, which were initially selling for the same price. The changes in each stock's value over 90 days are shown in the graph above. At day 90, Mike
Decides to buy more of one of the stocks. Which stock should he choose?
A)X
B)Y
Mike decides to buy shares of companies X and Y, which were initially selling for the same price. The changes in each stock's value over 90 days are shown in the graph above. At day 90, MikeDecides to buy more of one of the stocks. Which stock should he choose?
A)X
B)Y
Question
Make a bar graph to represent the data.
The following table shows the number of female infants born at Hospital X on New Year's
Day (Jan. 1). Create a vertical bar graph.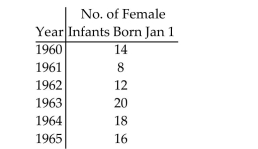
The following table shows the number of female infants born at Hospital X on New Year's
Day (Jan. 1). Create a vertical bar graph.
Question
Use the graph to answer the question.
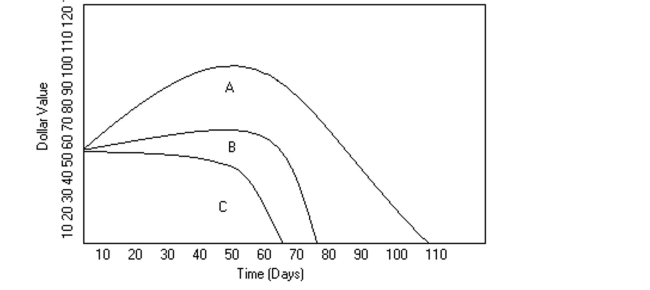 Mike decides to buy shares of companies A, B, and C, which were initially selling for the same price. The changes in each stock's value are shown in the graph above. Could Mike have ever made
A profit off of stock C if he had sold at the right time?
A)Yes
B)No
Mike decides to buy shares of companies A, B, and C, which were initially selling for the same price. The changes in each stock's value are shown in the graph above. Could Mike have ever madeA profit off of stock C if he had sold at the right time?
A)Yes
B)No
Question
Use the information to complete a circle graph. Note that the circle is divided into 100 equal sections.
Main form of exercise for employees of one company: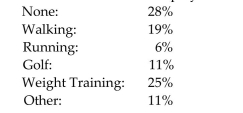
Main form of exercise for employees of one company:

Unlock Deck
Sign up to unlock the cards in this deck!
Unlock Deck
Unlock Deck
1/152
Play
Full screen (f)
Deck 12: Statistics
1
Construct a stem and leaf display for given data.
The numbers below represent the commute times (in minutes)for a group of college students.
The numbers below represent the commute times (in minutes)for a group of college students.
C
2
Construct a stem and leaf display for given data.
The ages of the instructors at a local college are given below.
The ages of the instructors at a local college are given below.
B
3
Construct a frequency polygon.
B
4
On a math test, the scores of 24 students were
Unlock Deck
Unlock for access to all 152 flashcards in this deck.
Unlock Deck
k this deck
5
Construct a frequency polygon.
Unlock Deck
Unlock for access to all 152 flashcards in this deck.
Unlock Deck
k this deck
6
Construct a frequency polygon.
Unlock Deck
Unlock for access to all 152 flashcards in this deck.
Unlock Deck
k this deck
7
Construct the specified histogram.
In a survey, 20 voters were asked their age. The results are summarized in the frequency
table below. Construct a histogram .
In a survey, 20 voters were asked their age. The results are summarized in the frequency
table below. Construct a histogram .
Unlock Deck
Unlock for access to all 152 flashcards in this deck.
Unlock Deck
k this deck
8
Construct a stem and leaf display for given data.
Mr. Johnson wants to display his employees' ages in a graph. Below are their ages.
Mr. Johnson wants to display his employees' ages in a graph. Below are their ages.
Unlock Deck
Unlock for access to all 152 flashcards in this deck.
Unlock Deck
k this deck
9
Construct a stem and leaf display for given data.
Here are the final scores for the last 16 games played by the local basketball team.
Here are the final scores for the last 16 games played by the local basketball team.
Unlock Deck
Unlock for access to all 152 flashcards in this deck.
Unlock Deck
k this deck
10
Construct a frequency polygon.
Unlock Deck
Unlock for access to all 152 flashcards in this deck.
Unlock Deck
k this deck
11
A car insurance company conducted a survey to find out how many car accidents people had been involved in. They selected a sample of 32 adults between the ages of 30 and 70 and asked each
Person how many accidents they had been involved in in the past ten years. The following data
Were obtained.
Person how many accidents they had been involved in in the past ten years. The following data
Were obtained.
Unlock Deck
Unlock for access to all 152 flashcards in this deck.
Unlock Deck
k this deck
12
Construct the specified histogram.
The ages of the voters at a poll during a 20-minute period are listed below. Use five classes with a uniform width of 10 years, where the lower limit of the first class is 20 years.
The ages of the voters at a poll during a 20-minute period are listed below. Use five classes with a uniform width of 10 years, where the lower limit of the first class is 20 years.
Unlock Deck
Unlock for access to all 152 flashcards in this deck.
Unlock Deck
k this deck
13
Construct a frequency polygon.
Unlock Deck
Unlock for access to all 152 flashcards in this deck.
Unlock Deck
k this deck
14
Construct a frequency polygon.
Unlock Deck
Unlock for access to all 152 flashcards in this deck.
Unlock Deck
k this deck
15
Construct a frequency polygon.
Unlock Deck
Unlock for access to all 152 flashcards in this deck.
Unlock Deck
k this deck
16
A medical research team studied the ages of patients who had strokes caused by stress. The ages of 34 patients who suffered stress strokes were as follows.
Unlock Deck
Unlock for access to all 152 flashcards in this deck.
Unlock Deck
k this deck
17
Kevin asked some of his friends how many hours they had worked during the previous week at their after-school jobs. The results are shown below.
Unlock Deck
Unlock for access to all 152 flashcards in this deck.
Unlock Deck
k this deck
18
Construct a stem and leaf display for given data.
The instructor of an introductory mathematics class has recorded the number of students attending his class in the last 4 weeks. Below are his recordings.
The instructor of an introductory mathematics class has recorded the number of students attending his class in the last 4 weeks. Below are his recordings.
Unlock Deck
Unlock for access to all 152 flashcards in this deck.
Unlock Deck
k this deck
19
Construct a frequency polygon.
Unlock Deck
Unlock for access to all 152 flashcards in this deck.
Unlock Deck
k this deck
20
Construct the specified histogram.
The frequency table below shows the number of days off in a given year for 30 police
detectives.
The frequency table below shows the number of days off in a given year for 30 police
detectives.
Unlock Deck
Unlock for access to all 152 flashcards in this deck.
Unlock Deck
k this deck
21
Answer the question.
The bar graph below shows the number of students by major in the College of Arts and Sciences.
The bar graph below shows the number of students by major in the College of Arts and Sciences.
Unlock Deck
Unlock for access to all 152 flashcards in this deck.
Unlock Deck
k this deck
22
Use this graph to answer the question.
What was the total increase in sales from 2009 to 2010?
A)$182,000
B)$12,000
C)$1,342,000
D)$22,000
What was the total increase in sales from 2009 to 2010?
A)$182,000
B)$12,000
C)$1,342,000
D)$22,000
Unlock Deck
Unlock for access to all 152 flashcards in this deck.
Unlock Deck
k this deck
23
Use this graph to answer the question.
What were the total sales for the first 6 months of 2010?
A)$366,000
B)$286,000
C)$64,000
D)$302,000
What were the total sales for the first 6 months of 2010?
A)$366,000
B)$286,000
C)$64,000
D)$302,000
Unlock Deck
Unlock for access to all 152 flashcards in this deck.
Unlock Deck
k this deck
24
This double-bar graph shows the number of male (M)and female (F)athletes at a university over a four-year period.
Answer the question.
Which year had the greatest number of male athletes?
A)1988
B)1989
C)1986
D)1987
Answer the question.
Which year had the greatest number of male athletes?
A)1988
B)1989
C)1986
D)1987
Unlock Deck
Unlock for access to all 152 flashcards in this deck.
Unlock Deck
k this deck
25
Use this graph to answer the question.
Which month in 2010 had the highest sales?
A)Month 6
B)Month 3
C)Month 12
D)Month 5
Which month in 2010 had the highest sales?
A)Month 6
B)Month 3
C)Month 12
D)Month 5
Unlock Deck
Unlock for access to all 152 flashcards in this deck.
Unlock Deck
k this deck
26
Answer the question.
The bar graph below shows the number of students by major in the College of Arts and Sciences.
The bar graph below shows the number of students by major in the College of Arts and Sciences.
Unlock Deck
Unlock for access to all 152 flashcards in this deck.
Unlock Deck
k this deck
27
Construct a stem and leaf display for given data.
The numbers of attendees at an annual convention, for each of the last 20 years, are given below. Use a double-stem display.
The numbers of attendees at an annual convention, for each of the last 20 years, are given below. Use a double-stem display.
Unlock Deck
Unlock for access to all 152 flashcards in this deck.
Unlock Deck
k this deck
28
Use this graph to answer the question.
What were the total sales for the first 6 months of 2009?
A)$240,000
B)$366,000
C)$290,000
D)$46,000
What were the total sales for the first 6 months of 2009?
A)$240,000
B)$366,000
C)$290,000
D)$46,000
Unlock Deck
Unlock for access to all 152 flashcards in this deck.
Unlock Deck
k this deck
29
Answer the question.
The bar graph below shows the number of students by major in the College of Arts and Sciences.
The bar graph below shows the number of students by major in the College of Arts and Sciences.
Unlock Deck
Unlock for access to all 152 flashcards in this deck.
Unlock Deck
k this deck
30
Use this graph to answer the question.
What month in 2009 had the highest sales?
A)Month 3
B)Month 5
C)Month 2
D)Month 12
What month in 2009 had the highest sales?
A)Month 3
B)Month 5
C)Month 2
D)Month 12
Unlock Deck
Unlock for access to all 152 flashcards in this deck.
Unlock Deck
k this deck
31
Answer the question.
The bar graph below shows the number of students by major in the College of Arts and Sciences. Did twice as many students major in Math as in Science?
A)Yes
B)No
The bar graph below shows the number of students by major in the College of Arts and Sciences.
Did twice as many students major in Math as in Science?A)Yes
B)No
Unlock Deck
Unlock for access to all 152 flashcards in this deck.
Unlock Deck
k this deck
32
This double-bar graph shows the number of male (M)and female (F)athletes at a university over a four-year period.
Answer the question.
Which year had the smallest number of male athletes?
A)1989
B)1986
C)1988
D)1987
Answer the question.
Which year had the smallest number of male athletes?
A)1989
B)1986
C)1988
D)1987
Unlock Deck
Unlock for access to all 152 flashcards in this deck.
Unlock Deck
k this deck
33
Use this graph to answer the question.
What were the total sales for 2010?
A)$60,000
B)$578,000
C)$764,000
D)$72,000
What were the total sales for 2010?
A)$60,000
B)$578,000
C)$764,000
D)$72,000
Unlock Deck
Unlock for access to all 152 flashcards in this deck.
Unlock Deck
k this deck
34
Answer the question.
The bar graph below shows the number of students by major in the College of Arts and Sciences. Did twice as many students major in History as in Science?
A)No
B)Yes
The bar graph below shows the number of students by major in the College of Arts and Sciences.
Did twice as many students major in History as in Science?A)No
B)Yes
Unlock Deck
Unlock for access to all 152 flashcards in this deck.
Unlock Deck
k this deck
35
Use this graph to answer the question.
Which month in 2009 had the lowest sales?
A)Month 2
B)Month 8
C)Month 3
D)Month 6
Which month in 2009 had the lowest sales?
A)Month 2
B)Month 8
C)Month 3
D)Month 6
Unlock Deck
Unlock for access to all 152 flashcards in this deck.
Unlock Deck
k this deck
36
Use this graph to answer the question.
What month in 2010 had the lowest sales?
A)Month 3
B)Month 5
C)Month 2
D)Month 12
What month in 2010 had the lowest sales?
A)Month 3
B)Month 5
C)Month 2
D)Month 12
Unlock Deck
Unlock for access to all 152 flashcards in this deck.
Unlock Deck
k this deck
37
Answer the question.
The bar graph below shows the number of students by major in the College of Arts and Sciences.
The bar graph below shows the number of students by major in the College of Arts and Sciences.
Unlock Deck
Unlock for access to all 152 flashcards in this deck.
Unlock Deck
k this deck
38
Use this graph to answer the question.
What was the total increase in sales for the first 6 months from 2009 to 2010?
A)$18,000
B)$652,000
C)$12,000
D)$76,000
What was the total increase in sales for the first 6 months from 2009 to 2010?
A)$18,000
B)$652,000
C)$12,000
D)$76,000
Unlock Deck
Unlock for access to all 152 flashcards in this deck.
Unlock Deck
k this deck
39
Construct a stem and leaf display for given data.
A professional basketball team plays 80 games a season. Below are the highest scores reached by one particular team. Use a double-stem display.
A professional basketball team plays 80 games a season. Below are the highest scores reached by one particular team. Use a double-stem display.
Unlock Deck
Unlock for access to all 152 flashcards in this deck.
Unlock Deck
k this deck
40
Use this graph to answer the question.
What were the total sales for 2009?
A)$48,000
B)$582,000
C)$764,000
D)$50,000
What were the total sales for 2009?
A)$48,000
B)$582,000
C)$764,000
D)$50,000
Unlock Deck
Unlock for access to all 152 flashcards in this deck.
Unlock Deck
k this deck
41
This double-bar graph shows the number of male (M)and female (F)athletes at a university over a four-year period.
Answer the question.
How many students were involved in athletics in 1989?
A)775
B)825
C)800
D)750
Answer the question.
How many students were involved in athletics in 1989?
A)775
B)825
C)800
D)750
Unlock Deck
Unlock for access to all 152 flashcards in this deck.
Unlock Deck
k this deck
42
This double-bar graph shows the number of male (M)and female (F)athletes at a university over a four-year period.
Answer the question.
Which year had the same number of male and female athletes?
A)1988
B)1986
C)1987
D)1989
Answer the question.
Which year had the same number of male and female athletes?
A)1988
B)1986
C)1987
D)1989
Unlock Deck
Unlock for access to all 152 flashcards in this deck.
Unlock Deck
k this deck
43
In a school survey, students showed these preferences for instructional materials. Answer the question.
About how many students would you expect to prefer radio in a school of 600 students?
A)About 30 students
B)About 216 students
C)About 108 students
D)About 5 students
About how many students would you expect to prefer radio in a school of 600 students?
A)About 30 students
B)About 216 students
C)About 108 students
D)About 5 students
Unlock Deck
Unlock for access to all 152 flashcards in this deck.
Unlock Deck
k this deck
44
In a school survey, students showed these preferences for instructional materials. Answer the question.
How many degrees are in the central angle for the "Computer" sector?
A)64.8°
B)129.6°
C)36°
D)10°
How many degrees are in the central angle for the "Computer" sector?
A)64.8°
B)129.6°
C)36°
D)10°
Unlock Deck
Unlock for access to all 152 flashcards in this deck.
Unlock Deck
k this deck
45
In a school survey, students showed these preferences for instructional materials. Answer the question.
About how many students would you expect to prefer lectures in a school of 900 students?
A)About 324 students
B)About 162 students
C)About 180 students
D)About 18 students
About how many students would you expect to prefer lectures in a school of 900 students?
A)About 324 students
B)About 162 students
C)About 180 students
D)About 18 students
Unlock Deck
Unlock for access to all 152 flashcards in this deck.
Unlock Deck
k this deck
46
Use the information to complete a circle graph. Note that the circle is divided into 100 equal sections.
Intended major of high school students:
Intended major of high school students:
Unlock Deck
Unlock for access to all 152 flashcards in this deck.
Unlock Deck
k this deck
47
In a school survey, students showed these preferences for instructional materials. Answer the question.
About how many students would you expect to prefer computers in a school of 650 students?
A)About 234 students
B)About 130 students
C)About 117 students
D)About 36 students
About how many students would you expect to prefer computers in a school of 650 students?
A)About 234 students
B)About 130 students
C)About 117 students
D)About 36 students
Unlock Deck
Unlock for access to all 152 flashcards in this deck.
Unlock Deck
k this deck
48
This double-bar graph shows the number of male (M)and female (F)athletes at a university over a four-year period.
Answer the question.
Which year had the greatest number of female athletes?
A)1987
B)1988
C)1986
D)1989
Answer the question.
Which year had the greatest number of female athletes?
A)1987
B)1988
C)1986
D)1989
Unlock Deck
Unlock for access to all 152 flashcards in this deck.
Unlock Deck
k this deck
49
This double-bar graph shows the number of male (M)and female (F)athletes at a university over a four-year period.
Answer the question.
What percentage of all students involved in athletics in 1989 was male? (Round to the nearest percent.)
A)41%
B)35%
C)59%
D)68%
Answer the question.
What percentage of all students involved in athletics in 1989 was male? (Round to the nearest percent.)
A)41%
B)35%
C)59%
D)68%
Unlock Deck
Unlock for access to all 152 flashcards in this deck.
Unlock Deck
k this deck
50
This double-bar graph shows the number of male (M)and female (F)athletes at a university over a four-year period.
Answer the question.
Which year had the smallest number of female athletes?
A)1988
B)1987
C)1986
D)1989
Answer the question.
Which year had the smallest number of female athletes?
A)1988
B)1987
C)1986
D)1989
Unlock Deck
Unlock for access to all 152 flashcards in this deck.
Unlock Deck
k this deck
51
Use the information to complete a circle graph. Note that the circle is divided into 100 equal sections.
Main form of exercise for employees of one company:
Main form of exercise for employees of one company:
Unlock Deck
Unlock for access to all 152 flashcards in this deck.
Unlock Deck
k this deck
52
This double-bar graph shows the number of male (M)and female (F)athletes at a university over a four-year period.
Answer the question.
Has the total number of students involved in athletics increased each year?
A)Yes.
B)No.
Answer the question.
Has the total number of students involved in athletics increased each year?
A)Yes.
B)No.
Unlock Deck
Unlock for access to all 152 flashcards in this deck.
Unlock Deck
k this deck
53
In a school survey, students showed these preferences for instructional materials. Answer the question.
How many degrees are in the central angle for the "radio" sector?
A)5°
B)9°
C)18°
D)180°
How many degrees are in the central angle for the "radio" sector?
A)5°
B)9°
C)18°
D)180°
Unlock Deck
Unlock for access to all 152 flashcards in this deck.
Unlock Deck
k this deck
54
In a school survey, students showed these preferences for instructional materials. Answer the question.
How many degrees are in the central angle for the "Lecture" sector?
A)64.8°
B)20°
C)32.4°
D)18°
How many degrees are in the central angle for the "Lecture" sector?
A)64.8°
B)20°
C)32.4°
D)18°
Unlock Deck
Unlock for access to all 152 flashcards in this deck.
Unlock Deck
k this deck
55
In a school survey, students showed these preferences for instructional materials. Answer the question.
How many degrees are in the central angle for the "TV" sector?
A)21.6°
B)43.2°
C)30°
D)12°
How many degrees are in the central angle for the "TV" sector?
A)21.6°
B)43.2°
C)30°
D)12°
Unlock Deck
Unlock for access to all 152 flashcards in this deck.
Unlock Deck
k this deck
56
In a school survey, students showed these preferences for instructional materials. Answer the question.
About how many students would you expect to prefer written materials in a school of 400 students?
A)About 144 students
B)About 72 students
C)About 9 students
D)About 36 students
About how many students would you expect to prefer written materials in a school of 400 students?
A)About 144 students
B)About 72 students
C)About 9 students
D)About 36 students
Unlock Deck
Unlock for access to all 152 flashcards in this deck.
Unlock Deck
k this deck
57
This double-bar graph shows the number of male (M)and female (F)athletes at a university over a four-year period.
Answer the question.
What percentage of all students involved in athletics in 1986 was female? (Round to the nearest percent.)
A)57%
B)43%
C)75%
D)14%
Answer the question.
What percentage of all students involved in athletics in 1986 was female? (Round to the nearest percent.)
A)57%
B)43%
C)75%
D)14%
Unlock Deck
Unlock for access to all 152 flashcards in this deck.
Unlock Deck
k this deck
58
In a school survey, students showed these preferences for instructional materials. Answer the question.
About how many students would you expect to prefer films in a school of 1000 students?
A)About 200 students
B)About 180 students
C)About 20 students
D)About 120 students
About how many students would you expect to prefer films in a school of 1000 students?
A)About 200 students
B)About 180 students
C)About 20 students
D)About 120 students
Unlock Deck
Unlock for access to all 152 flashcards in this deck.
Unlock Deck
k this deck
59
This double-bar graph shows the number of male (M)and female (F)athletes at a university over a four-year period.
Answer the question.
What is the only year in which the number of female athletes declined from its previous value?
A)1986
B)1987
C)1989
D)1988
Answer the question.
What is the only year in which the number of female athletes declined from its previous value?
A)1986
B)1987
C)1989
D)1988
Unlock Deck
Unlock for access to all 152 flashcards in this deck.
Unlock Deck
k this deck
60
In a school survey, students showed these preferences for instructional materials. Answer the question.
About how many students would you expect to prefer TV in a school of 650 students?
A)About 130 students
B)About 78 students
C)About 12 students
D)About 117 students
About how many students would you expect to prefer TV in a school of 650 students?
A)About 130 students
B)About 78 students
C)About 12 students
D)About 117 students
Unlock Deck
Unlock for access to all 152 flashcards in this deck.
Unlock Deck
k this deck
61
Use the graph to answer the question.
Mike decides to buy shares of companies X and Y, which were initially selling for the same price. The changes in each stock's value over 90 days are shown in the graph above. When did the two
Stocks have the same value, other than when he bought them?
A)day 80
B)day 50
C)day 85
D)day 90
Mike decides to buy shares of companies X and Y, which were initially selling for the same price. The changes in each stock's value over 90 days are shown in the graph above. When did the twoStocks have the same value, other than when he bought them?
A)day 80
B)day 50
C)day 85
D)day 90
Unlock Deck
Unlock for access to all 152 flashcards in this deck.
Unlock Deck
k this deck
62
Use the graph to answer the question.
Mike decides to buy shares of companies X and Y, which were initially selling for the same price. The changes in each stock's value over 90 days are shown in the graph above. Using the trend of
The graph at 90 days, do you expect the value of Stock X to increase or decrease over the upcoming
Days?
A)Decrease
B)Increase
Mike decides to buy shares of companies X and Y, which were initially selling for the same price. The changes in each stock's value over 90 days are shown in the graph above. Using the trend ofThe graph at 90 days, do you expect the value of Stock X to increase or decrease over the upcoming
Days?
A)Decrease
B)Increase
Unlock Deck
Unlock for access to all 152 flashcards in this deck.
Unlock Deck
k this deck
63
Find the indicated probability.
A relative frequency distribution is given below for the size of families in one U.S. city. A family is selected at random. Find the probability that the size of the family is between 2 and 5 inclusive. Round your answer to three decimal places.
A)0.951
B)0.5
C)0.853
D)0.451
A relative frequency distribution is given below for the size of families in one U.S. city.
A family is selected at random. Find the probability that the size of the family is between 2 and 5 inclusive. Round your answer to three decimal places.A)0.951
B)0.5
C)0.853
D)0.451
Unlock Deck
Unlock for access to all 152 flashcards in this deck.
Unlock Deck
k this deck
64
Find the indicated probability.
In a survey, 50 students were asked to name their favorite color. The table below shows the results.
In a survey, 50 students were asked to name their favorite color. The table below shows the results.
Unlock Deck
Unlock for access to all 152 flashcards in this deck.
Unlock Deck
k this deck
65
Find the indicated probability.
The age distribution of students at a community college is given below. A student from the community college is selected at random. Find the probability that the student is between 26 and 35 inclusive. Round your answer to three decimal places.
A)0.188
B)0.052
C)266
D)0.241
The age distribution of students at a community college is given below.
A student from the community college is selected at random. Find the probability that the student is between 26 and 35 inclusive. Round your answer to three decimal places.A)0.188
B)0.052
C)266
D)0.241
Unlock Deck
Unlock for access to all 152 flashcards in this deck.
Unlock Deck
k this deck
66
Use the information to complete a circle graph. Note that the circle is divided into 100 equal sections.
Main form of exercise for employees of one company:
Main form of exercise for employees of one company:
Unlock Deck
Unlock for access to all 152 flashcards in this deck.
Unlock Deck
k this deck
67
Find the indicated probability.
The table shows the percentage of college students who prefer a given pizza topping. What is the probability that a randomly selected junior prefers meat toppings? Round to the nearest hundredth.
A)0.21
B)0.06
C)0.35
D)0.17
The table shows the percentage of college students who prefer a given pizza topping.
What is the probability that a randomly selected junior prefers meat toppings? Round to the nearest hundredth.A)0.21
B)0.06
C)0.35
D)0.17
Unlock Deck
Unlock for access to all 152 flashcards in this deck.
Unlock Deck
k this deck
68
Use the graph to answer the question.
Mike decides to buy shares of companies A, B, and C, which were initially selling for the same price. The changes in each stock's value are shown in the graph above. Knowing what he knows
Now, after how many days should he have sold in his stock in company A?
A)30
B)50
C)60
D)80
Mike decides to buy shares of companies A, B, and C, which were initially selling for the same price. The changes in each stock's value are shown in the graph above. Knowing what he knowsNow, after how many days should he have sold in his stock in company A?
A)30
B)50
C)60
D)80
Unlock Deck
Unlock for access to all 152 flashcards in this deck.
Unlock Deck
k this deck
69
Find the indicated probability.
A relative frequency distribution is given below for the size of families in one U.S. city. A family is selected at random. Find the probability that the size of the family is less than 5. Round your answer to three decimal places.
A)0.528
B)0.436
C)0.852
D)0.092
A relative frequency distribution is given below for the size of families in one U.S. city.
A family is selected at random. Find the probability that the size of the family is less than 5. Round your answer to three decimal places.A)0.528
B)0.436
C)0.852
D)0.092
Unlock Deck
Unlock for access to all 152 flashcards in this deck.
Unlock Deck
k this deck
70
Find the indicated probability.
The table shows the percentage of college students who prefer a given pizza topping. What is the probability that a randomly selected student prefers cheese toppings? Round to the nearest hundredth.
A)0.31
B)0.33
C)0.34
D)0.10
The table shows the percentage of college students who prefer a given pizza topping.
What is the probability that a randomly selected student prefers cheese toppings? Round to the nearest hundredth.A)0.31
B)0.33
C)0.34
D)0.10
Unlock Deck
Unlock for access to all 152 flashcards in this deck.
Unlock Deck
k this deck
71
Use the graph to answer the question.
Mike decides to buy shares of companies A, B, and C, which were initially selling for the same price. The changes in each stock's value are shown in the graph above. After how many days did
Stock C's value go below $20?
A)30
B)40
C)60
D)80
Mike decides to buy shares of companies A, B, and C, which were initially selling for the same price. The changes in each stock's value are shown in the graph above. After how many days didStock C's value go below $20?
A)30
B)40
C)60
D)80
Unlock Deck
Unlock for access to all 152 flashcards in this deck.
Unlock Deck
k this deck
72
Use the graph to answer the question.
Mike decides to buy shares of companies X and Y, which were initially selling for the same price. The changes in each stock's value over 90 days are shown in the graph above. At its peak, about
How much more was stock Y worth than X?
A)$65
B)$90
C)$45
D)$75
Mike decides to buy shares of companies X and Y, which were initially selling for the same price. The changes in each stock's value over 90 days are shown in the graph above. At its peak, aboutHow much more was stock Y worth than X?
A)$65
B)$90
C)$45
D)$75
Unlock Deck
Unlock for access to all 152 flashcards in this deck.
Unlock Deck
k this deck
73
Solve the problem.
Sixteen workers were surveyed about how long it takes them to travel to work each day. The data below are given in minutes. Represent the data in a double-stem display.
Sixteen workers were surveyed about how long it takes them to travel to work each day. The data below are given in minutes. Represent the data in a double-stem display.
Unlock Deck
Unlock for access to all 152 flashcards in this deck.
Unlock Deck
k this deck
74
Use the information to complete a circle graph. Note that the circle is divided into 100 equal sections.
Main form of exercise for employees of one company:
Main form of exercise for employees of one company:
Unlock Deck
Unlock for access to all 152 flashcards in this deck.
Unlock Deck
k this deck
75
Find the indicated probability.
The age distribution of students at a community college is given below. A student from the community college is selected at random. Find the probability that the student is at least 31. Round your answer to three decimal places.
A)82
B)0.926
C)0.074
D)0.049
The age distribution of students at a community college is given below.
A student from the community college is selected at random. Find the probability that the student is at least 31. Round your answer to three decimal places.A)82
B)0.926
C)0.074
D)0.049
Unlock Deck
Unlock for access to all 152 flashcards in this deck.
Unlock Deck
k this deck
76
Use the graph to answer the question.
Mike decides to buy shares of companies A, B, and C, which were initially selling for the same price. The changes in each stock's value are shown in the graph above. At its peak, stock A was
Valued at approximately how much more than either B or C?
A)$15
B)$30
C)$10
D)$35
Mike decides to buy shares of companies A, B, and C, which were initially selling for the same price. The changes in each stock's value are shown in the graph above. At its peak, stock A wasValued at approximately how much more than either B or C?
A)$15
B)$30
C)$10
D)$35
Unlock Deck
Unlock for access to all 152 flashcards in this deck.
Unlock Deck
k this deck
77
Use the graph to answer the question.
Mike decides to buy shares of companies X and Y, which were initially selling for the same price. The changes in each stock's value over 90 days are shown in the graph above. At day 90, Mike
Decides to buy more of one of the stocks. Which stock should he choose?
A)X
B)Y
Mike decides to buy shares of companies X and Y, which were initially selling for the same price. The changes in each stock's value over 90 days are shown in the graph above. At day 90, MikeDecides to buy more of one of the stocks. Which stock should he choose?
A)X
B)Y
Unlock Deck
Unlock for access to all 152 flashcards in this deck.
Unlock Deck
k this deck
78
Make a bar graph to represent the data.
The following table shows the number of female infants born at Hospital X on New Year's
Day (Jan. 1). Create a vertical bar graph.
The following table shows the number of female infants born at Hospital X on New Year's
Day (Jan. 1). Create a vertical bar graph.
Unlock Deck
Unlock for access to all 152 flashcards in this deck.
Unlock Deck
k this deck
79
Use the graph to answer the question.
Mike decides to buy shares of companies A, B, and C, which were initially selling for the same price. The changes in each stock's value are shown in the graph above. Could Mike have ever made
A profit off of stock C if he had sold at the right time?
A)Yes
B)No
Mike decides to buy shares of companies A, B, and C, which were initially selling for the same price. The changes in each stock's value are shown in the graph above. Could Mike have ever madeA profit off of stock C if he had sold at the right time?
A)Yes
B)No
Unlock Deck
Unlock for access to all 152 flashcards in this deck.
Unlock Deck
k this deck
80
Use the information to complete a circle graph. Note that the circle is divided into 100 equal sections.
Main form of exercise for employees of one company:
Main form of exercise for employees of one company:
Unlock Deck
Unlock for access to all 152 flashcards in this deck.
Unlock Deck
k this deck
Unlock Deck
Unlock for access to all 152 flashcards in this deck.


