Exam 12: Statistics
Exam 1: The Art of Problem Solving190 Questions
Exam 2: The Basic Concepts of Set Theory316 Questions
Exam 3: Introduction to Logic315 Questions
Exam 4: Numeration Systems245 Questions
Exam 5: Number Theory171 Questions
Exam 6: The Real Numbers and Their Representations401 Questions
Exam 7: The Basic Concepts of Algebra273 Questions
Exam 8: Graphs, Functions, and Systems of Equations and Inequalities136 Questions
Exam 9: Geometry182 Questions
Exam 10: Counting Methods213 Questions
Exam 11: Probability140 Questions
Exam 12: Statistics152 Questions
Exam 13: Personal Financial Management260 Questions
Exam 14: Trigonometry Formerly234 Questions
Exam 15: Graph Theory110 Questions
Exam 16: Voting and Apportionment99 Questions
Select questions type
Construct a stem and leaf display for given data.
-The numbers of attendees at an annual convention, for each of the last 20 years, are given below. Use a double-stem display. 159 146 154 145 132 134 134 135 127 125 126 132 135 143 148 150 146 150 129 134
Free
(Multiple Choice)
4.9/5  (37)
(37)
Correct Answer: Verified
B
Find the mode or modes.
-The weights (in ounces)of 14 different apples are shown below. 5.0 5.5 4.6 6.9 4.1 5.0 5.5
5.7 6.0 6.9 5.0 4.8 6.9 4.4
Free
(Multiple Choice)
4.9/5 (31)
Correct Answer:Verified
A
Use the graph to answer the question.
-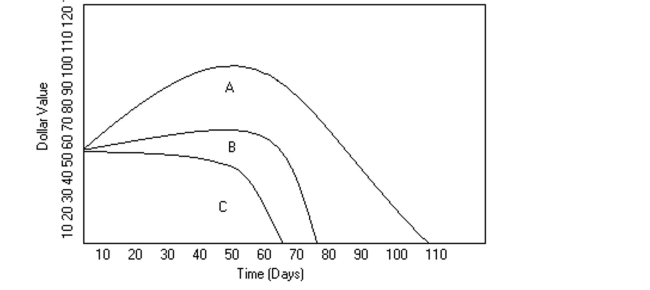 Mike decides to buy shares of companies A, B, and C, which were initially selling for the same price. The changes in each stock's value are shown in the graph above. Could Mike have ever made
A profit off of stock C if he had sold at the right time?
Mike decides to buy shares of companies A, B, and C, which were initially selling for the same price. The changes in each stock's value are shown in the graph above. Could Mike have ever made
A profit off of stock C if he had sold at the right time?
Free
(Multiple Choice)
4.8/5 (36)
Correct Answer:Verified
B
Solve the problem.
-Jackie's sisters weigh 116 lb, 145 lb, 125 lb, and 120 lb. The average female in her city weighs 131.9 lb. How much does Jackie weigh if she and her sisters have an average weight of 131.9 lb?
(Multiple Choice)
4.7/5 (37)
Construct a vertical bar graph for the relative frequencies given. Blood type Frequency Relative frequency 22 0.44 19 0.38 6 0.12 3 0.06
(Essay)
4.7/5 (38)
Solve the problem.
-Sheryl's mean score on eight exams is 79.875. Find the sum of her scores.
(Multiple Choice)
4.8/5 (29)
This double-bar graph shows the number of male (M)and female (F)athletes at a university over a four-year period.
Answer the question. 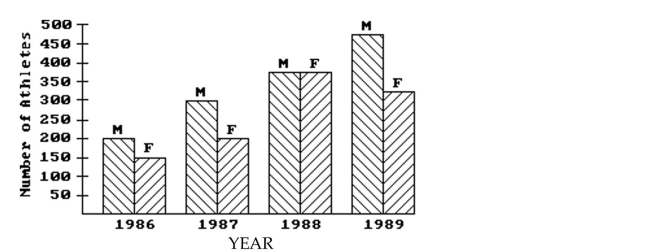 -What percentage of all students involved in athletics in 1986 was female? (Round to the nearest percent.)
(Multiple Choice)
5.0/5 (34)
Construct a stem and leaf display for given data.
-A professional basketball team plays 80 games a season. Below are the highest scores reached by one particular team. Use a double-stem display. 110 112 125 119 104 105 134 103 103 112 116 101 119 118 128 108 127 132 123 103 134 103 114 120 100 105 115 123 120 114 124 103 125 116 102 109 114 104 113 105
(Multiple Choice)
4.9/5 (30)
The table lists the winners of the Wimbledon women's singles title for the years 1976-1995.
Construct a vertical bar graph for the given relative frequencies. Winner Frequency Relative frequency C. Evert 2 0.10 V. Wade 1 0.05 M. Navratilova 9 0.45 C. Martinez 1 0.05 S. Graf 6 0.30 E. Goolagong 1 0.05

(Essay)
4.8/5 (29)
In a school survey, students showed these preferences for instructional materials. Answer the question. 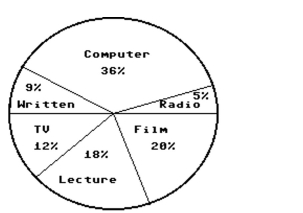 -How many degrees are in the central angle for the "TV" sector?
(Multiple Choice)
4.8/5 (30)
Find the mean for the given frequency distribution.
- Value Frequency 121 3 199 5 262 6 282 6 353 1
(Multiple Choice)
4.8/5 (37)
Use the graph to answer the question.
-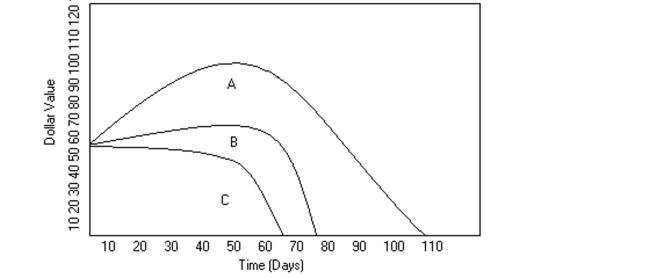 Mike decides to buy shares of companies A, B, and C, which were initially selling for the same price. The changes in each stock's value are shown in the graph above. Knowing what he knows
Now, after how many days should he have sold in his stock in company A?
Mike decides to buy shares of companies A, B, and C, which were initially selling for the same price. The changes in each stock's value are shown in the graph above. Knowing what he knows
Now, after how many days should he have sold in his stock in company A?
(Multiple Choice)
4.8/5 (35)
Construct a frequency polygon.
- Number of Exam scores Students 50-59 2 60-69 8 70-79 30 80-89 40 90-99 10
(Multiple Choice)
4.9/5 (37)
Construct the specified histogram.
-The frequency table below shows the number of days off in a given year for 30 police detectives.
Days off Frequency 0-1 10 2-3 1 4-5 7 6-7 7 8-9 1 10-11 4 Construct a histogram.
(Essay)
4.8/5 (38)
Find the mean for the given frequency distribution.
-Find the approximate mean for the grouped frequency distribution. Use the class midpoint to represent each class. Round your answer to two decimal places.
Score Frequency 60-69 3 70-79 12 80-89 7 90-99 2
(Multiple Choice)
4.9/5 (35)
Provide an appropriate response.
-The median of a data set is always/sometimes/never (select one)one of the data points in a
set of data. Explain your answer with brief examples.
(Essay)
4.7/5 (41)
Use the information to complete a circle graph. Note that the circle is divided into 100 equal sections.
-Intended major of high school students:
Science: 32\% Social Science: 8\% Humanities: 20\% Business: 16\% Other: 24\%
(Multiple Choice)
4.7/5 (33)
Filters
- Essay(0)
- Multiple Choice(0)
- Short Answer(0)
- True False(0)
- Matching(0)