Deck 3: Graphing
Full screen (f)
Question
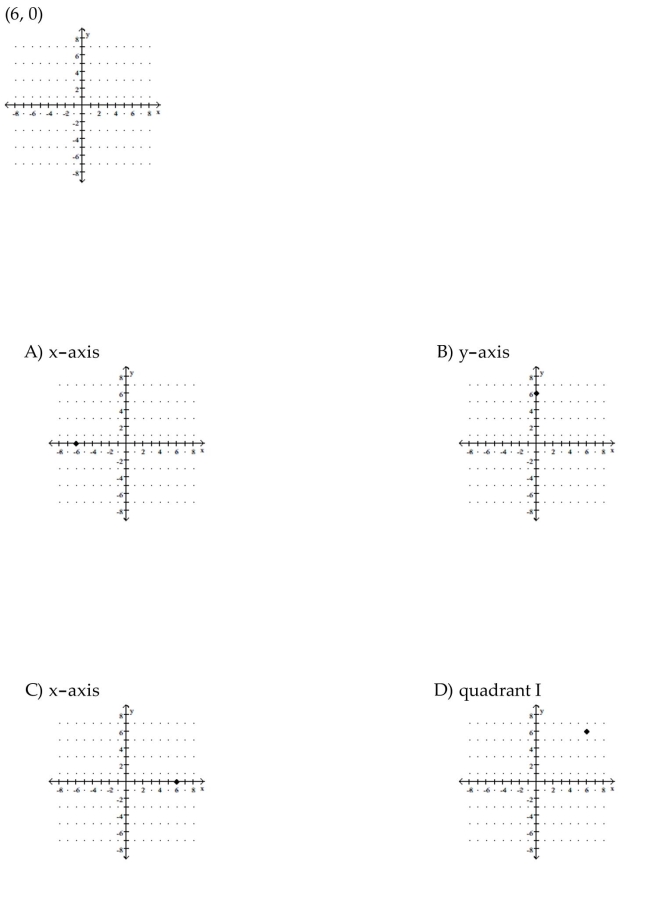
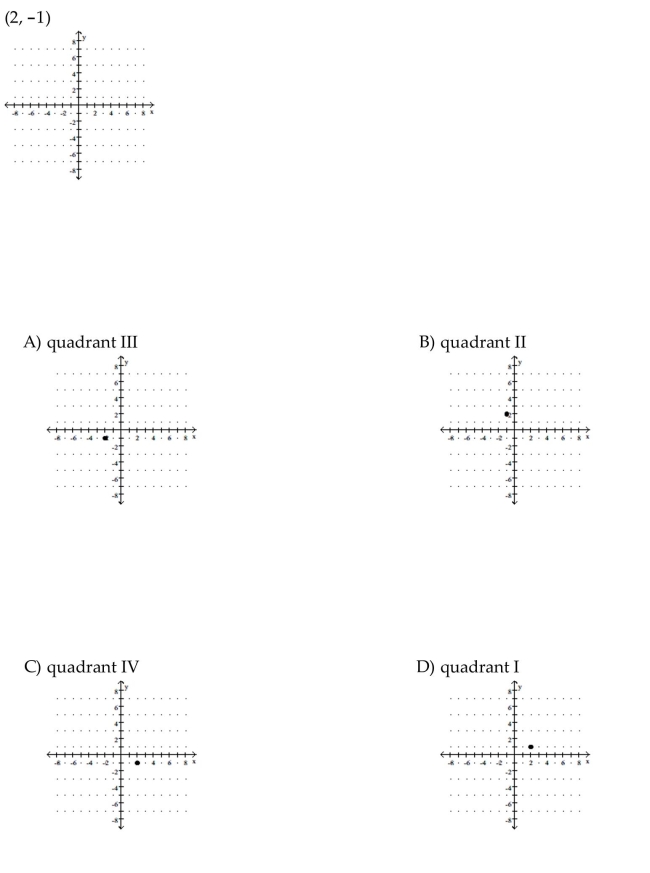
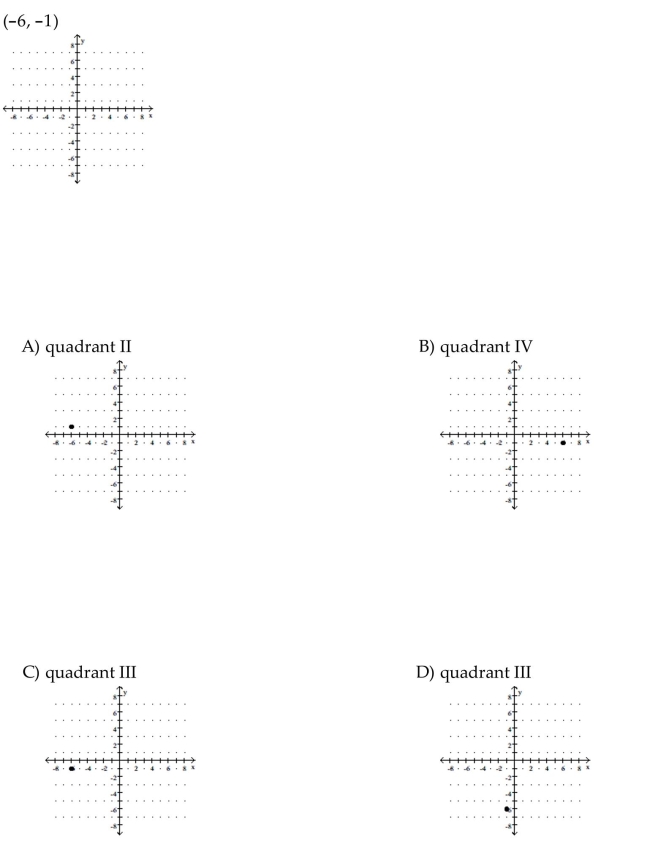
Plot the ordered pair. State in which quadrant or on which axis the point lies.
Question
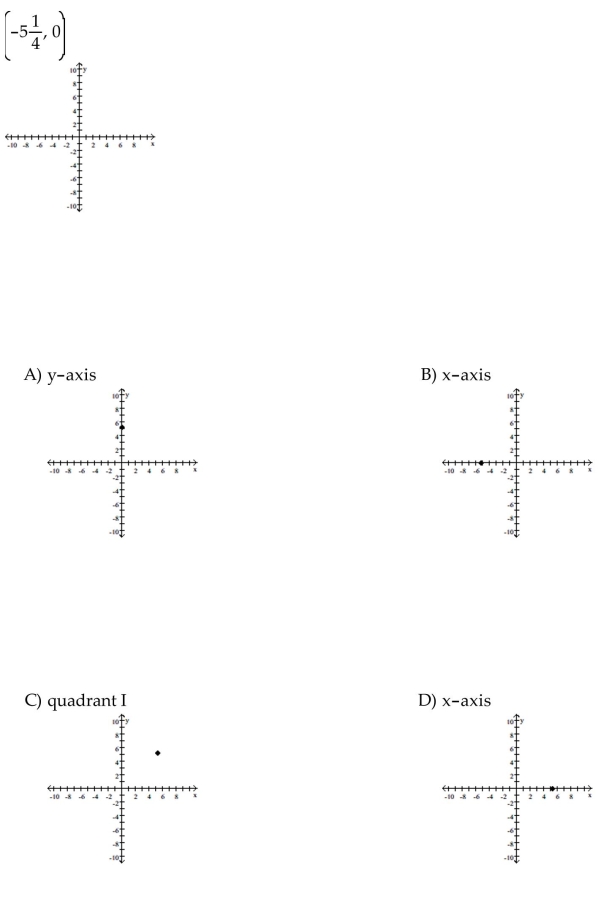
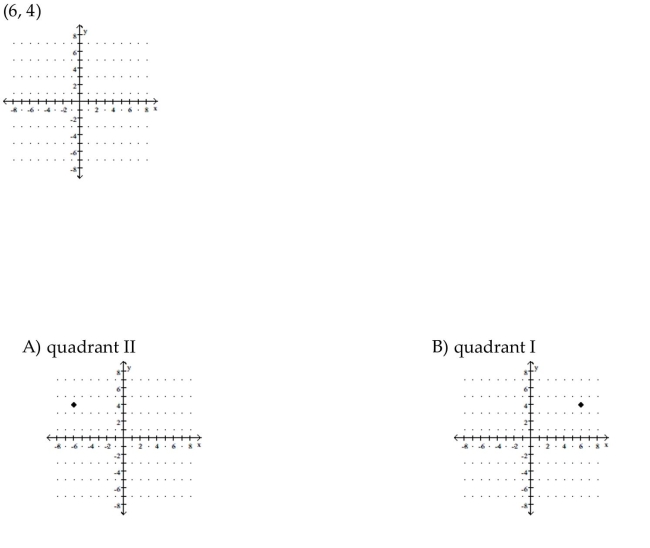
Plot the ordered pair. State in which quadrant or on which axis the point lies.
Question
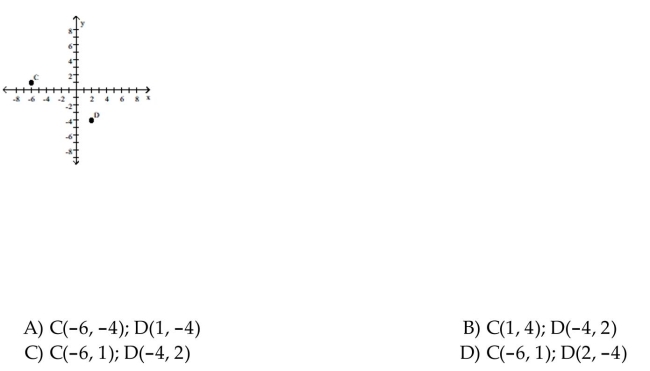
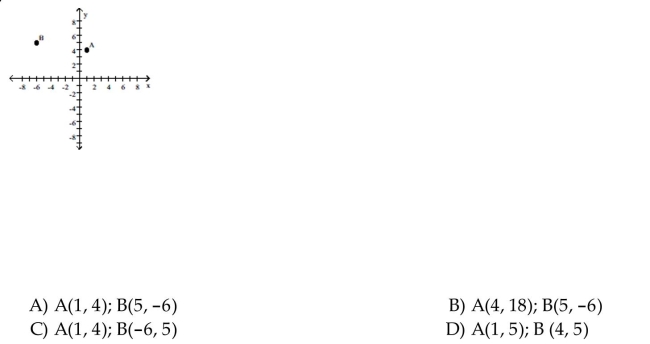
Find the x- and y-coordinates of the following labeled points.
Question
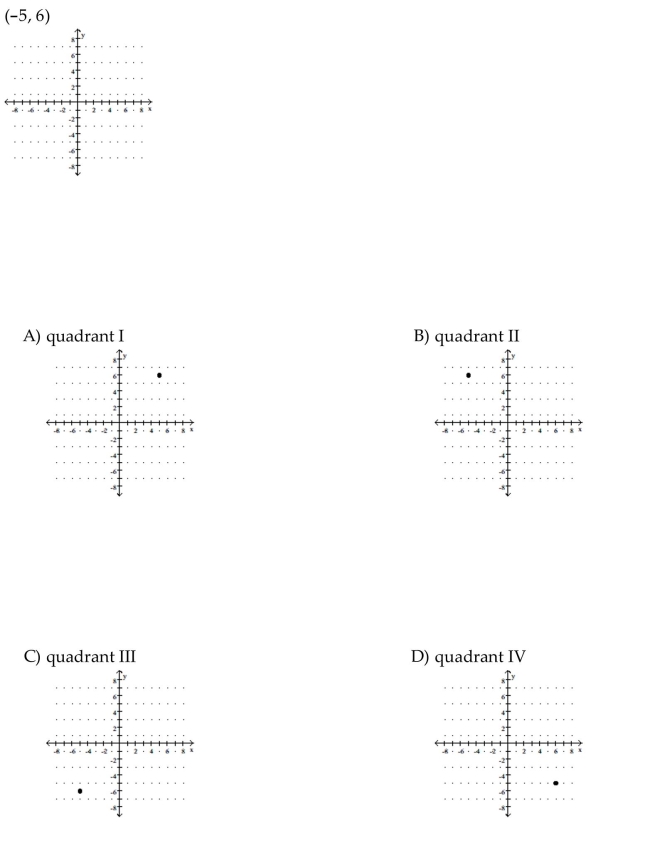
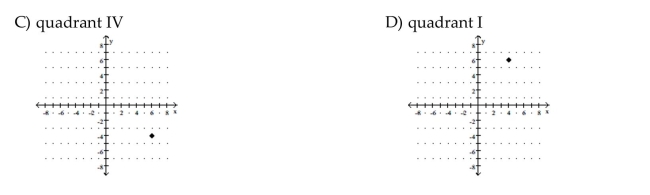
Plot the ordered pair. State in which quadrant or on which axis the point lies.
Question
The bar graph shows the number of tickets sold each week by the garden club for their annual flower show. Use the
graph to answer the question.
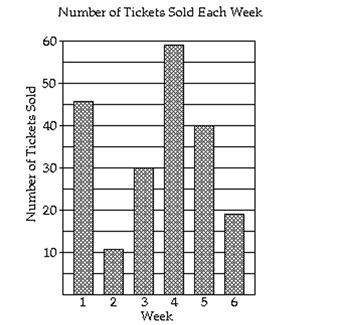
During which week were 59 tickets sold?
A) week 6
B) week 4
C) week 5
D) week 1
graph to answer the question.
During which week were 59 tickets sold?
A) week 6
B) week 4
C) week 5
D) week 1
Question
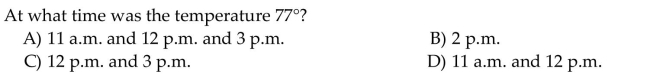
The line graph shows the recorded hourly temperatures in degrees Fahrenheit at an airport. Use the graph to answer the
question.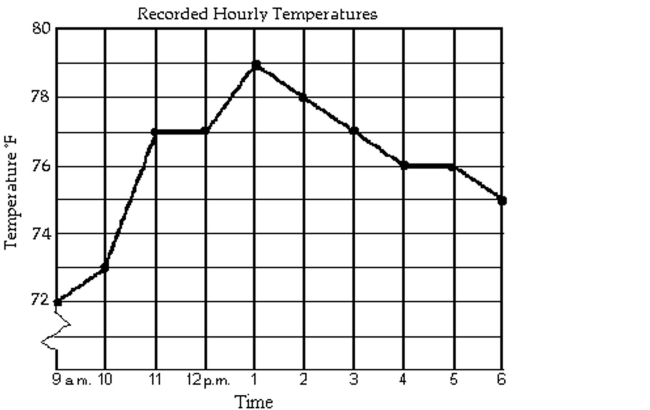
question.
Question
Plot the ordered pair. State in which quadrant or on which axis the point lies.
Question
Plot the ordered pair. State in which quadrant or on which axis the point lies.
Question
Plot the ordered pair. State in which quadrant or on which axis the point lies.
Question
The line graph shows the recorded hourly temperatures in degrees Fahrenheit at an airport. Use the graph to answer the
question.
What temperature was recorded at 10 a.m.?
question.
What temperature was recorded at 10 a.m.?
Question
The bar graph shows the number of tickets sold each week by the garden club for their annual flower show. Use the
graph to answer the question.
How many more tickets were sold during week 3 than week 2?
A) 19 tickets
B) 29 tickets
C) 24 tickets
D) 41 tickets
graph to answer the question.
How many more tickets were sold during week 3 than week 2?
A) 19 tickets
B) 29 tickets
C) 24 tickets
D) 41 tickets
Question
The line graph shows the recorded hourly temperatures in degrees Fahrenheit at an airport. Use the graph to answer the
question.
At what time was the temperature the lowest?
A) 9 a.m.
B) 6 p.m.
C) 1 p.m.
D) 10 a.m.
question.
At what time was the temperature the lowest?
A) 9 a.m.
B) 6 p.m.
C) 1 p.m.
D) 10 a.m.
Question
The bar graph shows the number of tickets sold each week by the garden club for their annual flower show. Use the
graph to answer the question.
How many tickets were sold in all?
A) 195 tickets
B) 105 tickets
C) 205 tickets
D) 215 tickets
graph to answer the question.
How many tickets were sold in all?
A) 195 tickets
B) 105 tickets
C) 205 tickets
D) 215 tickets
Question
Plot the ordered pair. State in which quadrant or on which axis the point lies.
Question
The bar graph shows the number of tickets sold each week by the garden club for their annual flower show. Use the
graph to answer the question.
During which weeks were the number of tickets sold more than 25?
A) weeks 1, 4, and 5
B) weeks 1, 3, and 4
C) weeks 1, 3, and 5
D) weeks 1, 3, 4, and 5
graph to answer the question.
During which weeks were the number of tickets sold more than 25?
A) weeks 1, 4, and 5
B) weeks 1, 3, and 4
C) weeks 1, 3, and 5
D) weeks 1, 3, 4, and 5
Question
The bar graph shows the number of tickets sold each week by the garden club for their annual flower show. Use the
graph to answer the question.
How many tickets were sold during week 2?
graph to answer the question.
How many tickets were sold during week 2?
Question
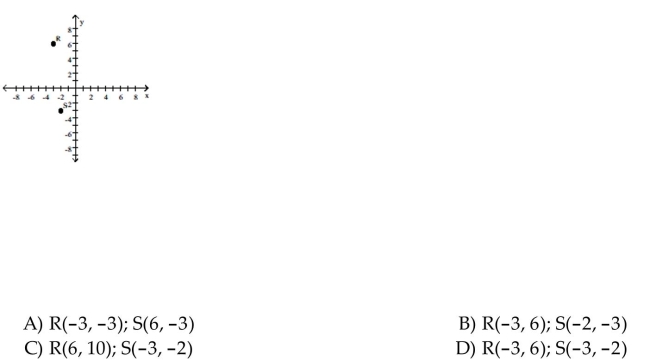
Find the x- and y-coordinates of the following labeled points.
Question
The bar graph shows the number of tickets sold each week by the garden club for their annual flower show. Use the
graph to answer the question.
During which week were the fewest number of tickets sold?
graph to answer the question.
During which week were the fewest number of tickets sold?
Question
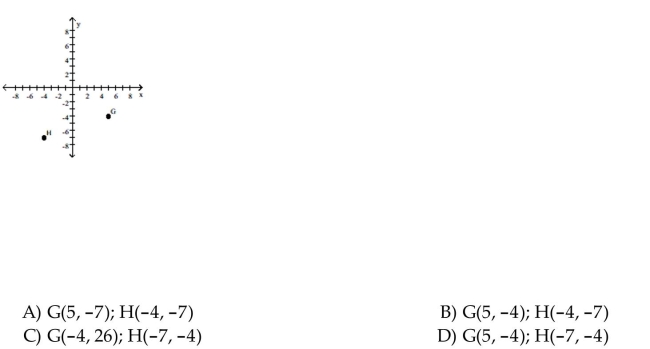
Find the x- and y-coordinates of the following labeled points.
Question
The line graph shows the recorded hourly temperatures in degrees Fahrenheit at an airport. Use the graph to answer the
question.
During which hour did the temperature increase the most?
A) 9 a.m. to 10 a.m.
B) 10 a.m. to 11 a.m.
C) 12 p.m. to 1 p.m.
D) 1 p.m. to 2 p.m.
question.
During which hour did the temperature increase the most?
A) 9 a.m. to 10 a.m.
B) 10 a.m. to 11 a.m.
C) 12 p.m. to 1 p.m.
D) 1 p.m. to 2 p.m.
Question
. Write the word or phrase that best completes each statement or answers the question.
Solve.
The table shows the number of cookies sold at a bake sale according to their diameter in
inches. Write the ordered pair data as an ordered pair of the form (diameter, number sold).
Then create a scatter diagram of the ordered pairs..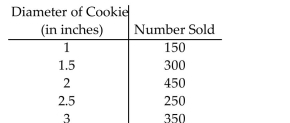
Solve.
The table shows the number of cookies sold at a bake sale according to their diameter in
inches. Write the ordered pair data as an ordered pair of the form (diameter, number sold).
Then create a scatter diagram of the ordered pairs..
Question
Find the x- and y-coordinates of the following labeled points.
Question
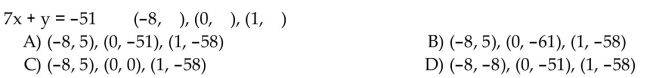
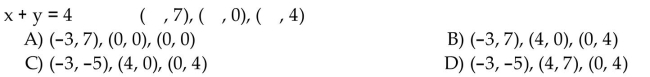
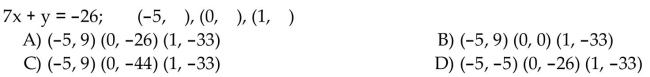
Complete the ordered pair so that it is a solution of the given linear equation.
Question
. Write the word or phrase that best completes each statement or answers the question.
Solve.
The table shows the average hourly wage for non-managerial office workers in a town in
Indiana (in dollars) for the years shown. Write each paired data as an ordered pair of the
form (year, wage). Then create a scatter diagram of the ordered pairs.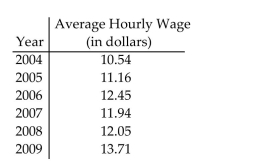
Solve.
The table shows the average hourly wage for non-managerial office workers in a town in
Indiana (in dollars) for the years shown. Write each paired data as an ordered pair of the
form (year, wage). Then create a scatter diagram of the ordered pairs.
Question
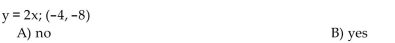
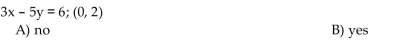
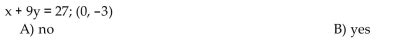
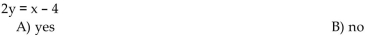
Determine whether the ordered pair is a solution of the given linear equation.

Question
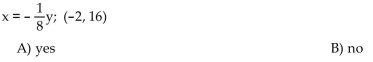
Determine whether the ordered pair is a solution of the given linear equation.
Question
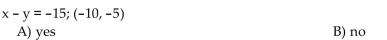
Determine whether the ordered pair is a solution of the given linear equation.

Question
Determine whether the ordered pair is a solution of the given linear equation.
Question
Determine whether the ordered pair is a solution of the given linear equation.

Question
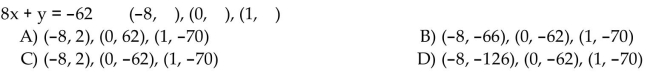
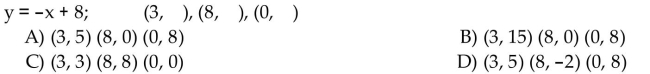
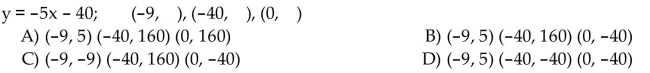
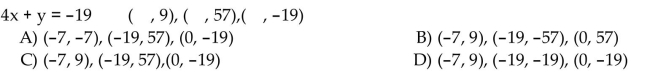
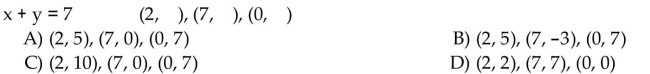
Complete the ordered pair so that it is a solution of the given linear equation.
Question
Determine whether the ordered pair is a solution of the given linear equation.

Question
Complete the ordered pair so that it is a solution of the given linear equation.
Question
Determine whether the ordered pair is a solution of the given linear equation.
Question
Complete the ordered pair so that it is a solution of the given linear equation.
Question
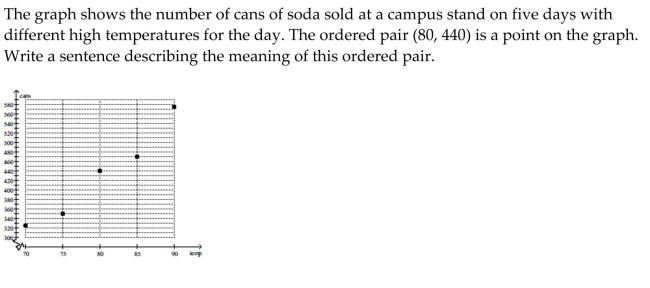
. Write the word or phrase that best completes each statement or answers the question.
Solve.
The table shows the number of cans of soda sold at a campus stand on five days with
different high temperatures for the day. Write each paired data as an order pair of the form
(temperature, cans). Then create a scatter diagram of the ordered pairs.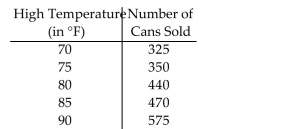
Solve.
The table shows the number of cans of soda sold at a campus stand on five days with
different high temperatures for the day. Write each paired data as an order pair of the form
(temperature, cans). Then create a scatter diagram of the ordered pairs.
Question
Determine whether the ordered pair is a solution of the given linear equation.
Question
Determine whether the ordered pair is a solution of the given linear equation.
Question
Determine whether the ordered pair is a solution of the given linear equation.

Question
Complete the ordered pair so that it is a solution of the given linear equation.
Question
Determine whether the ordered pair is a solution of the given linear equation.

Question
Determine whether the equation is a linear equation in two variables.
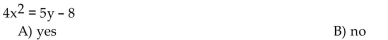
Question
Complete the ordered pair so that it is a solution of the given linear equation.
Question
. Write the word or phrase that best completes each statement or answers the question.
Solve.
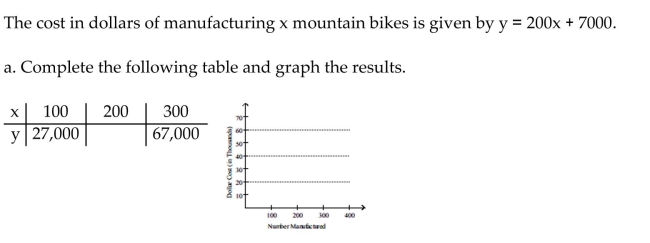 b. Find the number of mountain bikes that can be manufactured for $35,600
Solve.
b. Find the number of mountain bikes that can be manufactured for $35,600 Question
. Write the word or phrase that best completes each statement or answers the question.
Solve.
Solve.
Question
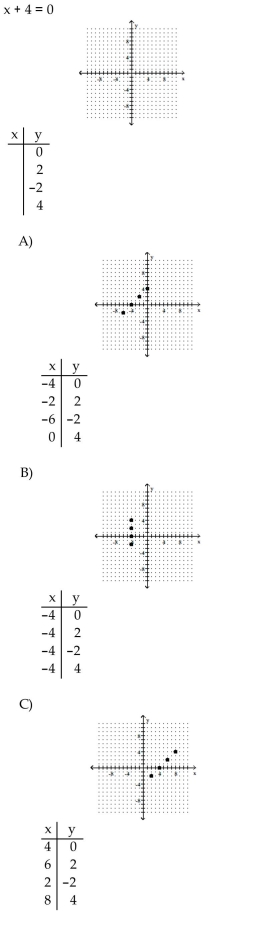
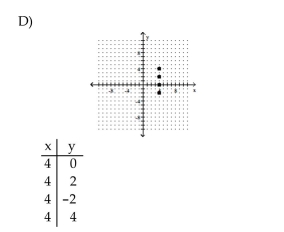
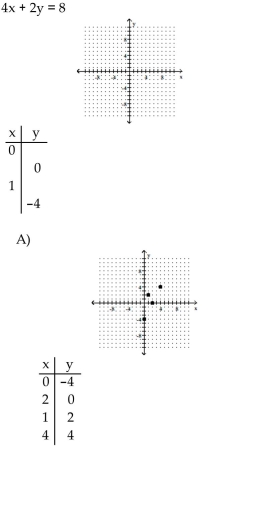
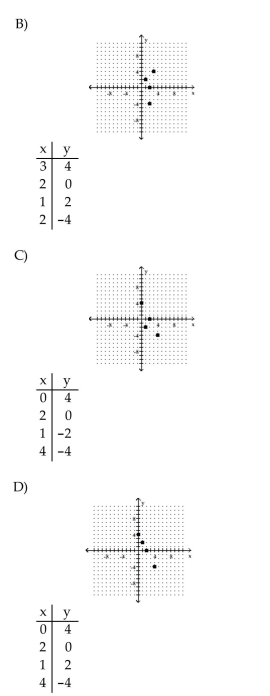
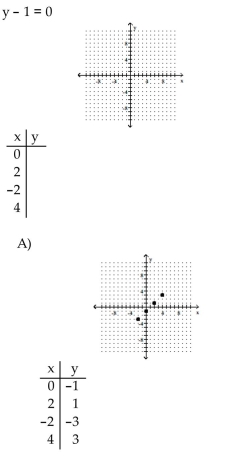
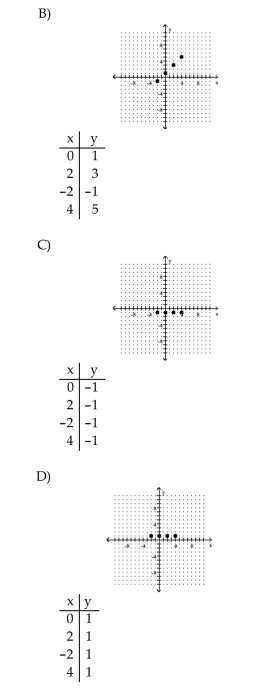
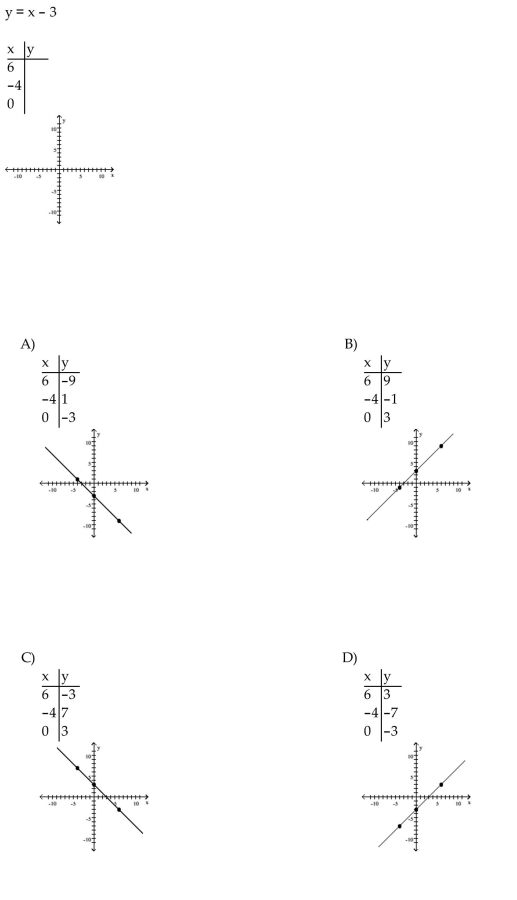
Complete the table of ordered pairs for the given linear equation; then plot the solution.
Question
Complete the table of ordered pairs for the given linear equation; then plot the solution.
Question
Determine whether the equation is a linear equation in two variables.

Question
Complete the ordered pair so that it is a solution of the given linear equation.
Question
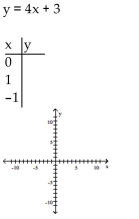
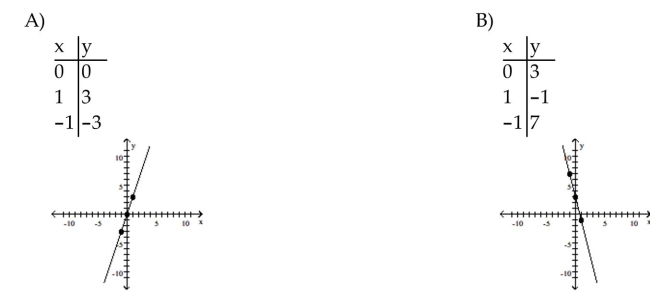
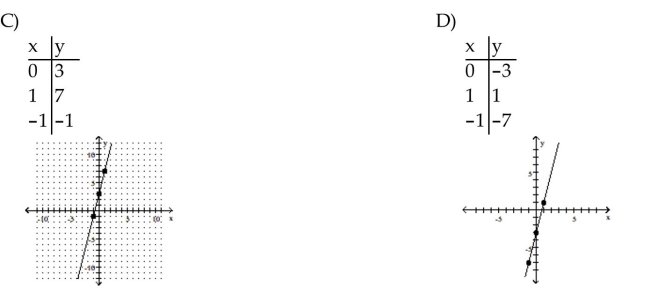
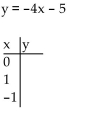
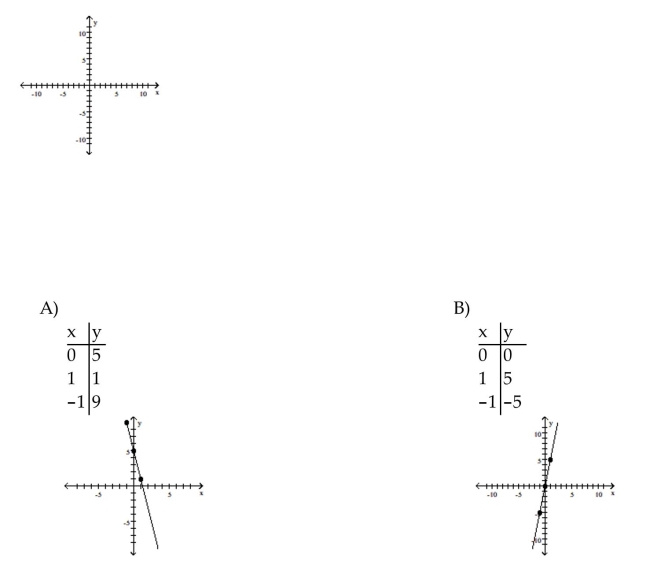
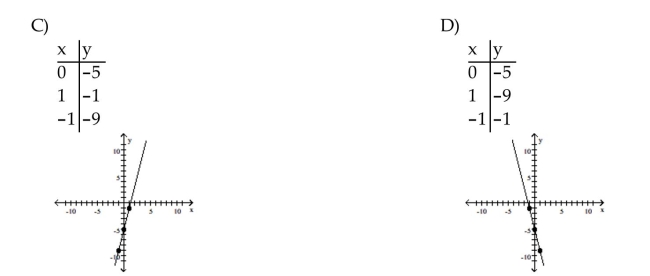
Find three ordered pair solutions by completing the table. Then use the ordered pairs to graph the equation.
Question
Determine whether the equation is a linear equation in two variables.
Question
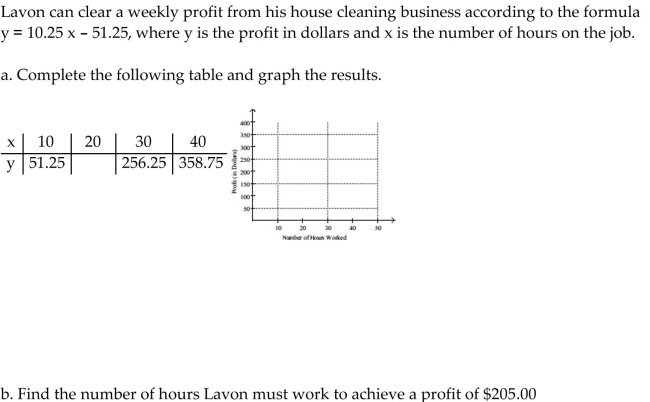
. Write the word or phrase that best completes each statement or answers the question.
Solve.
Solve.
Question
Determine whether the equation is a linear equation in two variables.

Question
Determine whether the equation is a linear equation in two variables.
Question
Determine whether the equation is a linear equation in two variables.
Question
Determine whether the equation is a linear equation in two variables.
Question
Determine whether the equation is a linear equation in two variables.

Question
Complete the ordered pair so that it is a solution of the given linear equation.
Question
Determine whether the equation is a linear equation in two variables.

Question
Determine whether the equation is a linear equation in two variables.

Question
Complete the table of ordered pairs for the given linear equation; then plot the solution.
Question
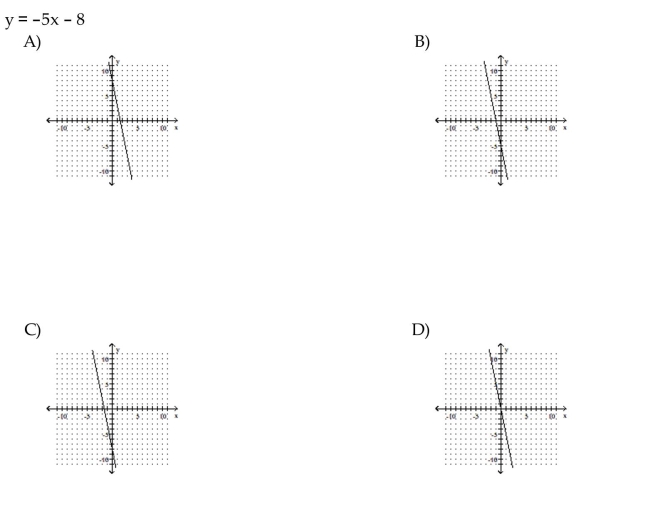
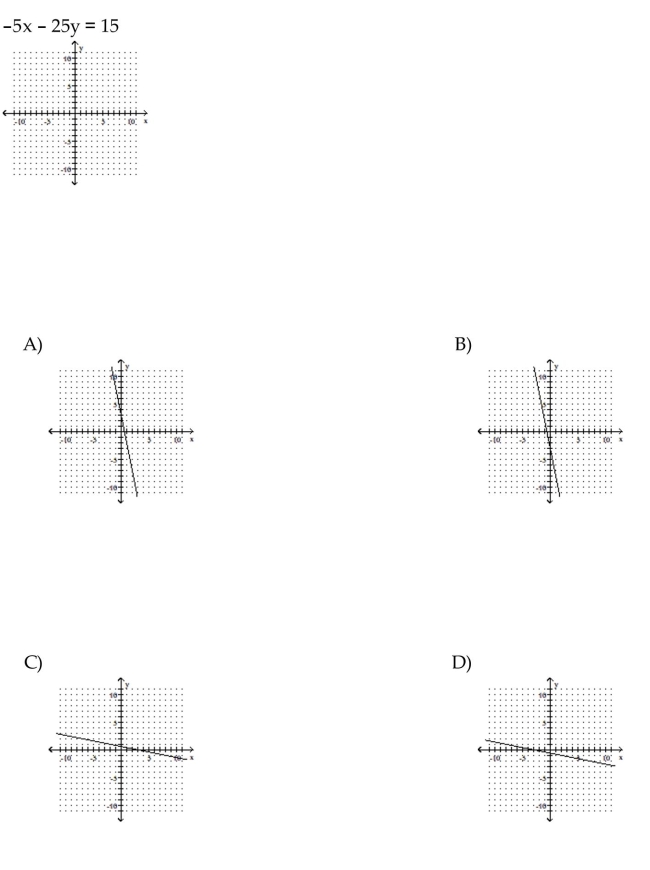
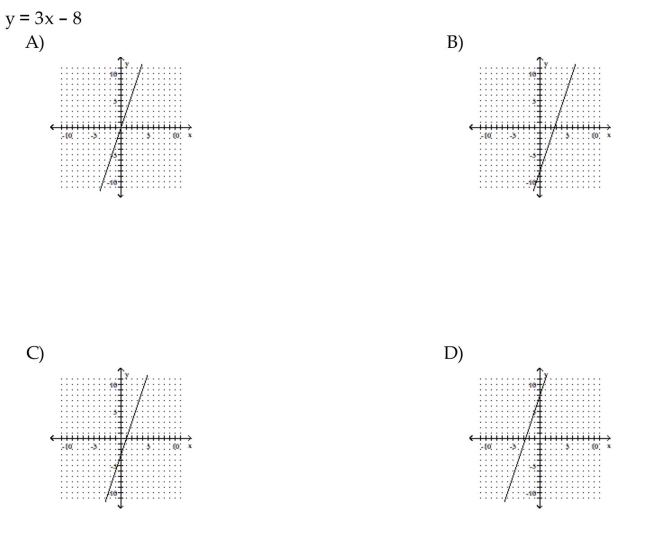
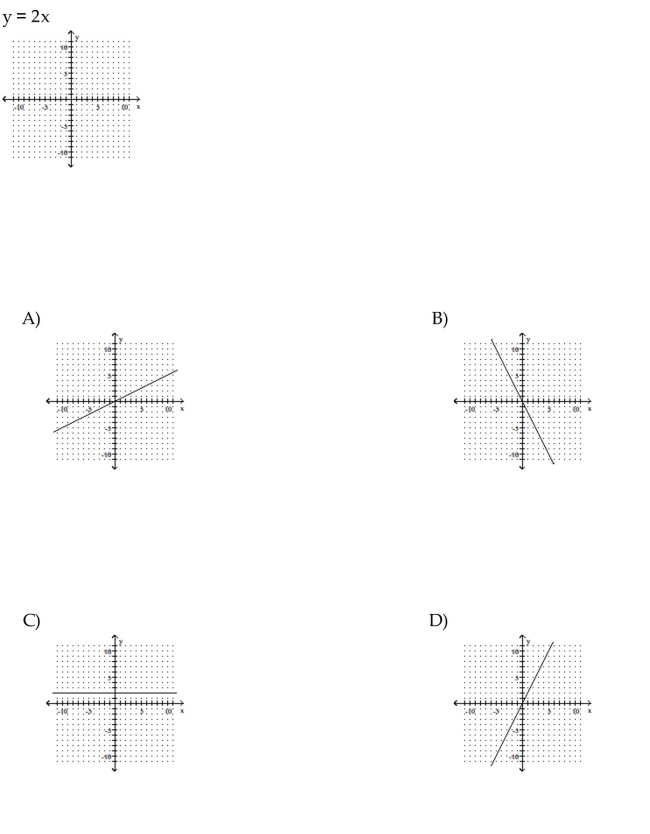
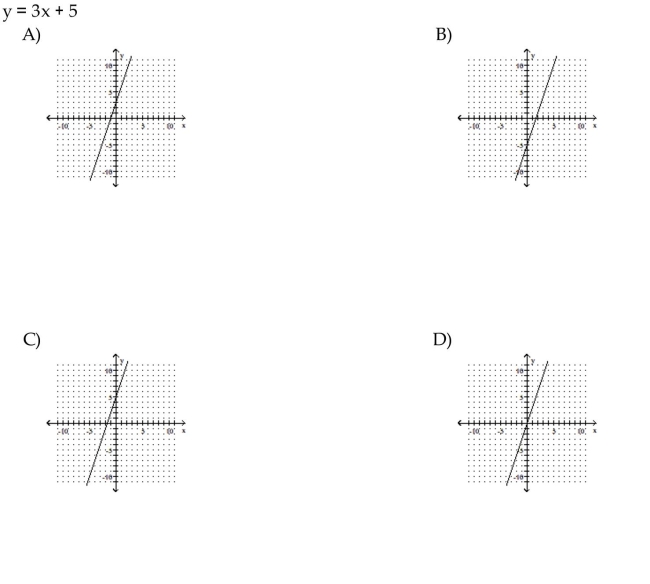
Match the graph with its equation.
Question
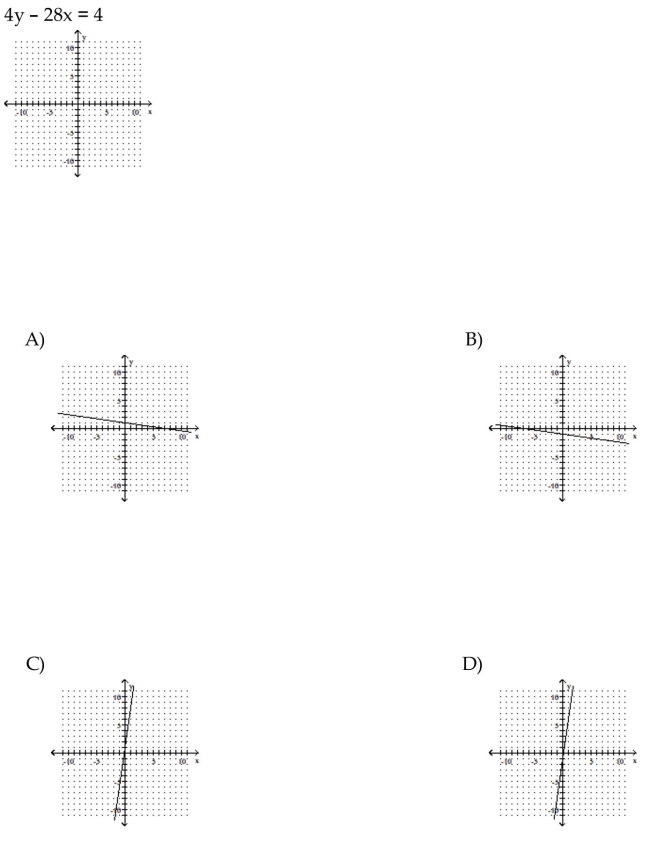
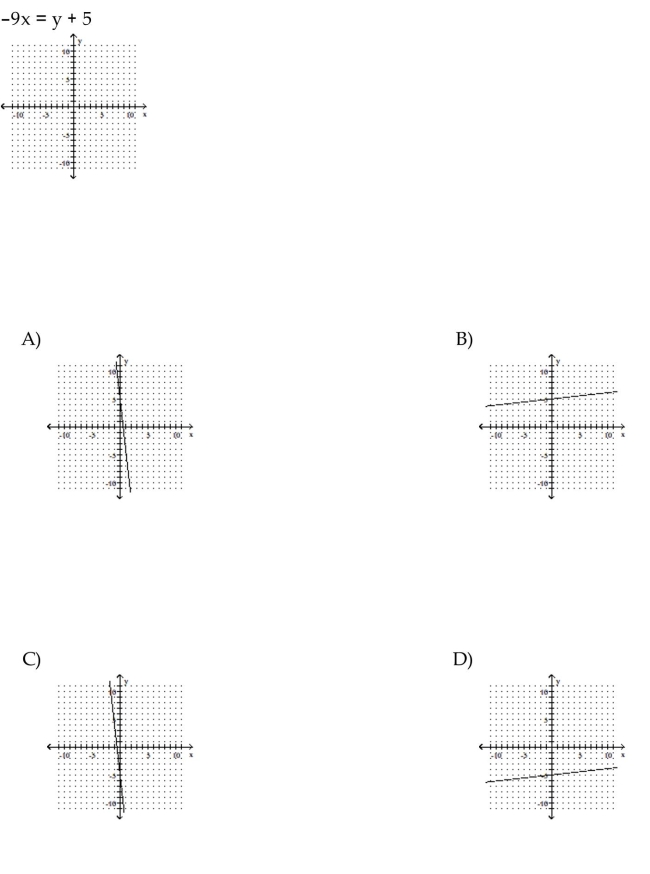
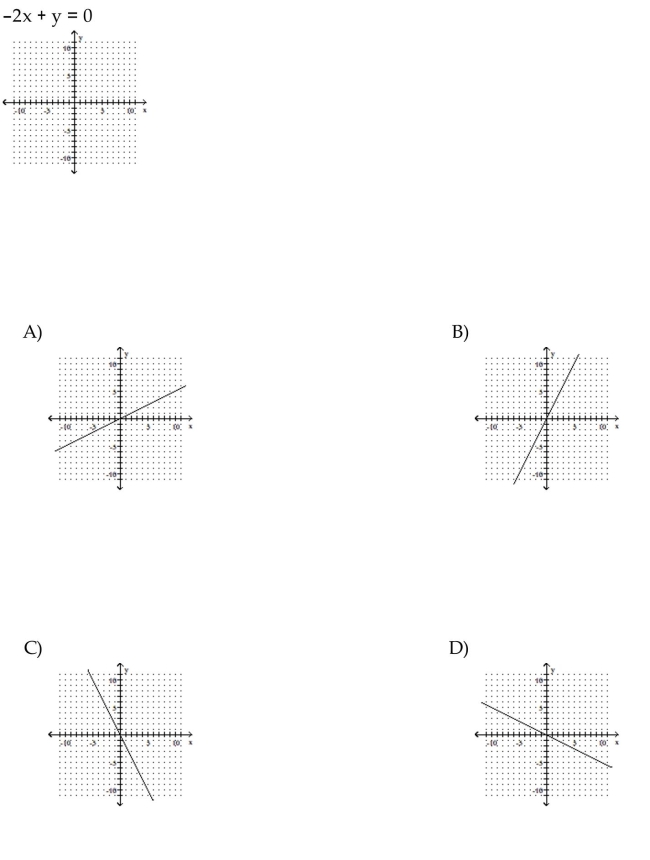
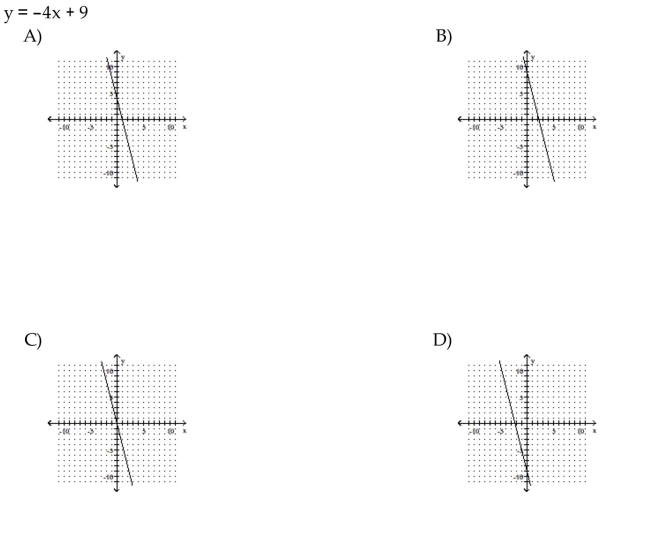
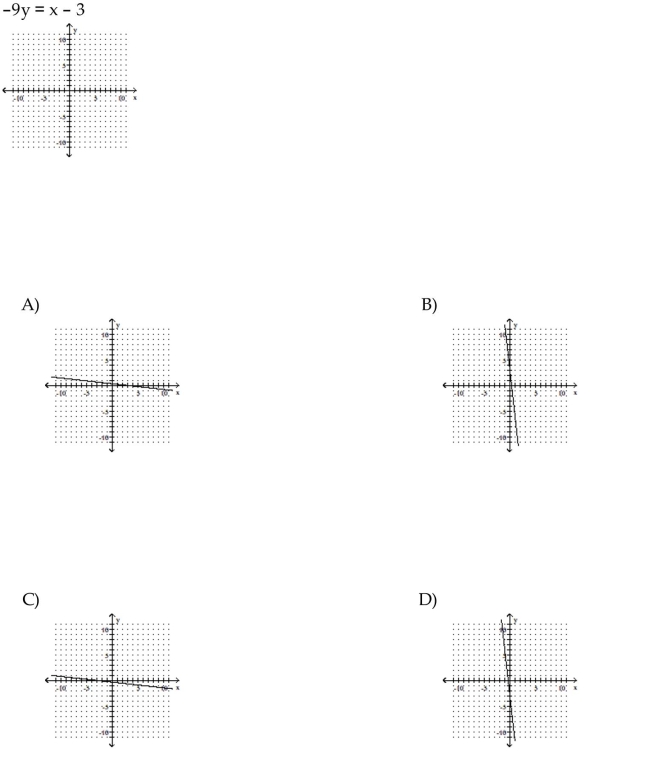
Graph the linear equation.

Question
Graph the linear equation.
Question
Match the graph with its equation.
Question
Question
Graph the linear equation.
Question
Graph the linear equation.

Question
Graph the linear equation.

Question
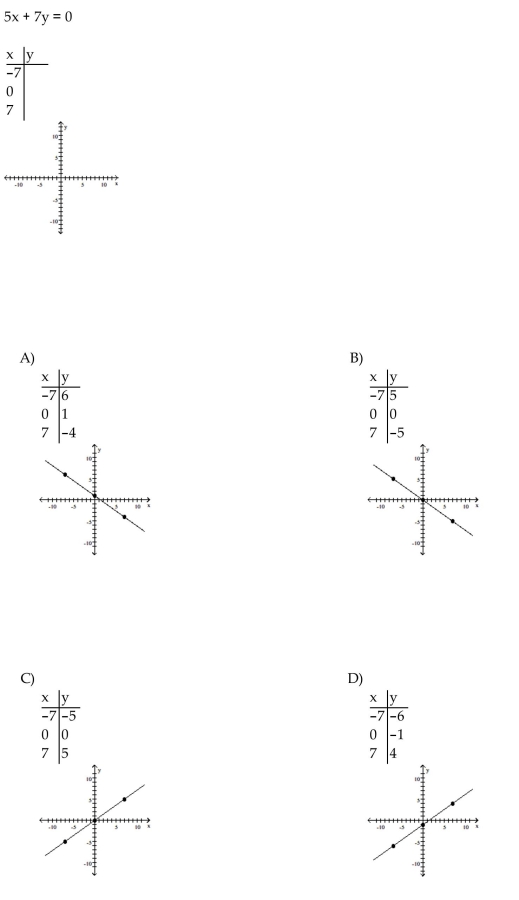
Find three ordered pair solutions by completing the table. Then use the ordered pairs to graph the equation.
Question
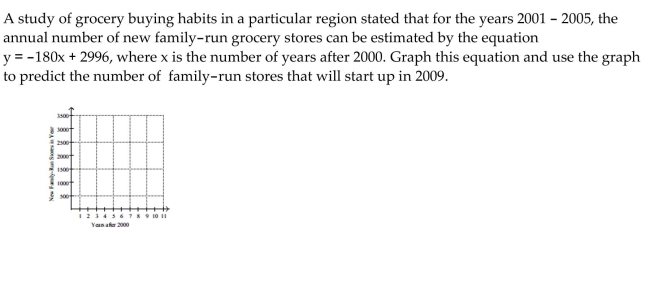
Solve.
Question
Find three ordered pair solutions by completing the table. Then use the ordered pairs to graph the equation.
Question
Graph the linear equation.
Question
Graph the linear equation.
Question
Find three ordered pair solutions by completing the table. Then use the ordered pairs to graph the equation.
Question
Graph the linear equation.
Question
Match the graph with its equation.
Question
Graph the linear equation.
Question
Graph the linear equation.

Question
Match the graph with its equation.
Question
Graph the linear equation.


Unlock Deck
Sign up to unlock the cards in this deck!
Unlock Deck
Unlock Deck
1/313
Play
Full screen (f)
Deck 3: Graphing
1
Plot the ordered pair. State in which quadrant or on which axis the point lies.
C
2
Plot the ordered pair. State in which quadrant or on which axis the point lies.
B
3
Find the x- and y-coordinates of the following labeled points.
D
4
Plot the ordered pair. State in which quadrant or on which axis the point lies.
Unlock Deck
Unlock for access to all 313 flashcards in this deck.
Unlock Deck
k this deck
5
The bar graph shows the number of tickets sold each week by the garden club for their annual flower show. Use the
graph to answer the question.
During which week were 59 tickets sold?
A) week 6
B) week 4
C) week 5
D) week 1
graph to answer the question.
During which week were 59 tickets sold?
A) week 6
B) week 4
C) week 5
D) week 1
Unlock Deck
Unlock for access to all 313 flashcards in this deck.
Unlock Deck
k this deck
6
The line graph shows the recorded hourly temperatures in degrees Fahrenheit at an airport. Use the graph to answer the
question.
question.
Unlock Deck
Unlock for access to all 313 flashcards in this deck.
Unlock Deck
k this deck
7
Plot the ordered pair. State in which quadrant or on which axis the point lies.
Unlock Deck
Unlock for access to all 313 flashcards in this deck.
Unlock Deck
k this deck
8
Plot the ordered pair. State in which quadrant or on which axis the point lies.
Unlock Deck
Unlock for access to all 313 flashcards in this deck.
Unlock Deck
k this deck
9
Plot the ordered pair. State in which quadrant or on which axis the point lies.
Unlock Deck
Unlock for access to all 313 flashcards in this deck.
Unlock Deck
k this deck
10
The line graph shows the recorded hourly temperatures in degrees Fahrenheit at an airport. Use the graph to answer the
question.
What temperature was recorded at 10 a.m.?
question.
What temperature was recorded at 10 a.m.?
Unlock Deck
Unlock for access to all 313 flashcards in this deck.
Unlock Deck
k this deck
11
The bar graph shows the number of tickets sold each week by the garden club for their annual flower show. Use the
graph to answer the question.
How many more tickets were sold during week 3 than week 2?
A) 19 tickets
B) 29 tickets
C) 24 tickets
D) 41 tickets
graph to answer the question.
How many more tickets were sold during week 3 than week 2?
A) 19 tickets
B) 29 tickets
C) 24 tickets
D) 41 tickets
Unlock Deck
Unlock for access to all 313 flashcards in this deck.
Unlock Deck
k this deck
12
The line graph shows the recorded hourly temperatures in degrees Fahrenheit at an airport. Use the graph to answer the
question.
At what time was the temperature the lowest?
A) 9 a.m.
B) 6 p.m.
C) 1 p.m.
D) 10 a.m.
question.
At what time was the temperature the lowest?
A) 9 a.m.
B) 6 p.m.
C) 1 p.m.
D) 10 a.m.
Unlock Deck
Unlock for access to all 313 flashcards in this deck.
Unlock Deck
k this deck
13
The bar graph shows the number of tickets sold each week by the garden club for their annual flower show. Use the
graph to answer the question.
How many tickets were sold in all?
A) 195 tickets
B) 105 tickets
C) 205 tickets
D) 215 tickets
graph to answer the question.
How many tickets were sold in all?
A) 195 tickets
B) 105 tickets
C) 205 tickets
D) 215 tickets
Unlock Deck
Unlock for access to all 313 flashcards in this deck.
Unlock Deck
k this deck
14
Plot the ordered pair. State in which quadrant or on which axis the point lies.
Unlock Deck
Unlock for access to all 313 flashcards in this deck.
Unlock Deck
k this deck
15
The bar graph shows the number of tickets sold each week by the garden club for their annual flower show. Use the
graph to answer the question.
During which weeks were the number of tickets sold more than 25?
A) weeks 1, 4, and 5
B) weeks 1, 3, and 4
C) weeks 1, 3, and 5
D) weeks 1, 3, 4, and 5
graph to answer the question.
During which weeks were the number of tickets sold more than 25?
A) weeks 1, 4, and 5
B) weeks 1, 3, and 4
C) weeks 1, 3, and 5
D) weeks 1, 3, 4, and 5
Unlock Deck
Unlock for access to all 313 flashcards in this deck.
Unlock Deck
k this deck
16
The bar graph shows the number of tickets sold each week by the garden club for their annual flower show. Use the
graph to answer the question.
How many tickets were sold during week 2?
graph to answer the question.
How many tickets were sold during week 2?
Unlock Deck
Unlock for access to all 313 flashcards in this deck.
Unlock Deck
k this deck
17
Find the x- and y-coordinates of the following labeled points.
Unlock Deck
Unlock for access to all 313 flashcards in this deck.
Unlock Deck
k this deck
18
The bar graph shows the number of tickets sold each week by the garden club for their annual flower show. Use the
graph to answer the question.
During which week were the fewest number of tickets sold?
graph to answer the question.
During which week were the fewest number of tickets sold?
Unlock Deck
Unlock for access to all 313 flashcards in this deck.
Unlock Deck
k this deck
19
Find the x- and y-coordinates of the following labeled points.
Unlock Deck
Unlock for access to all 313 flashcards in this deck.
Unlock Deck
k this deck
20
The line graph shows the recorded hourly temperatures in degrees Fahrenheit at an airport. Use the graph to answer the
question.
During which hour did the temperature increase the most?
A) 9 a.m. to 10 a.m.
B) 10 a.m. to 11 a.m.
C) 12 p.m. to 1 p.m.
D) 1 p.m. to 2 p.m.
question.
During which hour did the temperature increase the most?
A) 9 a.m. to 10 a.m.
B) 10 a.m. to 11 a.m.
C) 12 p.m. to 1 p.m.
D) 1 p.m. to 2 p.m.
Unlock Deck
Unlock for access to all 313 flashcards in this deck.
Unlock Deck
k this deck
21
. Write the word or phrase that best completes each statement or answers the question.
Solve.
The table shows the number of cookies sold at a bake sale according to their diameter in
inches. Write the ordered pair data as an ordered pair of the form (diameter, number sold).
Then create a scatter diagram of the ordered pairs..
Solve.
The table shows the number of cookies sold at a bake sale according to their diameter in
inches. Write the ordered pair data as an ordered pair of the form (diameter, number sold).
Then create a scatter diagram of the ordered pairs..
Unlock Deck
Unlock for access to all 313 flashcards in this deck.
Unlock Deck
k this deck
22
Find the x- and y-coordinates of the following labeled points.
Unlock Deck
Unlock for access to all 313 flashcards in this deck.
Unlock Deck
k this deck
23
Complete the ordered pair so that it is a solution of the given linear equation.
Unlock Deck
Unlock for access to all 313 flashcards in this deck.
Unlock Deck
k this deck
24
. Write the word or phrase that best completes each statement or answers the question.
Solve.
The table shows the average hourly wage for non-managerial office workers in a town in
Indiana (in dollars) for the years shown. Write each paired data as an ordered pair of the
form (year, wage). Then create a scatter diagram of the ordered pairs.
Solve.
The table shows the average hourly wage for non-managerial office workers in a town in
Indiana (in dollars) for the years shown. Write each paired data as an ordered pair of the
form (year, wage). Then create a scatter diagram of the ordered pairs.
Unlock Deck
Unlock for access to all 313 flashcards in this deck.
Unlock Deck
k this deck
25
Determine whether the ordered pair is a solution of the given linear equation.
Unlock Deck
Unlock for access to all 313 flashcards in this deck.
Unlock Deck
k this deck
26
Determine whether the ordered pair is a solution of the given linear equation.
Unlock Deck
Unlock for access to all 313 flashcards in this deck.
Unlock Deck
k this deck
27
Determine whether the ordered pair is a solution of the given linear equation.
Unlock Deck
Unlock for access to all 313 flashcards in this deck.
Unlock Deck
k this deck
28
Determine whether the ordered pair is a solution of the given linear equation.
Unlock Deck
Unlock for access to all 313 flashcards in this deck.
Unlock Deck
k this deck
29
Determine whether the ordered pair is a solution of the given linear equation.
Unlock Deck
Unlock for access to all 313 flashcards in this deck.
Unlock Deck
k this deck
30
Complete the ordered pair so that it is a solution of the given linear equation.
Unlock Deck
Unlock for access to all 313 flashcards in this deck.
Unlock Deck
k this deck
31
Determine whether the ordered pair is a solution of the given linear equation.
Unlock Deck
Unlock for access to all 313 flashcards in this deck.
Unlock Deck
k this deck
32
Complete the ordered pair so that it is a solution of the given linear equation.
Unlock Deck
Unlock for access to all 313 flashcards in this deck.
Unlock Deck
k this deck
33
Determine whether the ordered pair is a solution of the given linear equation.
Unlock Deck
Unlock for access to all 313 flashcards in this deck.
Unlock Deck
k this deck
34
Complete the ordered pair so that it is a solution of the given linear equation.
Unlock Deck
Unlock for access to all 313 flashcards in this deck.
Unlock Deck
k this deck
35
. Write the word or phrase that best completes each statement or answers the question.
Solve.
The table shows the number of cans of soda sold at a campus stand on five days with
different high temperatures for the day. Write each paired data as an order pair of the form
(temperature, cans). Then create a scatter diagram of the ordered pairs.
Solve.
The table shows the number of cans of soda sold at a campus stand on five days with
different high temperatures for the day. Write each paired data as an order pair of the form
(temperature, cans). Then create a scatter diagram of the ordered pairs.
Unlock Deck
Unlock for access to all 313 flashcards in this deck.
Unlock Deck
k this deck
36
Determine whether the ordered pair is a solution of the given linear equation.
Unlock Deck
Unlock for access to all 313 flashcards in this deck.
Unlock Deck
k this deck
37
Determine whether the ordered pair is a solution of the given linear equation.
Unlock Deck
Unlock for access to all 313 flashcards in this deck.
Unlock Deck
k this deck
38
Determine whether the ordered pair is a solution of the given linear equation.
Unlock Deck
Unlock for access to all 313 flashcards in this deck.
Unlock Deck
k this deck
39
Complete the ordered pair so that it is a solution of the given linear equation.
Unlock Deck
Unlock for access to all 313 flashcards in this deck.
Unlock Deck
k this deck
40
Determine whether the ordered pair is a solution of the given linear equation.
Unlock Deck
Unlock for access to all 313 flashcards in this deck.
Unlock Deck
k this deck
41
Determine whether the equation is a linear equation in two variables.
Unlock Deck
Unlock for access to all 313 flashcards in this deck.
Unlock Deck
k this deck
42
Complete the ordered pair so that it is a solution of the given linear equation.
Unlock Deck
Unlock for access to all 313 flashcards in this deck.
Unlock Deck
k this deck
43
. Write the word or phrase that best completes each statement or answers the question.
Solve.
b. Find the number of mountain bikes that can be manufactured for $35,600
Solve.
b. Find the number of mountain bikes that can be manufactured for $35,600 Unlock Deck
Unlock for access to all 313 flashcards in this deck.
Unlock Deck
k this deck
44
. Write the word or phrase that best completes each statement or answers the question.
Solve.
Solve.
Unlock Deck
Unlock for access to all 313 flashcards in this deck.
Unlock Deck
k this deck
45
Complete the table of ordered pairs for the given linear equation; then plot the solution.
Unlock Deck
Unlock for access to all 313 flashcards in this deck.
Unlock Deck
k this deck
46
Complete the table of ordered pairs for the given linear equation; then plot the solution.
Unlock Deck
Unlock for access to all 313 flashcards in this deck.
Unlock Deck
k this deck
47
Determine whether the equation is a linear equation in two variables.
Unlock Deck
Unlock for access to all 313 flashcards in this deck.
Unlock Deck
k this deck
48
Complete the ordered pair so that it is a solution of the given linear equation.
Unlock Deck
Unlock for access to all 313 flashcards in this deck.
Unlock Deck
k this deck
49
Find three ordered pair solutions by completing the table. Then use the ordered pairs to graph the equation.
Unlock Deck
Unlock for access to all 313 flashcards in this deck.
Unlock Deck
k this deck
50
Determine whether the equation is a linear equation in two variables.
Unlock Deck
Unlock for access to all 313 flashcards in this deck.
Unlock Deck
k this deck
51
. Write the word or phrase that best completes each statement or answers the question.
Solve.
Solve.
Unlock Deck
Unlock for access to all 313 flashcards in this deck.
Unlock Deck
k this deck
52
Determine whether the equation is a linear equation in two variables.
Unlock Deck
Unlock for access to all 313 flashcards in this deck.
Unlock Deck
k this deck
53
Determine whether the equation is a linear equation in two variables.
Unlock Deck
Unlock for access to all 313 flashcards in this deck.
Unlock Deck
k this deck
54
Determine whether the equation is a linear equation in two variables.
Unlock Deck
Unlock for access to all 313 flashcards in this deck.
Unlock Deck
k this deck
55
Determine whether the equation is a linear equation in two variables.
Unlock Deck
Unlock for access to all 313 flashcards in this deck.
Unlock Deck
k this deck
56
Determine whether the equation is a linear equation in two variables.
Unlock Deck
Unlock for access to all 313 flashcards in this deck.
Unlock Deck
k this deck
57
Complete the ordered pair so that it is a solution of the given linear equation.
Unlock Deck
Unlock for access to all 313 flashcards in this deck.
Unlock Deck
k this deck
58
Determine whether the equation is a linear equation in two variables.
Unlock Deck
Unlock for access to all 313 flashcards in this deck.
Unlock Deck
k this deck
59
Determine whether the equation is a linear equation in two variables.
Unlock Deck
Unlock for access to all 313 flashcards in this deck.
Unlock Deck
k this deck
60
Complete the table of ordered pairs for the given linear equation; then plot the solution.
Unlock Deck
Unlock for access to all 313 flashcards in this deck.
Unlock Deck
k this deck
61
Match the graph with its equation.
Unlock Deck
Unlock for access to all 313 flashcards in this deck.
Unlock Deck
k this deck
62
Graph the linear equation.
Unlock Deck
Unlock for access to all 313 flashcards in this deck.
Unlock Deck
k this deck
63
Graph the linear equation.
Unlock Deck
Unlock for access to all 313 flashcards in this deck.
Unlock Deck
k this deck
64
Match the graph with its equation.
Unlock Deck
Unlock for access to all 313 flashcards in this deck.
Unlock Deck
k this deck
65
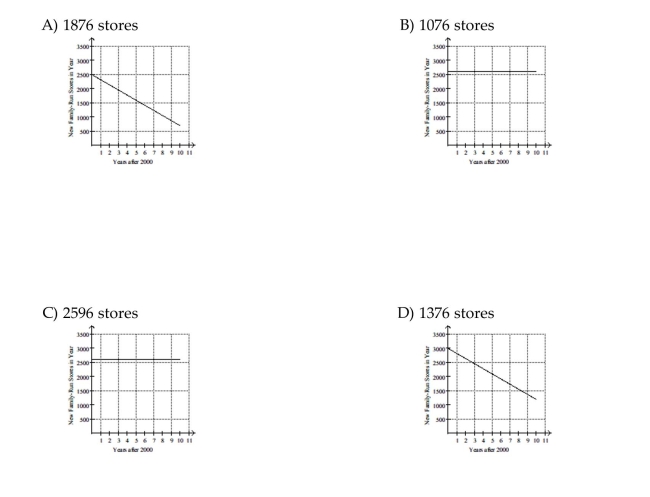
Solve.
A small-business research project estimated that for the years 1998-2003, the total number of retail bicycle stores in a particular region would grow according to the linear equation y = 20x + 600,
A small-business research project estimated that for the years 1998-2003, the total number of retail bicycle stores in a particular region would grow according to the linear equation y = 20x + 600,
Unlock Deck
Unlock for access to all 313 flashcards in this deck.
Unlock Deck
k this deck
66
Graph the linear equation.
Unlock Deck
Unlock for access to all 313 flashcards in this deck.
Unlock Deck
k this deck
67
Graph the linear equation.
Unlock Deck
Unlock for access to all 313 flashcards in this deck.
Unlock Deck
k this deck
68
Graph the linear equation.
Unlock Deck
Unlock for access to all 313 flashcards in this deck.
Unlock Deck
k this deck
69
Find three ordered pair solutions by completing the table. Then use the ordered pairs to graph the equation.
Unlock Deck
Unlock for access to all 313 flashcards in this deck.
Unlock Deck
k this deck
70
Solve.
Unlock Deck
Unlock for access to all 313 flashcards in this deck.
Unlock Deck
k this deck
71
Find three ordered pair solutions by completing the table. Then use the ordered pairs to graph the equation.
Unlock Deck
Unlock for access to all 313 flashcards in this deck.
Unlock Deck
k this deck
72
Graph the linear equation.
Unlock Deck
Unlock for access to all 313 flashcards in this deck.
Unlock Deck
k this deck
73
Graph the linear equation.
Unlock Deck
Unlock for access to all 313 flashcards in this deck.
Unlock Deck
k this deck
74
Find three ordered pair solutions by completing the table. Then use the ordered pairs to graph the equation.
Unlock Deck
Unlock for access to all 313 flashcards in this deck.
Unlock Deck
k this deck
75
Graph the linear equation.
Unlock Deck
Unlock for access to all 313 flashcards in this deck.
Unlock Deck
k this deck
76
Match the graph with its equation.
Unlock Deck
Unlock for access to all 313 flashcards in this deck.
Unlock Deck
k this deck
77
Graph the linear equation.
Unlock Deck
Unlock for access to all 313 flashcards in this deck.
Unlock Deck
k this deck
78
Graph the linear equation.
Unlock Deck
Unlock for access to all 313 flashcards in this deck.
Unlock Deck
k this deck
79
Match the graph with its equation.
Unlock Deck
Unlock for access to all 313 flashcards in this deck.
Unlock Deck
k this deck
80
Graph the linear equation.
Unlock Deck
Unlock for access to all 313 flashcards in this deck.
Unlock Deck
k this deck
Unlock Deck
Unlock for access to all 313 flashcards in this deck.


