Exam 3: Graphing
Exam 1: Review of Real Numbers490 Questions
Exam 2: Equations, Inequalities, and Problem Solving332 Questions
Exam 3: Graphing313 Questions
Exam 4: Solving Systems of Linear Equations146 Questions
Exam 5: Exponents and Polynomials304 Questions
Exam 6: Factoring Polynomials261 Questions
Exam 7: Rational Expressions327 Questions
Exam 8: More on Functions and Graphs192 Questions
Exam 9: Inequalities and Absolute Value148 Questions
Exam 10: Rational Exponents, Radicals, and Complex Numbers379 Questions
Exam 11: Quadratic Equations and Functions242 Questions
Exam 12: Exponential and Logarithmic Functions302 Questions
Exam 13: Conic Sections153 Questions
Exam 14: Sequences, Series, and the Binomial Theorem201 Questions
Select questions type
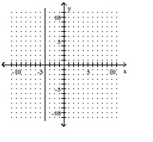
Match the graph with its equation.
-
Free
(Multiple Choice)
4.9/5  (34)
(34)
Correct Answer: Verified
B
Solve. Assume the exercise describes a linear relationship.
-Persons taking a 30-hour review course to prepare for a standardized exam average a score of 620 on that exam. Persons taking a 70-hour review course average a score of 770 . Find a linear equation which fits this data, and which relates score to review time. Use this equation to predict an average score for persons taking a 50-hour review course. Round your answer to the nearest tenth.
Free
(Multiple Choice)
4.8/5 (28)
Correct Answer:Verified
D
Determine whether the pair of lines is parallel, perpendicular, or neither.
- y=-5x-8 y=5x-1
Free
(Multiple Choice)
4.8/5 (41)
Correct Answer:Verified
C
Determine whether the equation is a linear equation in two variables.
-
(True/False)
4.8/5 (37)
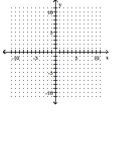
Graph the linear equation by finding and plotting its intercepts.
-
(Multiple Choice)
4.8/5 (38)
Write the word or phrase that best completes each statement or answers the question.
Solve.
-The table shows the number of cans of soda sold at a campus stand on five days with
different high temperatures for the day. Write each paired data as an order pair of the form
(temperature, cans). Then create a scatter diagram of the ordered pairs. High TemperatureNumber of Cans Sold 70 325 75 350 80 440 85 470 90 575
(Essay)
4.9/5 (36)
The line graph shows the recorded hourly temperatures in degrees Fahrenheit at an airport. Use the graph to answer the
question. 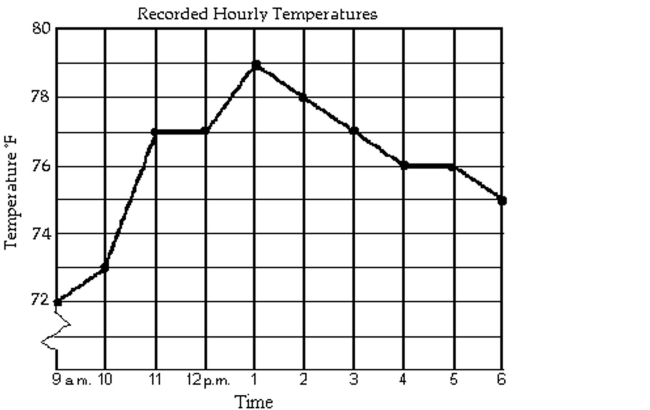 -During which hour did the temperature increase the most?
(Multiple Choice)
4.8/5 (28)
Find an equation of the line with the given slope that passes through the given point. Write the equation in the form
Ax + By = C.
-
(Multiple Choice)
4.7/5 (38)
Solve.
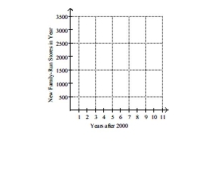
-A study of grocery buying habits in a particular region stated that for the years , the annual number of new family-run grocery stores can be estimated by the equation , where is the number of years after 2000. Graph this equation and use the graph to predict the number of family-run stores that will start up in
(Multiple Choice)
4.8/5 (41)
The bar graph shows the number of tickets sold each week by the garden club for their annual flower show. Use the
graph to answer the question.
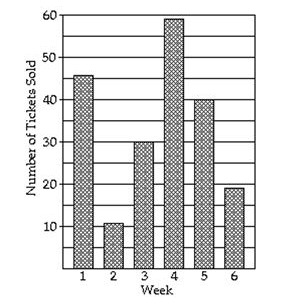 -During which weeks were the number of tickets sold more than 25?
(Multiple Choice)
4.9/5 (44)
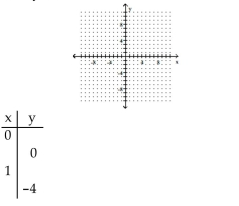
Complete the table of ordered pairs for the given linear equation; then plot the solution.
-
(Multiple Choice)
4.7/5 (35)
Solve. Assume the exercise describes a linear relationship.
-An investment is worth in 2007. By 2011 it has grown to . Let be the value of the investment in the year , where represents 2007. Write a linear equation that models the value of the investment in the year .
(Multiple Choice)
4.9/5 (29)
Fill in the blank with one of the words listed below. relation function domain range standard slope-intercept -axis -axis solution linear slope point-slope x-intercept -intercept
-To find an x-intercept of a graph, let = 0.
(Multiple Choice)
4.8/5 (33)
Filters
- Essay(0)
- Multiple Choice(0)
- Short Answer(0)
- True False(0)
- Matching(0)