Deck 6: Normal Probability Distributions
Full screen (f)
Question
Question
Question
Question
Question
Question
Question
Question
Question
Question
Question
Question
Question
Question
Question
Question
Question
Question
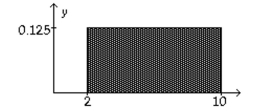
Consider the uniform distribution shown below. Find the probability that x is greater than 6. Discuss the relationship between area under a density curve and probability.
Question
Question
Question
Question
Question
Question
Question
A normal quartile plot is given below for the weekly incomes (in dollars) of a sample of engineers in one town. Use the plot to assess the normality of the incomes of engineers in this town. Explain your reasoning. 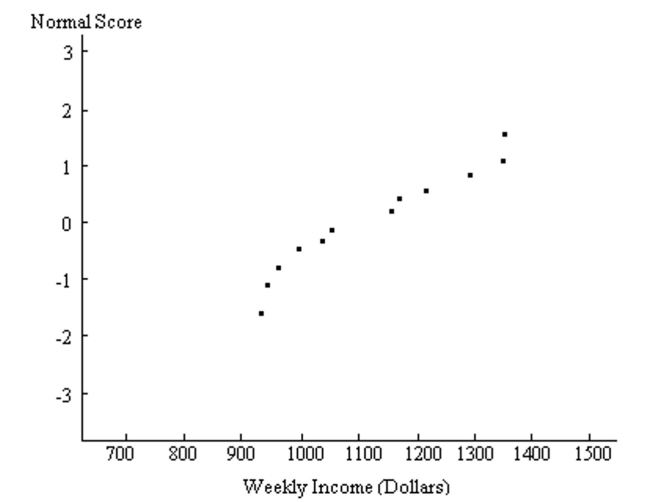
Question
Question
Question
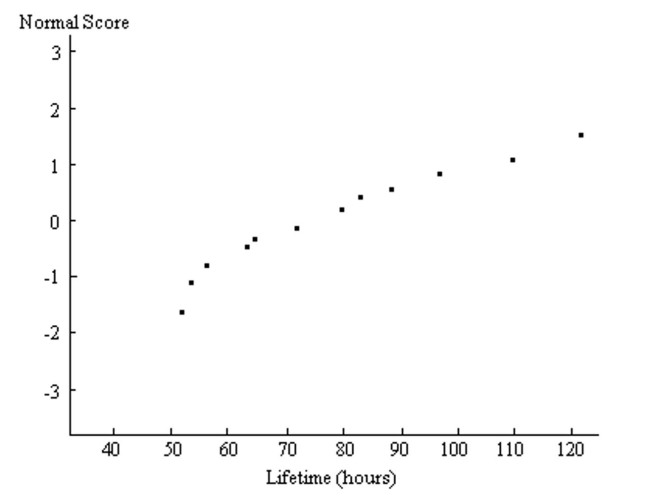
A normal quartile plot is given below for the lifetimes (in hours) of a sample of batteries of a particular brand. Use the plot to assess the normality of the lifetimes of these batteries. Explain your reasoning.
Question
Question
Construct a normal quartile plot of the given data. Use your plot to determine whether the data come from a normally distributed population.
-The weekly incomes (in dollars) of a sample of 12 nurses working at a Los Angeles hospital
are given below.
-The weekly incomes (in dollars) of a sample of 12 nurses working at a Los Angeles hospital
are given below.
Question
Question
Question
Question
Question
Question
Question
Question
Question
Question
Question
Question
Question
Question
Question
Question
Question
Question
Question
Question
Question
Question
Question
Question
Question
Question
A normal quartile plot is given below for a sample of scores on an aptitude test. Use the plot to assess the normality of scores on this test. Explain your reasoning. 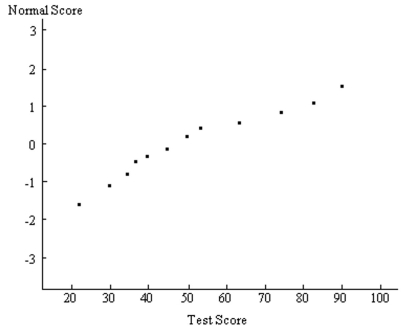
Question
Question
Question
Question
Question
Question
Question
Construct a normal quartile plot of the given data. Use your plot to determine whether the data come from a normally distributed population.
-The systolic blood pressure (in mmHg) is given below for a sample of 12 men aged between 60 and 65.
-The systolic blood pressure (in mmHg) is given below for a sample of 12 men aged between 60 and 65.
Question
Question
Question
Question
Question
Question
Question
Question
Question
Find the indicated z score. The graph depicts the standard normal distribution with mean 0 and standard deviation 1.
Shaded area is 0.8599.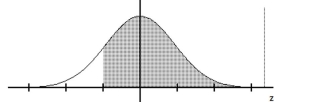
A) 0.8051
B) 1.08
C) -1.08
D) 0.5557
Shaded area is 0.8599.
A) 0.8051
B) 1.08
C) -1.08
D) 0.5557
Question
Question
Question
Find the indicated IQ score. The graph depicts IQ scores of adults, and those scores are normally distributed with a mean of 100 and a standard deviation of 15 (as on the Wechsler test). 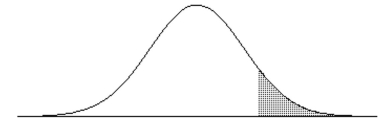 The shaded area under the curve is 0.10.
A) 108.1
B) 100.5
C) 80.8
D) 119.2
The shaded area under the curve is 0.10.A) 108.1
B) 100.5
C) 80.8
D) 119.2
Question
Question
A normal quartile plot is given below for a sample of scores on an aptitude test. Use the plot to assess the normality of scores on this test. Explain your reasoning. 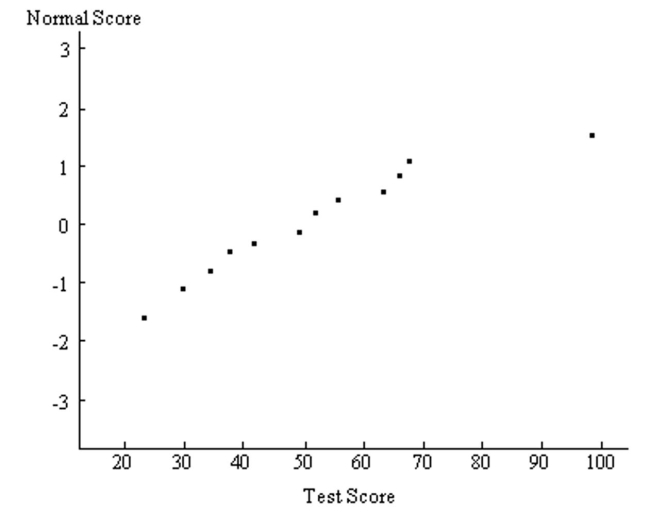
Question
Question
Question

Unlock Deck
Sign up to unlock the cards in this deck!
Unlock Deck
Unlock Deck
1/226
Play
Full screen (f)
Deck 6: Normal Probability Distributions
1
Examine the given data set and determine whether the requirement of a normal distribution is satisfied. Assume that the requirement for a normal distribution is loose in the sense that the population distribution need not be exactly normal, but it must have a distribution which is basically symmetric with only one mode. Explain why you do or do not think that the requirement is satisfied.
-The ages of 30 students selected randomly from one college are as follows:
-The ages of 30 students selected randomly from one college are as follows:
The requirement for normality is not satisfied since a histogram of the data is not bell shaped. The data does have a single mode, however the histogram is not symmetric but is skewed to the right.
2
Personal phone calls received in the last three days by a new employee were 2, 5, and 7. Assume that samples of size 2 are randomly selected with replacement from this population of three values. List the different possible samples, and find the mean of each of them.
Possible samples:
Means:
Means:
3
Examine the given data set and determine whether the requirement of a normal distribution is satisfied. Assume that the requirement for a normal distribution is loose in the sense that the population distribution need not be exactly normal, but it must have a distribution which is basically symmetric with only one mode. Explain why you do or do not think that the requirement is satisfied.
-The amount of rainfall (in inches) in 25 consecutive years in a certain city.
-The amount of rainfall (in inches) in 25 consecutive years in a certain city.
The requirement for normality is satisfied since a histogram of the data is roughly bell shaped; it is roughly symmetric with a single mode.
4
Three randomly selected households are surveyed as a pilot project for a larger survey to be conducted later. The numbers of people in the households are 3, 8, and 10. Consider the values of 3, 8, and 10 to be a population. Assume that samples of size n 2 are randomly selected with replacement from the population of 3, 8, and 10. The nine different samples are as follows: (3, 3), (3, 8), (3, 10), (8, 3), (8, 8), (8, 10), (10, 3), (10, 8), and (10, 10).
(i) Find the median of each of the nine samples, then summarize the sampling distribution of the medians in the format of a table representing the probability distribution.
(ii) Compare the population median to the mean of the sample medians. (iii) Do the sample medians target the value of the population median? In general, do medians make good estimators of population medians? Why or why not?
Unlock Deck
Unlock for access to all 226 flashcards in this deck.
Unlock Deck
k this deck
5
Which of the following is true about the distribution of IQ scores?
A) Its distribution is skewed to the left.
B) The area under its bell-shaped curve is 1.
C) Its distribution is skewed to the right.
D) The area under its bell-shaped curve is 10.
A) Its distribution is skewed to the left.
B) The area under its bell-shaped curve is 1.
C) Its distribution is skewed to the right.
D) The area under its bell-shaped curve is 10.
Unlock Deck
Unlock for access to all 226 flashcards in this deck.
Unlock Deck
k this deck
6
Three randomly selected households are surveyed as a pilot project for a larger survey to be conducted later. The numbers of people in the households are 5, 8, and 11. Consider the values of 5, 8, and 11 to be a population. Assume that samples of size n = 2 are randomly selected with replacement from the population of 5, 8, and 11. The nine different samples are as follows:
(5, 5), (5, 8), (5, 11), (8, 5), (8, 8), (8, 11), (11, 5), (11, 8), and (11, 11). (i) Find the range of each of the nine samples, then summarize the sampling distribution of the ranges in the format of a table representing the probability distribution.
(ii) Compare the population range to the mean of the sample ranges. (iii) Do the sample ranges target the value of the population range? In general, do ranges make good estimators of population ranges? Why or why not.?
Unlock Deck
Unlock for access to all 226 flashcards in this deck.
Unlock Deck
k this deck
7
Which of the following notations represents the standard deviation of the population consisting of all sample means?
A)
B)
C)
D)
A)
B)
C)
D)
Unlock Deck
Unlock for access to all 226 flashcards in this deck.
Unlock Deck
k this deck
8
The typical computer random-number generator yields numbers in a uniform distribution between 0 and 1 with a mean of 0.500 and a standard deviation of 0.289. (a) Suppose a sample of size 50 is randomly generated. Find the probability that the mean is below 0.300.
(b) Suppose a sample size of 15 is randomly generated. Find the probability that the mean is below 0.300. These two problems appear to be very similar. Only one can be solved by the central limit theorem. Which one and why?
(b) Suppose a sample size of 15 is randomly generated. Find the probability that the mean is below 0.300. These two problems appear to be very similar. Only one can be solved by the central limit theorem. Which one and why?
Unlock Deck
Unlock for access to all 226 flashcards in this deck.
Unlock Deck
k this deck
9
Draw a normal distribution and identify the mean of x on the distribution. Discuss the symmetry and the total area under the curve. What is the probability that a value of x will be greater than the mean?
Unlock Deck
Unlock for access to all 226 flashcards in this deck.
Unlock Deck
k this deck
10
Three randomly selected households are surveyed as a pilot project for a larger survey to be conducted later. The numbers of people in the households are 4, 6, and 9. Consider the values of 4, 6, and 9 to be a population. Assume that samples of size 2 are randomly selected with replacement from the population of 4, 6, and 9. The nine different samples are as follows:
(4, 4), (4, 6), (4, 9), (6, 4), (6, 6), (6, 9), (9, 4), (9, 6), and (9, 9).
(i) Find the standard deviation
of each of the nine samples, then summarize the sampling distribution of the standard deviations in the format of a table representing the probability distribution.
(ii) Compare the population standard deviation to the mean of the sample standard deviations.
(iii) Do the sample standard deviations target the value of the population standard deviation? In general, do standard deviations make good estimators of population standard deviation? Why or why not?
Unlock Deck
Unlock for access to all 226 flashcards in this deck.
Unlock Deck
k this deck
11
Three randomly selected households are surveyed as a pilot project for a larger survey to be conducted later. The numbers of people in the households are 1, 4, and 9. Consider the values of 1, 4, and 9 to be a population. Assume that samples of size n = 2 are randomly selected with replacement from the population of 1, 4, and 9. The nine different samples are as follows:
(1, 1), (1, 4), (1, 9), (4, 1), (4, 4), (4, 9), (9, 1), (9, 4), and (9, 9). (i) Find the range of each of the nine samples, then summarize the sampling distribution of the ranges in the format of a table representing the probability distribution. (ii) Compare the population range to the mean of the sample ranges. (iii) Do the sample ranges target the value of the population range? In general, do ranges make good estimators of population ranges? Why or why not.?
(1, 1), (1, 4), (1, 9), (4, 1), (4, 4), (4, 9), (9, 1), (9, 4), and (9, 9). (i) Find the range of each of the nine samples, then summarize the sampling distribution of the ranges in the format of a table representing the probability distribution. (ii) Compare the population range to the mean of the sample ranges. (iii) Do the sample ranges target the value of the population range? In general, do ranges make good estimators of population ranges? Why or why not.?
Unlock Deck
Unlock for access to all 226 flashcards in this deck.
Unlock Deck
k this deck
12
Describe the difference between z scores and area scores. Show each score's relationship to the graph of the standard normal distribution and discuss the possible sign values for each score.
Unlock Deck
Unlock for access to all 226 flashcards in this deck.
Unlock Deck
k this deck
13
Which of the following is true about the distribution of IQ scores?
A) The mean is 1.
B) The mean is 75.
C) The mean is 50.
D) The standard deviation is 15.
A) The mean is 1.
B) The mean is 75.
C) The mean is 50.
D) The standard deviation is 15.
Unlock Deck
Unlock for access to all 226 flashcards in this deck.
Unlock Deck
k this deck
14
State the Empirical Rule. Use the standard normal distribution to explain the percent values given in the Empirical Rule.
Unlock Deck
Unlock for access to all 226 flashcards in this deck.
Unlock Deck
k this deck
15
The number of books sold over the course of the four-day book fair were 108, 111, 259, and 58. Assume that samples of size 2 are randomly selected with replacement from this population of four values. Identify the probability of each sample, and describe the sampling distribution of the sample means.
Unlock Deck
Unlock for access to all 226 flashcards in this deck.
Unlock Deck
k this deck
16
Three randomly selected households are surveyed as a pilot project for a larger survey to be conducted later. The numbers of people in the households are 2, 4, and 10. Consider the values of 2, 4, and 10 to be a population. Assume that samples of size n = 2 are randomly selected with replacement from the population of 2, 4, and 10. The nine different samples are as follows: (2, 2), (2, 4), (2, 10), (4, 2), (4, 4), (4, 10), (10, 2), (10, 4), and (10, 10).
(i) Find the mean of each of the nine samples, then summarize the sampling distribution of the means in the format of a table representing the probability distribution.
(ii) Compare the population mean to the mean of the sample means.
(iii) Do the sample means target the value of the population mean? In general, do means make good estimators of population means? Why or why not?
Unlock Deck
Unlock for access to all 226 flashcards in this deck.
Unlock Deck
k this deck
17
Three randomly selected households are surveyed as a pilot project for a larger survey to be conducted later. The numbers of people in the households are 3, 8, and 9. Consider the values of 3, 8, and 9 to be a population. Assume that samples of size n = 2 are randomly selected with replacement from the population of 3, 8, and 9. The nine different samples are as follows: (3, 3), (3, 8), (3, 9), (8, 3), (8, 8), (8, 9), (9, 3), (9, 8), and (9, 9). (i) Find the mean of each of the nine samples, then summarize the sampling distribution of the means in the format of a table representing the probability distribution. (ii) Compare the population mean to the mean of the sample means. (iii) Do the sample means target the value of the population mean? In general, do means make good estimators of population means? Why or why not?
Unlock Deck
Unlock for access to all 226 flashcards in this deck.
Unlock Deck
k this deck
18
Consider the uniform distribution shown below. Find the probability that x is greater than 6. Discuss the relationship between area under a density curve and probability.
Unlock Deck
Unlock for access to all 226 flashcards in this deck.
Unlock Deck
k this deck
19
Lengths of pregnancies are normally distributed with a mean of 268 days and a standard deviation of 15 days. (a) Find the probability of a pregnancy lasting more than 250 days. (b) Find the probability of a pregnancy lasting more than 280 days. Draw the diagram for each and discuss the part of the solution that would be different to finding the requested probabilities.
Unlock Deck
Unlock for access to all 226 flashcards in this deck.
Unlock Deck
k this deck
20
Describe in detail the sampling distribution of sample means. Refer specifically to the shape of the distribution.
Unlock Deck
Unlock for access to all 226 flashcards in this deck.
Unlock Deck
k this deck
21
Define a density curve and describe the two properties that it must satisfy. Show a density curve for a uniform distribution. Make sure that your graph satisfies both properties.
Unlock Deck
Unlock for access to all 226 flashcards in this deck.
Unlock Deck
k this deck
22
Three randomly selected households are surveyed as a pilot project for a larger survey to be conducted later. The numbers of people in the households are 1, 4, and 8. Consider the values of 1, 4, and 8 to be a population. Assume that samples of size n = 2 are randomly selected with replacement from the population of 1, 4, and 8. The nine different samples are as follows: (1, 1), (1, 4), (1, 8), (4, 1), (4, 4), (4, 8), (8, 1), (8, 4), and (8, 8).
(i) Find the median of each of the nine samples, then summarize the sampling distribution of the medians in the format of a table representing the probability distribution.
(ii) Compare the population median to the mean of the sample medians.
(iii) Do the sample medians target the value of the population median? In general, do medians make good estimators of population medians? Why or why not?
Unlock Deck
Unlock for access to all 226 flashcards in this deck.
Unlock Deck
k this deck
23
In a certain population, 10% of people are left handed. Suppose that in calculating each of the probabilities below, you use the normal distribution as an approximation to the binomial but that you fail to use a continuity correction. In which case will the resulting error be the greatest? In which case will the error be the least? Explain your thinking.
A: the probability that among 50 randomly selected people, at least 5 are left handed
B: the probability that among 100 randomly selected people, more than 10 are left handed
C: the probability that among 200 randomly selected people, at most 20 are left handed
A: the probability that among 50 randomly selected people, at least 5 are left handed
B: the probability that among 100 randomly selected people, more than 10 are left handed
C: the probability that among 200 randomly selected people, at most 20 are left handed
Unlock Deck
Unlock for access to all 226 flashcards in this deck.
Unlock Deck
k this deck
24
The ages (in years) of the four U.S. vice presidents who assumed office after presidential assassinations are 56 (A. Johnson), 51 (C. Arthur), 42 (T. Roosevelt), and 55 (L.B. Johnson).
(i) Assuming that 2 of the ages are randomly selected with replacement, list the 16 different possible samples.
(ii) Find the range of each of the 16 samples, then summarize the sampling distribution of the ranges in the format of a table representing the probability distribution.
(iii) Compare the population range to the mean of the sample ranges.
(iv) Do the sample ranges target the value of the population range? In general, do sample ranges make good estimators of population ranges? Why or why not?
Unlock Deck
Unlock for access to all 226 flashcards in this deck.
Unlock Deck
k this deck
25
A normal quartile plot is given below for the weekly incomes (in dollars) of a sample of engineers in one town. Use the plot to assess the normality of the incomes of engineers in this town. Explain your reasoning.
Unlock Deck
Unlock for access to all 226 flashcards in this deck.
Unlock Deck
k this deck
26
Examine the given data set and determine whether the requirement of a normal distribution is satisfied. Assume that the requirement for a normal distribution is loose in the sense that the population distribution need not be exactly normal, but it must have a distribution which is basically symmetric with only one mode. Explain why you do or do not think that the requirement is satisfied.
-The heart rates (in beats per minute) of 30 randomly selected students are given below.
-The heart rates (in beats per minute) of 30 randomly selected students are given below.
Unlock Deck
Unlock for access to all 226 flashcards in this deck.
Unlock Deck
k this deck
27
Three randomly selected households are surveyed as a pilot project for a larger survey to be conducted later. The numbers of people in the households are 1, 3, and 9. Consider the values of 1, 3, and 9 to be a population. Assume that samples of size n = 2 are randomly selected with replacement from the population of 1, 3, and 9. The nine different samples are as follows: (1, 1), (1, 3), (1, 9), (3, 1), (3, 3), (3, 9), (9, 1), (9, 3), and (9, 9).
(i) Find the variance of each of the nine samples, then summarize the sampling distribution of the variances in the format of a table representing the probability distribution.
(ii) Compare the population variance to the mean of the sample variances.
(iii) Do the sample variances target the value of the population variance? In general, do variances make good estimators of population variances? Why or why not?
Unlock Deck
Unlock for access to all 226 flashcards in this deck.
Unlock Deck
k this deck
28
A normal quartile plot is given below for the lifetimes (in hours) of a sample of batteries of a particular brand. Use the plot to assess the normality of the lifetimes of these batteries. Explain your reasoning.
Unlock Deck
Unlock for access to all 226 flashcards in this deck.
Unlock Deck
k this deck
29
Suppose you are asked to find the 20th percentile and the 80th percentile for a set of scores.
These two problems are solved almost exactly the same. Draw the diagram for each and discuss the part of the solution that would be different in finding the requested probabilities.
These two problems are solved almost exactly the same. Draw the diagram for each and discuss the part of the solution that would be different in finding the requested probabilities.
Unlock Deck
Unlock for access to all 226 flashcards in this deck.
Unlock Deck
k this deck
30
Construct a normal quartile plot of the given data. Use your plot to determine whether the data come from a normally distributed population.
-The weekly incomes (in dollars) of a sample of 12 nurses working at a Los Angeles hospital
are given below.
-The weekly incomes (in dollars) of a sample of 12 nurses working at a Los Angeles hospital
are given below.
Unlock Deck
Unlock for access to all 226 flashcards in this deck.
Unlock Deck
k this deck
31
According to data from the American Medical Association, 10% of us are left-handed.
Suppose groups of 500 people are randomly selected. Find the probability that at least 80 are left-handed. Describe the characteristics of this problem which help you to recognize that the problem is about a binomial distribution which you are to solve by estimating with the normal distribution. (Assume that you would not use a computer, a table, or the binomial probability formula.)
Suppose groups of 500 people are randomly selected. Find the probability that at least 80 are left-handed. Describe the characteristics of this problem which help you to recognize that the problem is about a binomial distribution which you are to solve by estimating with the normal distribution. (Assume that you would not use a computer, a table, or the binomial probability formula.)
Unlock Deck
Unlock for access to all 226 flashcards in this deck.
Unlock Deck
k this deck
32
Explain how a nonstandard normal distribution differs from the standard normal distribution. Describe the process for finding probabilities for nonstandard normal distributions.
Unlock Deck
Unlock for access to all 226 flashcards in this deck.
Unlock Deck
k this deck
33
SAT verbal scores are normally distributed with a mean of 430 and a standard deviation of 120 (based on data from the College Board ATP). (a) If a single student is randomly selected, find the probability that the sample mean is above 500. (b) If a sample of 35 students are selected randomly, find the probability that the sample mean is above 500.
These two problems appear to be very similar. Which problem requires the application of the central limit theorem, and in what way does the solution process differ between the two problems?
These two problems appear to be very similar. Which problem requires the application of the central limit theorem, and in what way does the solution process differ between the two problems?
Unlock Deck
Unlock for access to all 226 flashcards in this deck.
Unlock Deck
k this deck
34
The number of books sold over the course of the four-day book fair were 134, 178, 268, and 58. Assume that samples of size 2 are randomly selected with replacement from this population of four values. List the different possible samples, and find the mean of each of them.
Unlock Deck
Unlock for access to all 226 flashcards in this deck.
Unlock Deck
k this deck
35
The ages (in years) of the four U.S. vice presidents who assumed office after presidential assassinations are 56 (A. Johnson), 51 (C. Arthur), 42 (T. Roosevelt), and 55 (L.B. Johnson).
(i) Assuming that 2 of the ages are randomly selected with replacement, list the 16 different possible samples.
(ii) Find the standard deviation of each of the 16 samples, then summarize the sampling distribution of the standard deviation in the format of a table representing the probability distribution.
(iii) Compare the population standard deviation to the mean of the sample standard deviations.
(iv) Do the sample standard deviations target the value of the population standard deviation? In general, do sample standard deviations make good estimators of population standard deviations? Why or why not?
Unlock Deck
Unlock for access to all 226 flashcards in this deck.
Unlock Deck
k this deck
36
A poll of 1900 randomly selected students in grades 6 through 8 was conducted and found that 37% enjoy playing sports. Would confidence in the results increase if the sample size were 3500 instead of 1900? Why or why not?
Unlock Deck
Unlock for access to all 226 flashcards in this deck.
Unlock Deck
k this deck
37
Explain why a continuity correction factor is necessary when approximating the binomial distribution by the normal distribution. Refer to the terms "discrete" and continuous", and draw a diagram to support your answer.
Unlock Deck
Unlock for access to all 226 flashcards in this deck.
Unlock Deck
k this deck
38
The ages (in years) of the four U.S. vice presidents who assumed office after presidential assassinations are 56 (A. Johnson), 51 (C. Arthur), 42 (T. Roosevelt), and 55 (L.B. Johnson).
(i) Assuming that 2 of the ages are randomly selected with replacement, list the 16 different possible samples.
(ii) Find the variance of each of the 16 samples, then summarize the sampling distribution of the variances in the format of a table representing the probability distribution.
(iii) Compare the population variance to the mean of the sample variances.
(iv) Do the sample variances target the value of the population variance? In general, do sample variances make good estimators of population variances? Why or why not?
Unlock Deck
Unlock for access to all 226 flashcards in this deck.
Unlock Deck
k this deck
39
Personal phone calls received in the last three days by a new employee were 2, 6, and 3. Assume that samples of size 2 are randomly selected with replacement from this population of three values. Identify the probability of each sample, and describe the sampling distribution of the sample means.
Unlock Deck
Unlock for access to all 226 flashcards in this deck.
Unlock Deck
k this deck
40
Examine the given data set and determine whether the requirement of a normal distribution is satisfied. Assume that the requirement for a normal distribution is loose in the sense that the population distribution need not be exactly normal, but it must have a distribution which is basically symmetric with only one mode. Explain why you do or do not think that the requirement is satisfied.
-The data below represents the amount of television watched per week (in hours) for 40 randomly selected teenagers.
-The data below represents the amount of television watched per week (in hours) for 40 randomly selected teenagers.
Unlock Deck
Unlock for access to all 226 flashcards in this deck.
Unlock Deck
k this deck
41
How does the standard normal distribution differ from a nonstandard normal distribution?
Unlock Deck
Unlock for access to all 226 flashcards in this deck.
Unlock Deck
k this deck
42
A poll of 1500 randomly selected students in grades 6 through 8 was conducted and found that 51% enjoy playing sports. Is the 51% result a statistic or a parameter? Explain.
Unlock Deck
Unlock for access to all 226 flashcards in this deck.
Unlock Deck
k this deck
43
A poll of 1600 randomly selected students in grades 6 through 8 was conducted and found that 45% enjoy playing sports. What is the sampling distribution suggested by the given data?
Unlock Deck
Unlock for access to all 226 flashcards in this deck.
Unlock Deck
k this deck
44
When sampling without replacement from a finite population of size N, the following formula is used to find the standard deviation of the population of sample means: However, when the sample size n, is smaller than 5% of the population size, N, the finite population correction factor, , can be omitted. Explain in your own words why this is reasonable. For nd the values of the finite population correction factor when the sample size is 10%, 5%, 3%, 1% of the population, respectively. What do you notice?
Unlock Deck
Unlock for access to all 226 flashcards in this deck.
Unlock Deck
k this deck
45
Describe the process for finding probabilities using z scores and the standard normal distribution. Give an example to support your description.
Unlock Deck
Unlock for access to all 226 flashcards in this deck.
Unlock Deck
k this deck
46
Describe the process for finding x values given probabilities.
Unlock Deck
Unlock for access to all 226 flashcards in this deck.
Unlock Deck
k this deck
47
Define a standard normal distribution by identifying its shape and the numeric values for its mean and standard deviation. Mark the mean and the standard deviations on the curve. What do z scores measure? Relate the concept of z scores to the Empirical Rule.
Unlock Deck
Unlock for access to all 226 flashcards in this deck.
Unlock Deck
k this deck
48
Replacement times for T.V. sets are normally distributed with a mean of 8.2 years and a standard deviation of 1.1 years (based on data from "Getting Things Fixed," Consumers Reports).
(a) Find the probability that a randomly selected T.V. will have a replacement time between 6.5 and 9.5 years.
(b) Find the probability that a randomly selected T.V. willhave a replacement time between 9.5 and 10.5 years. Draw the diagram for each and discuss the part of the solution that would be different in finding the requested probabilities.
Unlock Deck
Unlock for access to all 226 flashcards in this deck.
Unlock Deck
k this deck
49
Three randomly selected households are surveyed as a pilot project for a larger survey to be conducted later. The numbers of people in the households are 2, 3, and 10. Consider the values of 2, 3, and 10 to be a population. Assume that samples of size n = 2 are randomly selected with replacement from the population of 2, 3, and 10. The nine different samples are as follows: (2, 2), (2, 3), (2, 10), (3, 2), (3, 3), (3, 10), (10, 2), (10, 3), and (10, 10).
(i) Find the standard deviation of each of the nine samples, then summarize the sampling distribution of the standard deviations in the format of a table representing the probability
distribution.
(ii) Compare the population standard deviation to the mean of the sample standard deviations.
(iii) Do the sample standard deviations target the value of the population standard deviation? In general, do standard deviations make good estimators of population standard deviation? Why or why not?
Unlock Deck
Unlock for access to all 226 flashcards in this deck.
Unlock Deck
k this deck
50
State the central limit theorem. Describe the sampling distribution for a population that is uniform and for a population that is normal.
Unlock Deck
Unlock for access to all 226 flashcards in this deck.
Unlock Deck
k this deck
51
SAT verbal scores are normally distributed with a mean of 430 and a standard deviation of 120 (based on the data from the College Board ATP). If a sample of 15 students is selected randomly, find the probability that the sample mean is above 500. Does the central limit theorem apply for this problem?
Unlock Deck
Unlock for access to all 226 flashcards in this deck.
Unlock Deck
k this deck
52
Flood insurance policies sold in the last three days by a new agent were 2, 5, and 7. Assume that samples of size 2 are randomly selected with replacement from this population of three values. List the different possible samples, and find the mean of each of them.
Unlock Deck
Unlock for access to all 226 flashcards in this deck.
Unlock Deck
k this deck
53
Unlock Deck
Unlock for access to all 226 flashcards in this deck.
Unlock Deck
k this deck
54
Complete the following table for a distribution in which It might be helpful to make a diagram to help you determine the continuity factor for each entry.
Unlock Deck
Unlock for access to all 226 flashcards in this deck.
Unlock Deck
k this deck
55
Examine the given data set and determine whether the requirement of a normal distribution is satisfied. Assume that the requirement for a normal distribution is loose in the sense that the population distribution need not be exactly normal, but it must have a distribution which is basically symmetric with only one mode. Explain why you do or do not think that the requirement is satisfied.
-The numbers obtained on 50 rolls of a die.
-The numbers obtained on 50 rolls of a die.
Unlock Deck
Unlock for access to all 226 flashcards in this deck.
Unlock Deck
k this deck
56
A normal quartile plot is given below for a sample of scores on an aptitude test. Use the plot to assess the normality of scores on this test. Explain your reasoning.
Unlock Deck
Unlock for access to all 226 flashcards in this deck.
Unlock Deck
k this deck
57
A recent survey based on a random sample of n = 480 voters, predicted that the independent candidate for the mayoral election will get 23% of the vote, but he actually gets 28%. Can it be concluded that the survey was done incorrectly?
Unlock Deck
Unlock for access to all 226 flashcards in this deck.
Unlock Deck
k this deck
58
After constructing a new manufacturing machine, 5 prototype integrated circuit chips are produced and it is found that 1 is defective (D) and 4 are acceptable (A). Assume that two of the chips are randomly selected with replacement from this population.
(i) After identifying the 25 different possible samples, find the proportion of circuits that are acceptable in each of them, then use a table to describe the sampling distribution of the proportions of circuits that are acceptable.
(ii) Find the mean of the sampling distribution.
(iii) Is the mean of the sampling distribution equal to the population proportion of circuits that are acceptable?
(iv) Does the mean of the sampling distribution of proportions always
equal the population proportion?
Unlock Deck
Unlock for access to all 226 flashcards in this deck.
Unlock Deck
k this deck
59
Under what conditions can we apply the results of the central limit theorem?
Unlock Deck
Unlock for access to all 226 flashcards in this deck.
Unlock Deck
k this deck
60
Three randomly selected households are surveyed as a pilot project for a larger survey to be conducted later. The numbers of people in the households are 3, 6, and 7. Consider the values of 3, 6, and 7 to be a population. Assume that samples of size n = 2 are randomly selected with replacement from the population of 3, 6, and 7. The nine different samples are as follows:
(3, 3), (3, 6), (3, 7), (6, 3), (6, 6), (6, 7), (7, 3), (7, 6), and (7, 7).
(i) Construct a probability distribution table that describes the sampling distribution of the proportion of even numbers when samples of size n = 2 are randomly selected.
(ii) Does the mean of the sample proportions target the value of the population proportion?
(iii) Does the sample proportion make a good estimator of the population proportion?
Unlock Deck
Unlock for access to all 226 flashcards in this deck.
Unlock Deck
k this deck
61
A bank's loan officer rates applicants for credit. The ratings are normally distributed with a mean of 200 and a standard deviation of 50. Find P60, the score which separates the lower 60% from the top
40%)
A) 207.8
B) 211.3
C) 212.5
D) 187.5
40%)
A) 207.8
B) 211.3
C) 212.5
D) 187.5
Unlock Deck
Unlock for access to all 226 flashcards in this deck.
Unlock Deck
k this deck
62
A study of the amount of time it takes a mechanic to rebuild the transmission for a 2005 Chevrolet Cavalier shows that the mean is 8.4 hours and the standard deviation is 1.8 hours. If 40 mechanics are randomly selected, find the probability that their mean rebuild time is less than 8.9 hours.
A) 0.4276
B) 0.9589
C) 0.9608
D) 0.9756
A) 0.4276
B) 0.9589
C) 0.9608
D) 0.9756
Unlock Deck
Unlock for access to all 226 flashcards in this deck.
Unlock Deck
k this deck
63
Construct a normal quartile plot of the given data. Use your plot to determine whether the data come from a normally distributed population.
-The systolic blood pressure (in mmHg) is given below for a sample of 12 men aged between 60 and 65.
-The systolic blood pressure (in mmHg) is given below for a sample of 12 men aged between 60 and 65.
Unlock Deck
Unlock for access to all 226 flashcards in this deck.
Unlock Deck
k this deck
64
The Precision Scientific Instrument Company manufactures thermometers that are supposed to give readings of 0°C at the freezing point of water. Tests on a large sample of these thermometers reveal that at the freezing point of water, some give readings below 0°C (denoted by negative numbers) and some give readings above 0°C (denoted by positive numbers). Assume that the mean reading is 0°C and the standard deviation of the readings is 1.00°C. Also assume that the frequency distribution of errors closely resembles the normal distribution. A thermometer is randomly selected and tested. Find the temperature reading corresponding to the given information.
-Find P40, the 40th percentile.
A)
B)
C)
D)
-Find P40, the 40th percentile.
A)
B)
C)
D)
Unlock Deck
Unlock for access to all 226 flashcards in this deck.
Unlock Deck
k this deck
65
In one region, the September energy consumption levels for single-family homes are found to be normally distributed with a mean of 1050 kWh and a standard deviation of 218 kWh. If 50 different homes are randomly selected, find the probability that their mean energy consumption level for September is greater than 1075 kWh.
A) 0.2910
B) 0.4562
C) 0.0438
D) 0.2090
A) 0.2910
B) 0.4562
C) 0.0438
D) 0.2090
Unlock Deck
Unlock for access to all 226 flashcards in this deck.
Unlock Deck
k this deck
66
Under what conditions are you allowed to use the normal distribution to approximate the binomial distribution? Under what conditions might you want to use the normal distribution to approximate the binomial as opposed to using the binomial probability formula, a table of binomial probabilities, or a computer?
Unlock Deck
Unlock for access to all 226 flashcards in this deck.
Unlock Deck
k this deck
67
Use the normal distribution to approximate the desired probability.
-A coin is tossed 20 times. A person, who claims to have extrasensory perception, is asked to predict the outcome of each flip in advance. She predicts correctly on 11 tosses. What is the probability of being correct 11 or more times by guessing? Does this probability seem to verify her claim?
A) 0.0871, yes
B) 0.4129, no
C) 0.4129, yes
D) 0.0871, no
Unlock Deck
Unlock for access to all 226 flashcards in this deck.
Unlock Deck
k this deck
68
Assume that z scores are normally distributed with a mean of 0 and a standard deviation of 1. If P(z > c) = 0.1093, find c.
A) 0.27
B) 1.23
C) -1.23
D) 0.4562
A) 0.27
B) 1.23
C) -1.23
D) 0.4562
Unlock Deck
Unlock for access to all 226 flashcards in this deck.
Unlock Deck
k this deck
69
Assume that adults have IQ scores that are normally distributed with a mean of 100 and a standard deviation of 15 (as on the Wechsler test). Find the probability that a randomly selected adult has an IQ between 90 and 120 (somewhere in the range of normal to bright normal).
A) 0.6014
B) 0.6568
C) 0.6977
D) 0.6227
A) 0.6014
B) 0.6568
C) 0.6977
D) 0.6227
Unlock Deck
Unlock for access to all 226 flashcards in this deck.
Unlock Deck
k this deck
70
Suppose that replacement times for washing machines are normally distributed with a mean of 9.3 years and a standard deviation of 1.1 years. Find the probability that 70 randomly selected washing machines will have a mean replacement time less than 9.1 years.
A) 0.4357
B) 0.0714
C) 0.0643
D) 0.4286
A) 0.4357
B) 0.0714
C) 0.0643
D) 0.4286
Unlock Deck
Unlock for access to all 226 flashcards in this deck.
Unlock Deck
k this deck
71
Human body temperatures are normally distributed with a mean of 98.20°F and a standard deviation of 0.62°F. Find the temperature that separates the top 7% from the bottom 93%. Round to the nearest hundredth of a degree.
A) 97.28°F
B) 99.12°F
C) 98.40°F
D) 98.78°F
A) 97.28°F
B) 99.12°F
C) 98.40°F
D) 98.78°F
Unlock Deck
Unlock for access to all 226 flashcards in this deck.
Unlock Deck
k this deck
72
Find the indicated z score. The graph depicts the standard normal distribution with mean 0 and standard deviation 1.
Shaded area is 0.8599.
A) 0.8051
B) 1.08
C) -1.08
D) 0.5557
Shaded area is 0.8599.
A) 0.8051
B) 1.08
C) -1.08
D) 0.5557
Unlock Deck
Unlock for access to all 226 flashcards in this deck.
Unlock Deck
k this deck
73
Sketch a brief diagram of the standard normal distribution table. You only need to show two sets of values. Identify the z scores and the area scores in the table by circling the scores and writing z score and area by each one. Describe how to find the area corresponding to a given z score. Describe how to find the the z score corresponding to a given area value.
Unlock Deck
Unlock for access to all 226 flashcards in this deck.
Unlock Deck
k this deck
74
The volumes of soda in quart soda bottles are normally distributed with a mean of 32.3 oz and a standard deviation of 1.2 oz. What is the probability that the volume of soda in a randomly selected bottle will be less than 32 oz?
A) 0.0987
B) 0.3821
C) 0.4013
D) 0.5987
A) 0.0987
B) 0.3821
C) 0.4013
D) 0.5987
Unlock Deck
Unlock for access to all 226 flashcards in this deck.
Unlock Deck
k this deck
75
Find the indicated IQ score. The graph depicts IQ scores of adults, and those scores are normally distributed with a mean of 100 and a standard deviation of 15 (as on the Wechsler test). The shaded area under the curve is 0.10.
A) 108.1
B) 100.5
C) 80.8
D) 119.2
The shaded area under the curve is 0.10.A) 108.1
B) 100.5
C) 80.8
D) 119.2
Unlock Deck
Unlock for access to all 226 flashcards in this deck.
Unlock Deck
k this deck
76
The ages (in years) of the four U.S. vice presidents who assumed office after presidential assassinations are 56 (A. Johnson), 51 (C. Arthur), 42 (T. Roosevelt), and 55 (L.B. Johnson).
(i) Assuming that 2 of the ages are randomly selected with replacement, list the 16 different possible samples.
(ii) Find the median of each of the 16 samples, then summarize the sampling distribution of the medians in the format of a table representing the probability distribution.
(iii) Compare the population median to the mean of the sample medians.
(iv) Do the sample medians target the value of the population median? In general, do sample medians make good estimators of population medians? Why or why not?
Unlock Deck
Unlock for access to all 226 flashcards in this deck.
Unlock Deck
k this deck
77
A normal quartile plot is given below for a sample of scores on an aptitude test. Use the plot to assess the normality of scores on this test. Explain your reasoning.
Unlock Deck
Unlock for access to all 226 flashcards in this deck.
Unlock Deck
k this deck
78
In one region, the September energy consumption levels for single-family homes are found to be normally distributed with a mean of 1050 kWh and a standard deviation of 218 kWh. For a randomly selected home, find the probability that the September energy consumption level is between 1100 kWh and 1225 kWh.
A) 0.0910
B) 0.2881
C) 0.3791
D) 0.1971
A) 0.0910
B) 0.2881
C) 0.3791
D) 0.1971
Unlock Deck
Unlock for access to all 226 flashcards in this deck.
Unlock Deck
k this deck
79
The given values are discrete. Use the continuity correction and describe the region of the normal distribution that corresponds to the indicated probability.
-The probability of more than 56 correct answers
A) The area to the right of 55.5
B) The area to the right of 56
C) The area to the left of 56.5
D) The area to the right of 56.5
-The probability of more than 56 correct answers
A) The area to the right of 55.5
B) The area to the right of 56
C) The area to the left of 56.5
D) The area to the right of 56.5
Unlock Deck
Unlock for access to all 226 flashcards in this deck.
Unlock Deck
k this deck
80
Three randomly selected households are surveyed as a pilot project for a larger survey to be conducted later. The numbers of people in the households are 5, 6, and 10. Consider the values of 5, 6, and 10 to be a population. Assume that samples of size n = 2 are randomly selected with replacement from the population of 5, 6, and 10. The nine different samples are as follows:
(5, 5), (5, 6), (5, 10), (6, 5), (6, 6), (6, 10), (10, 5), (10, 6), and (10, 10).
(i) Find the variance of each of the nine samples, then summarize the sampling distribution of the variances in the format of a table representing the probability distribution.
(ii) Compare the population variance to the mean of the sample variances.
(iii) Do the sample variances target the value of the population variance? In general, do variances make good estimators of population variances? Why or why not?
Unlock Deck
Unlock for access to all 226 flashcards in this deck.
Unlock Deck
k this deck
Unlock Deck
Unlock for access to all 226 flashcards in this deck.


