Exam 6: Normal Probability Distributions
Exam 1: Introduction to Statistics106 Questions
Exam 2: Summarizing and Graphing Data85 Questions
Exam 3: Statistics for Describing, Exploring, and Comparing Data187 Questions
Exam 4: Probability186 Questions
Exam 5: Discrete Probability Distributions155 Questions
Exam 6: Normal Probability Distributions227 Questions
Exam 7: Estimates and Sample Size141 Questions
Exam 8: Hypothesis Testing139 Questions
Exam 9: Inferences From Two Samples133 Questions
Exam 10: Correlation and Regression104 Questions
Exam 11: Chi-Square and Analysis of Variance65 Questions
Select questions type
The distribution of certain test scores is a nonstandard normal distribution with a mean of 60 and a standard deviation of 4. What are the values of the mean and standard deviation after all test scores have been standardized by converting them to z scores using ?
Free
(Multiple Choice)
4.7/5  (45)
(45)
Correct Answer: Verified
C
A poll of 1500 randomly selected students in grades 6 through 8 was conducted and found that 51% enjoy playing sports. Is the 51% result a statistic or a parameter? Explain.
Free
(Essay)
4.9/5 (41)
Correct Answer:Verified
Statistic, because it is calculated from a sample, not a population.
If z is a standard normal variable, find the probability.
-The probability that z lies between 0 and 3.01
Free
(Multiple Choice)
4.7/5 (35)
Correct Answer:Verified
D
Find the indicated z score. The graph depicts the standard normal distribution with mean 0 and standard deviation 1.
-Shaded area is 0.0401. 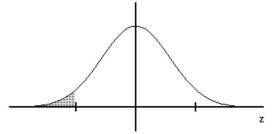
(Multiple Choice)
4.7/5 (38)
If selecting samples of size n from a population with a known mean and standard deviation, what requirement, if any, must be satisfied in order to assume that the distribution of the sample means is a normal distribution?
(Multiple Choice)
4.8/5 (35)
Assume that X has a normal distribution, and find the indicated probability.
-The mean is and the standard deviation is . Find the probability that is greater than .
(Multiple Choice)
4.9/5 (35)
Assume that women's heights are normally distributed with a mean of 63.6 inches and a standard deviation of 2.5 inches. If 90 women are randomly selected, find the probability that they have a mean height between 62.9 inches and 64.0 inches.
(Multiple Choice)
4.7/5 (37)
Assume that z scores are normally distributed with a mean of 0 and a standard deviation of 1. If P(z > c) = 0.1093, find c.
(Multiple Choice)
4.9/5 (30)
A bank's loan officer rates applicants for credit. The ratings are normally distributed with a mean of 200 and a standard deviation of 50. If an applicant is randomly selected, find the probability of a rating that is between 170 and 220.
(Multiple Choice)
5.0/5 (33)
Construct a normal quartile plot of the given data. Use your plot to determine whether the data come from a normally distributed population.
-The systolic blood pressure (in mmHg) is given below for a sample of 12 men aged between 60 and 65.
127 135 118 164 143 130 125 153 120 173 140 180
(Essay)
4.8/5 (31)
Samples of size n = 900 are randomly selected from the population of numbers (0 through 9) produced by a random-number generator, and the proportion of even numbers is found for each sample. What is the distribution of the sample proportions?
(Multiple Choice)
4.8/5 (31)
How does the standard normal distribution differ from a nonstandard normal distribution?
(Essay)
4.8/5 (32)
Estimate the indicated probability by using the normal distribution as an approximation to the binomial distribution.
-A product is manufactured in batches of 120 and the overall rate of defects is 5%. Estimate the probability that a randomly selected batch contains more than 6 defects.
(Multiple Choice)
4.9/5 (38)
Assume that adults have IQ scores that are normally distributed with a mean of 100 and a standard deviation of 15 (as on the Wechsler test). Find the probability that a randomly selected adult has an IQ between 90 and 120 (somewhere in the range of normal to bright normal).
(Multiple Choice)
4.9/5 (36)
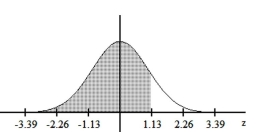
Find the area of the shaded region. The graph depicts the standard normal distribution with mean 0 and standard deviation 1.
-
(Multiple Choice)
4.8/5 (32)
Find the indicated IQ score. The graph depicts IQ scores of adults, and those scores are normally distributed with a mean of 100 and a standard deviation of 15 (as on the Wechsler test). 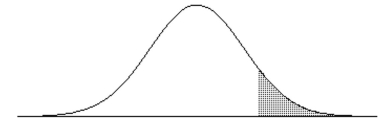 The shaded area under the curve is 0.10.
(Multiple Choice)
4.9/5 (35)
Find the indicated z score. The graph depicts the standard normal distribution with mean 0 and standard deviation 1.
-Shaded area is 0.0901. 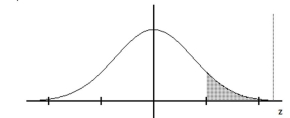
(Multiple Choice)
5.0/5 (32)
Estimate the indicated probability by using the normal distribution as an approximation to the binomial distribution.
-Estimate the probability of getting exactly 43 boys in 90 births.
(Multiple Choice)
4.7/5 (32)
In a population of 210 women, the heights of the women are normally distributed with a mean of inches and a standard deviation of inches. If 49 women are selected at random, find the mean and standard deviation of the population of sample means. Assume that the sampling is done without replacement and use a finite population correction factor.
(Multiple Choice)
4.9/5 (29)
Filters
- Essay(0)
- Multiple Choice(0)
- Short Answer(0)
- True False(0)
- Matching(0)