Deck 6: Normal Probability Distributions
Full screen (f)
Question
Question
Question
Question
Question
Question
Question
Question
Question
Provide an appropriate response.
Consider the uniform distribution shown below. Find the probability that x is greater than 6. Discuss the relationship between area under a density curve and probability.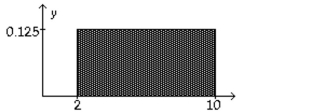
Consider the uniform distribution shown below. Find the probability that x is greater than 6. Discuss the relationship between area under a density curve and probability.
Question
Question
Question
Question
Question
Question
Question
Question
Question
Question
Question
Question
Provide an appropriate response.
Complete the following table for a distribution in which It might be helpful to make a diagram to help you determine the continuity factor for each entry.
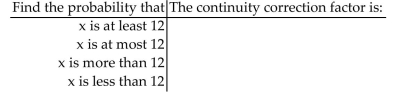
Complete the following table for a distribution in which
It might be helpful to make a diagram to help you determine the continuity factor for each entry. Question
Question
Using the following uniform density curve, answer the question. 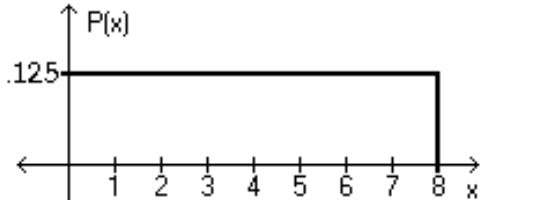
-What is the probability that the random variable has a value less than 6?
A)0.750
B)0.875
C)0.625
D)0.500
-What is the probability that the random variable has a value less than 6?
A)0.750
B)0.875
C)0.625
D)0.500
Question
Question
Question
Using the following uniform density curve, answer the question.
-What is the probability that the random variable has a value greater than 5.3?
A)0.2125
B)0.4625
C)0.2875
D)0.3375
-What is the probability that the random variable has a value greater than 5.3?
A)0.2125
B)0.4625
C)0.2875
D)0.3375
Question
Question
Question
Question
Using the following uniform density curve, answer the question.
-What is the probability that the random variable has a value greater than 3?
A)0.575
B)0.500
C)0.625
D)0.750
-What is the probability that the random variable has a value greater than 3?
A)0.575
B)0.500
C)0.625
D)0.750
Question
Question
Question
Using the following uniform density curve, answer the question.
-What is the probability that the random variable has a value less than 2.1?
A)0.1375
B)0.0125
C)0.2625
D)0.3875
-What is the probability that the random variable has a value less than 2.1?
A)0.1375
B)0.0125
C)0.2625
D)0.3875
Question
Question
Question
Question
Question
Question
Question
Using the following uniform density curve, answer the question.
-What is the probability that the random variable has a value between 0.7 and 0.8?
A)0.013
B)0.263
C)0.138
D)0.113
-What is the probability that the random variable has a value between 0.7 and 0.8?
A)0.013
B)0.263
C)0.138
D)0.113
Question
Question
Question
Question
Question
Question
Question
Question
Question
Question
Question
Question
Question
Question
Question
Question
Question
Question
Question
Question
Question
Question
Question
Question
Question
Question
Question
Question
Question
Question
Question
Question
Question
Question
Question
Question
Question
Question
Question
Question

Unlock Deck
Sign up to unlock the cards in this deck!
Unlock Deck
Unlock Deck
1/173
Play
Full screen (f)
Deck 6: Normal Probability Distributions
1
Provide an appropriate response.
-Describe the difference between z scores and area scores. Show each score's relationship to the graph of the standard normal distribution and discuss the possible sign values for each score.
-Describe the difference between z scores and area scores. Show each score's relationship to the graph of the standard normal distribution and discuss the possible sign values for each score.
z scores measure the number of SD above or below the mean, and thus they can be either positive or negative. Area scores refer to the area under the curve between the mean and the corresponding z score.
Area scores are always positive.
Area scores are always positive.
2
Provide an appropriate response.
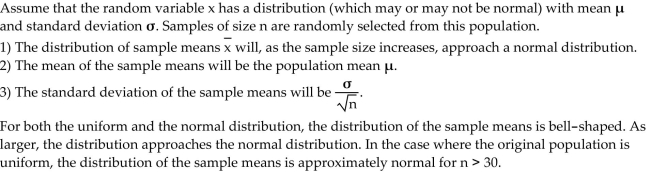
State the Central Limit theorem. Describe the sampling distribution for a population that is uniform and for a population that is normal.
State the Central Limit theorem. Describe the sampling distribution for a population that is uniform and for a population that is normal.
 s
s 3
Provide an appropriate response.
-Sketch a brief diagram of the standard normal distribution table. You only need to show two sets of values. Identify the z scores and the area scores in the table by circling the scores and writing z score and area by each one. Describe how to find the area corresponding to a given z score. Describe how to find the the z score corresponding to a given area value.
-Sketch a brief diagram of the standard normal distribution table. You only need to show two sets of values. Identify the z scores and the area scores in the table by circling the scores and writing z score and area by each one. Describe how to find the area corresponding to a given z score. Describe how to find the the z score corresponding to a given area value.
A quick sketch of a couple of values should be given. The z scores are on the left column and upper row.
The area scores are in the body of the table. If you know the z score, you find the value of the tenths place in the left column and to the hundredths in the top row. Then you find the area corresponding to those two values. Given an area, you find the closest value to it in the body of the table. Then you find the
corresponding z score from the corresponding left column and top row values.
4
Provide an appropriate response.
-Replacement times for T.V. sets are normally distributed with a mean of 8.2 years and a standard deviation of 1.1 years (based on data from "Getting Things Fixed," Consumers Reports). (a)Find the probability that a randomly selected T.V. will have a replacement time between 6.5 and 9.5 years. (b)Find the probability that a randomly selected T.V. will have a replacement time between 9.5 and 10.5 years. These two problems are solved almost exactly the same. Draw the diagram for each and discuss the part of the solution that would be different in finding the requested probabilities.
-Replacement times for T.V. sets are normally distributed with a mean of 8.2 years and a standard deviation of 1.1 years (based on data from "Getting Things Fixed," Consumers Reports). (a)Find the probability that a randomly selected T.V. will have a replacement time between 6.5 and 9.5 years. (b)Find the probability that a randomly selected T.V. will have a replacement time between 9.5 and 10.5 years. These two problems are solved almost exactly the same. Draw the diagram for each and discuss the part of the solution that would be different in finding the requested probabilities.
Unlock Deck
Unlock for access to all 173 flashcards in this deck.
Unlock Deck
k this deck
5
Provide an appropriate response.
Describe the process for finding x values given probabilities.
Describe the process for finding x values given probabilities.
Unlock Deck
Unlock for access to all 173 flashcards in this deck.
Unlock Deck
k this deck
6
Provide an appropriate response.
-Suppose you are asked to find the 20th percentile and the 80th percentile for a set of scores. These two problems are solved almost exactly the same. Draw the diagram for each and discuss the part of the solution that would be different in finding the requested probabilities.
-Suppose you are asked to find the 20th percentile and the 80th percentile for a set of scores. These two problems are solved almost exactly the same. Draw the diagram for each and discuss the part of the solution that would be different in finding the requested probabilities.
Unlock Deck
Unlock for access to all 173 flashcards in this deck.
Unlock Deck
k this deck
7
Provide an appropriate response.
-Explain how a nonstandard normal distribution differs from the standard normal distribution. Describe the process for finding probabilities for nonstandard normal distributions.
-Explain how a nonstandard normal distribution differs from the standard normal distribution. Describe the process for finding probabilities for nonstandard normal distributions.
Unlock Deck
Unlock for access to all 173 flashcards in this deck.
Unlock Deck
k this deck
8
Provide an appropriate response.
-Define a density curve and describe the two properties that it must satisfy. Show a density curve for a uniform distribution. Make sure that your graph satisfies both properties.
-Define a density curve and describe the two properties that it must satisfy. Show a density curve for a uniform distribution. Make sure that your graph satisfies both properties.
Unlock Deck
Unlock for access to all 173 flashcards in this deck.
Unlock Deck
k this deck
9
Provide an appropriate response.
Consider the uniform distribution shown below. Find the probability that x is greater than 6. Discuss the relationship between area under a density curve and probability.
Consider the uniform distribution shown below. Find the probability that x is greater than 6. Discuss the relationship between area under a density curve and probability.
Unlock Deck
Unlock for access to all 173 flashcards in this deck.
Unlock Deck
k this deck
10
Provide an appropriate response.
-Define a standard normal distribution by identifying its shape and the numeric values for its mean and standard deviation. Mark the mean and the standard deviations on the curve. What do z scores measure? Relate the concept of z scores to the Empirical Rule.
-Define a standard normal distribution by identifying its shape and the numeric values for its mean and standard deviation. Mark the mean and the standard deviations on the curve. What do z scores measure? Relate the concept of z scores to the Empirical Rule.
Unlock Deck
Unlock for access to all 173 flashcards in this deck.
Unlock Deck
k this deck
11
Provide an appropriate response.
-Under what conditions can we apply the results of the central limit theorem?
-Under what conditions can we apply the results of the central limit theorem?
Unlock Deck
Unlock for access to all 173 flashcards in this deck.
Unlock Deck
k this deck
12
Provide an appropriate response.
-SAT verbal scores are normally distributed with a mean of 430 and a standard deviation of 120 (based on the data from the College Board ATP). If a sample of 15 students is selected randomly, find the probability that the sample mean is above 500. Does the Central Limit theorem apply for this problem?
-SAT verbal scores are normally distributed with a mean of 430 and a standard deviation of 120 (based on the data from the College Board ATP). If a sample of 15 students is selected randomly, find the probability that the sample mean is above 500. Does the Central Limit theorem apply for this problem?
Unlock Deck
Unlock for access to all 173 flashcards in this deck.
Unlock Deck
k this deck
13
Provide an appropriate response.
The typical computer random-number generator yields numbers in a uniform distribution between 0 and 1 with a mean of 0.500 and a standard deviation of 0.289. (a)Suppose a sample of size 50 is randomly generated. Find the probability that the mean is below 0.300. (b)Suppose a sample size of 15 is randomly generated. Find the probability that the mean is below 0.300. These two problems appear to be very similar. Only one can be solved by the Central Limit theorem. Which one and why?
The typical computer random-number generator yields numbers in a uniform distribution between 0 and 1 with a mean of 0.500 and a standard deviation of 0.289. (a)Suppose a sample of size 50 is randomly generated. Find the probability that the mean is below 0.300. (b)Suppose a sample size of 15 is randomly generated. Find the probability that the mean is below 0.300. These two problems appear to be very similar. Only one can be solved by the Central Limit theorem. Which one and why?
Unlock Deck
Unlock for access to all 173 flashcards in this deck.
Unlock Deck
k this deck
14
Provide an appropriate response.
-Describe the process for finding probabilities using z scores and the standard normal distribution. Give an example to support your description.
-Describe the process for finding probabilities using z scores and the standard normal distribution. Give an example to support your description.
Unlock Deck
Unlock for access to all 173 flashcards in this deck.
Unlock Deck
k this deck
15
Provide an appropriate response.
-Draw a normal distribution and identify the mean of x on the distribution. Discuss the symmetry and the total area under the curve. What is the probability that a value of x will be greater than the mean?
-Draw a normal distribution and identify the mean of x on the distribution. Discuss the symmetry and the total area under the curve. What is the probability that a value of x will be greater than the mean?
Unlock Deck
Unlock for access to all 173 flashcards in this deck.
Unlock Deck
k this deck
16
Provide an appropriate response.
SAT verbal scores are normally distributed with a mean of 430 and a standard deviation of 120 (based on data from the College Board ATP). (a)If a single student is randomly selected, find the probability that the sample mean is above 500. (b)If a sample of 35 students are selected randomly, find the probability that the sample mean is above 500. These two problems appear to be very similar. Which problem requires the application of the Central Limit theorem, and in what way does the solution process differ between the two problems?
SAT verbal scores are normally distributed with a mean of 430 and a standard deviation of 120 (based on data from the College Board ATP). (a)If a single student is randomly selected, find the probability that the sample mean is above 500. (b)If a sample of 35 students are selected randomly, find the probability that the sample mean is above 500. These two problems appear to be very similar. Which problem requires the application of the Central Limit theorem, and in what way does the solution process differ between the two problems?
Unlock Deck
Unlock for access to all 173 flashcards in this deck.
Unlock Deck
k this deck
17
Provide an appropriate response.
-Describe in detail the sampling distribution of sample means. Refer specifically to the shape of the distribution.
-Describe in detail the sampling distribution of sample means. Refer specifically to the shape of the distribution.
Unlock Deck
Unlock for access to all 173 flashcards in this deck.
Unlock Deck
k this deck
18
Provide an appropriate response.
State the Empirical Rule. Use the standard normal distribution to explain the percent values given in the Empirical Rule.
State the Empirical Rule. Use the standard normal distribution to explain the percent values given in the Empirical Rule.
Unlock Deck
Unlock for access to all 173 flashcards in this deck.
Unlock Deck
k this deck
19
Provide an appropriate response.
Under what conditions are you allowed to use the normal distribution to approximate the binomial distribution? Under what conditions might you want to use the normal distribution to approximate the binomial as opposed to using the binomial probability formula, a table of binomial probabilities, or a computer?
Under what conditions are you allowed to use the normal distribution to approximate the binomial distribution? Under what conditions might you want to use the normal distribution to approximate the binomial as opposed to using the binomial probability formula, a table of binomial probabilities, or a computer?
Unlock Deck
Unlock for access to all 173 flashcards in this deck.
Unlock Deck
k this deck
20
Provide an appropriate response.
Lengths of pregnancies are normally distributed with a mean of 268 days and a standard deviation of 15 days. (a)Find the probability of a pregnancy lasting more than 250 days. (b)Find the probability of a pregnancy lasting more than 280 days. These two problems are solved almost exactly the same. Draw the diagram for each and discuss the part of the solution that would be different to finding the requested probabilities.
Lengths of pregnancies are normally distributed with a mean of 268 days and a standard deviation of 15 days. (a)Find the probability of a pregnancy lasting more than 250 days. (b)Find the probability of a pregnancy lasting more than 280 days. These two problems are solved almost exactly the same. Draw the diagram for each and discuss the part of the solution that would be different to finding the requested probabilities.
Unlock Deck
Unlock for access to all 173 flashcards in this deck.
Unlock Deck
k this deck
21
Provide an appropriate response.
Complete the following table for a distribution in which It might be helpful to make a diagram to help you determine the continuity factor for each entry.
Complete the following table for a distribution in which
It might be helpful to make a diagram to help you determine the continuity factor for each entry. Unlock Deck
Unlock for access to all 173 flashcards in this deck.
Unlock Deck
k this deck
22
If Z is a standard normal variable, find the probability
-The probability that Z lies between -2.41 and 0
A)0.4920
B)0.4910
C)0.5080
D)0.0948
-The probability that Z lies between -2.41 and 0
A)0.4920
B)0.4910
C)0.5080
D)0.0948
Unlock Deck
Unlock for access to all 173 flashcards in this deck.
Unlock Deck
k this deck
23
Using the following uniform density curve, answer the question.
-What is the probability that the random variable has a value less than 6?
A)0.750
B)0.875
C)0.625
D)0.500
-What is the probability that the random variable has a value less than 6?
A)0.750
B)0.875
C)0.625
D)0.500
Unlock Deck
Unlock for access to all 173 flashcards in this deck.
Unlock Deck
k this deck
24
If Z is a standard normal variable, find the probability
-The probability that Z lies between -0.55 and 0.55
A)-0.9000
B)-0.4176
C)0.9000
D)0.4176
-The probability that Z lies between -0.55 and 0.55
A)-0.9000
B)-0.4176
C)0.9000
D)0.4176
Unlock Deck
Unlock for access to all 173 flashcards in this deck.
Unlock Deck
k this deck
25
If Z is a standard normal variable, find the probability
-The probability that Z lies between 0 and 3.01
A)0.5013
B)0.1217
C)0.4987
D)0.9987
-The probability that Z lies between 0 and 3.01
A)0.5013
B)0.1217
C)0.4987
D)0.9987
Unlock Deck
Unlock for access to all 173 flashcards in this deck.
Unlock Deck
k this deck
26
Using the following uniform density curve, answer the question.
-What is the probability that the random variable has a value greater than 5.3?
A)0.2125
B)0.4625
C)0.2875
D)0.3375
-What is the probability that the random variable has a value greater than 5.3?
A)0.2125
B)0.4625
C)0.2875
D)0.3375
Unlock Deck
Unlock for access to all 173 flashcards in this deck.
Unlock Deck
k this deck
27
Assume that the weight loss for the first month of a diet program varies between 6 pounds and 12 pounds, and is spread evenly over the range of possibilities, so that there is a uniform distribution. Find the probability of the given range of pounds lost
-Between 7 pounds and 10 pounds
A)
B)
C)
D)
-Between 7 pounds and 10 pounds
A)
B)
C)
D)
Unlock Deck
Unlock for access to all 173 flashcards in this deck.
Unlock Deck
k this deck
28
Assume that the weight loss for the first month of a diet program varies between 6 pounds and 12 pounds, and is spread evenly over the range of possibilities, so that there is a uniform distribution. Find the probability of the given range of pounds lost
-More than 9 pounds
A)
B)
C)
D)
-More than 9 pounds
A)
B)
C)
D)
Unlock Deck
Unlock for access to all 173 flashcards in this deck.
Unlock Deck
k this deck
29
Provide an appropriate response.
-Explain why a continuity correction factor is necessary when approximating the binomial distribution by the normal distribution. Refer to the terms "discrete" and continuous", and draw a diagram to support your answer.
-Explain why a continuity correction factor is necessary when approximating the binomial distribution by the normal distribution. Refer to the terms "discrete" and continuous", and draw a diagram to support your answer.
Unlock Deck
Unlock for access to all 173 flashcards in this deck.
Unlock Deck
k this deck
30
Using the following uniform density curve, answer the question.
-What is the probability that the random variable has a value greater than 3?
A)0.575
B)0.500
C)0.625
D)0.750
-What is the probability that the random variable has a value greater than 3?
A)0.575
B)0.500
C)0.625
D)0.750
Unlock Deck
Unlock for access to all 173 flashcards in this deck.
Unlock Deck
k this deck
31
If Z is a standard normal variable, find the probability
-The probability that Z is greater than -1.82
A)0.9656
B)-0.0344
C)0.4656
D)0.0344
-The probability that Z is greater than -1.82
A)0.9656
B)-0.0344
C)0.4656
D)0.0344
Unlock Deck
Unlock for access to all 173 flashcards in this deck.
Unlock Deck
k this deck
32
If Z is a standard normal variable, find the probability
-The probability that Z is less than 1.13
A)0.8907
B)0.1292
C)0.8708
D)0.8485
-The probability that Z is less than 1.13
A)0.8907
B)0.1292
C)0.8708
D)0.8485
Unlock Deck
Unlock for access to all 173 flashcards in this deck.
Unlock Deck
k this deck
33
Using the following uniform density curve, answer the question.
-What is the probability that the random variable has a value less than 2.1?
A)0.1375
B)0.0125
C)0.2625
D)0.3875
-What is the probability that the random variable has a value less than 2.1?
A)0.1375
B)0.0125
C)0.2625
D)0.3875
Unlock Deck
Unlock for access to all 173 flashcards in this deck.
Unlock Deck
k this deck
34
Assume that the weight loss for the first month of a diet program varies between 6 pounds and 12 pounds, and is spread evenly over the range of possibilities, so that there is a uniform distribution. Find the probability of the given range of pounds lost
-Between 9.5 pounds and 11 pounds
A)
B)
C)
D)
-Between 9.5 pounds and 11 pounds
A)
B)
C)
D)
Unlock Deck
Unlock for access to all 173 flashcards in this deck.
Unlock Deck
k this deck
35
Assume that the weight loss for the first month of a diet program varies between 6 pounds and 12 pounds, and is spread evenly over the range of possibilities, so that there is a uniform distribution. Find the probability of the given range of pounds lost
-Less than 9 pounds
A)
B)
C)
D)
-Less than 9 pounds
A)
B)
C)
D)
Unlock Deck
Unlock for access to all 173 flashcards in this deck.
Unlock Deck
k this deck
36
Provide an appropriate response.
According to data from the American Medical Association, 10% of us are left-handed. Suppose groups of 500 people are randomly selected. Find the probability that at least 80 are left-handed. Describe the characteristics of this problem which help you to recognize that the problem is about a binomial distribution which you are to solve by estimating with the normal distribution. (Assume that you would not use a computer, a table, or the binomial probability formula.)
According to data from the American Medical Association, 10% of us are left-handed. Suppose groups of 500 people are randomly selected. Find the probability that at least 80 are left-handed. Describe the characteristics of this problem which help you to recognize that the problem is about a binomial distribution which you are to solve by estimating with the normal distribution. (Assume that you would not use a computer, a table, or the binomial probability formula.)
Unlock Deck
Unlock for access to all 173 flashcards in this deck.
Unlock Deck
k this deck
37
Use the given degree of confidence and sample data to find a confidence interval for the population standard deviation Ϭ.
Assume that the population has a normal distribution.
What is the probability that the random variable has a value between 4.5 and 7.7?
A)0.2750
B)0.4000
C)0.5250
D)0.6500
Assume that the population has a normal distribution.
What is the probability that the random variable has a value between 4.5 and 7.7?
A)0.2750
B)0.4000
C)0.5250
D)0.6500
Unlock Deck
Unlock for access to all 173 flashcards in this deck.
Unlock Deck
k this deck
38
If Z is a standard normal variable, find the probability
-The probability that Z lies between -1.10 and -0.36
A)-0.2237
B)0.2239
C)0.2237
D)0.4951
-The probability that Z lies between -1.10 and -0.36
A)-0.2237
B)0.2239
C)0.2237
D)0.4951
Unlock Deck
Unlock for access to all 173 flashcards in this deck.
Unlock Deck
k this deck
39
If Z is a standard normal variable, find the probability
-The probability that Z lies between 0.7 and 1.98
A)1.7341
B)0.2181
C)0.2175
D)-0.2181
-The probability that Z lies between 0.7 and 1.98
A)1.7341
B)0.2181
C)0.2175
D)-0.2181
Unlock Deck
Unlock for access to all 173 flashcards in this deck.
Unlock Deck
k this deck
40
Using the following uniform density curve, answer the question.
-What is the probability that the random variable has a value between 0.7 and 0.8?
A)0.013
B)0.263
C)0.138
D)0.113
-What is the probability that the random variable has a value between 0.7 and 0.8?
A)0.013
B)0.263
C)0.138
D)0.113
Unlock Deck
Unlock for access to all 173 flashcards in this deck.
Unlock Deck
k this deck
41
The Precision Scientific Instrument Company manufactures thermometers that are supposed to give readings of 0°C at the freezing point of water. Tests on a large sample of these thermometers reveal that at the freezing point of water, some give readings below 0°C (denoted by negative numbers) and some give readings above 0°C (denoted by positive numbers). Assume that the mean reading is 0°C and the standard deviation of the readings is 1.00°C. Also assume that the frequency distribution of errors closely resembles the normal distribution. A thermometer is randomly selected and tested. Find the temperature reading corresponding to the given information.
-A quality control analyst wants to examine thermometers that give readings in the bottom 7%. Find the reading that separates the bottom 7% from the others.
A)-1.75°
B)-1.63°
C)-1.89°
D)-1.48°
-A quality control analyst wants to examine thermometers that give readings in the bottom 7%. Find the reading that separates the bottom 7% from the others.
A)-1.75°
B)-1.63°
C)-1.89°
D)-1.48°
Unlock Deck
Unlock for access to all 173 flashcards in this deck.
Unlock Deck
k this deck
42
The Precision Scientific Instrument Company manufactures thermometers that are supposed to give readings of 0°C at the freezing point of water. Tests on a large sample of these thermometers reveal that at the freezing point of water, some give readings below 0°C (denoted by negative numbers) and some give readings above 0°C (denoted by positive numbers). Assume that the mean reading is 0°C and the standard deviation of the readings is 1.00°C. Also assume that the frequency distribution of errors closely resembles the normal distribution. A thermometer is randomly selected and tested. Find the temperature reading corresponding to the given information.
-
A)-1.3°
B)0.82°
C)0.53°
D)0.67°
-
A)-1.3°
B)0.82°
C)0.53°
D)0.67°
Unlock Deck
Unlock for access to all 173 flashcards in this deck.
Unlock Deck
k this deck
43
The Precision Scientific Instrument Company manufactures thermometers that are supposed to give readings of 0°C at the freezing point of water. Tests on a large sample of these thermometers reveal that at the freezing point of water, some give readings below 0°C (denoted by negative numbers) and some give readings above 0°C (denoted by positive numbers). Assume that the mean reading is 0°C and the standard deviation of the readings is 1.00°C. Also assume that the frequency distribution of errors closely resembles the normal distribution. A thermometer is randomly selected and tested. Find the temperature reading corresponding to the given information.
-If 6.3% of the thermometers are rejected because they have readings that are too high and another 6.3% are rejected because they have readings that are too low, find the two readings that are cutoff values separating the rejected thermometers from the others.
A)-1.39° , 1.39°
B)-1.46° , 1.46°
C)-1.45° , 1.45°
D)-1.53° , 1.53°
Unlock Deck
Unlock for access to all 173 flashcards in this deck.
Unlock Deck
k this deck
44
Solve the problem.
-Assume that scores are normally distributed with a mean of 0 and a standard deviation of 1 . If , find .
A)
B)
C)
D)
-Assume that scores are normally distributed with a mean of 0 and a standard deviation of 1 . If , find .
A)
B)
C)
D)
Unlock Deck
Unlock for access to all 173 flashcards in this deck.
Unlock Deck
k this deck
45
The Precision Scientific Instrument Company manufactures thermometers that are supposed to give readings of 0°C at the freezing point of water. Tests on a large sample of these thermometers reveal that at the freezing point of water, some give readings below 0°C (denoted by negative numbers) and some give readings above 0°C (denoted by positive numbers). Assume that the mean reading is 0°C and the standard deviation of the readings is 1.00°C. Also assume that the frequency distribution of errors closely resembles the normal distribution. A thermometer is randomly selected and tested. Find the temperature reading corresponding to the given information.
-Find P96, the 96th percentile.
A)1.03°
B)-1.38°
C)1.82°
D)1.75°
-Find P96, the 96th percentile.
A)1.03°
B)-1.38°
C)1.82°
D)1.75°
Unlock Deck
Unlock for access to all 173 flashcards in this deck.
Unlock Deck
k this deck
46
The Precision Scientific Instrument Company manufactures thermometers that are supposed to give readings of 0°C at the freezing point of water. Tests on a large sample of these thermometers reveal that at the freezing point of water, some give readings below 0°C (denoted by negative numbers) and some give readings above 0°C (denoted by positive numbers). Assume that the mean reading is 0°C and the standard deviation of the readings is 1.00°C. Also assume that the frequency distribution of errors closely resembles the normal distribution. A thermometer is randomly selected and tested. Find the temperature reading corresponding to the given information.
-If 9% of the thermometers are rejected because they have readings that are too low, but all other thermometers are acceptable, find the temperature that separates the rejected thermometers from the others.
A)-1.34°
B)-1.26°
C)-1.39°
D)-1.45°
-If 9% of the thermometers are rejected because they have readings that are too low, but all other thermometers are acceptable, find the temperature that separates the rejected thermometers from the others.
A)-1.34°
B)-1.26°
C)-1.39°
D)-1.45°
Unlock Deck
Unlock for access to all 173 flashcards in this deck.
Unlock Deck
k this deck
47
The Precision Scientific Instrument Company manufactures thermometers that are supposed to give readings of 0°C at the freezing point of water. Tests on a large sample of these thermometers reveal that at the freezing point of water, some give readings below 0°C (denoted by negative numbers) and some give readings above 0°C (denoted by positive numbers). Assume that the mean reading is 0°C and the standard deviation of the readings is 1.00°C. Also assume that the frequency distribution of errors closely resembles the normal distribution. A thermometer is randomly selected and tested. Find the temperature reading corresponding to the given information.
-A quality control analyst wants to examine thermometers that give readings in the bottom 4%. Find the reading that separates the bottom 4% from the others.
A)-1.63°
B)-1.48°
C)-1.89°
D)-1.75°
-A quality control analyst wants to examine thermometers that give readings in the bottom 4%. Find the reading that separates the bottom 4% from the others.
A)-1.63°
B)-1.48°
C)-1.89°
D)-1.75°
Unlock Deck
Unlock for access to all 173 flashcards in this deck.
Unlock Deck
k this deck
48
The Precision Scientific Instrument Company manufactures thermometers that are supposed to give readings of 0°C at the freezing point of water. Tests on a large sample of these thermometers reveal that at the freezing point of water, some give readings below 0°C (denoted by negative numbers) and some give readings above 0°C (denoted by positive numbers). Assume that the mean reading is 0°C and the standard deviation of the readings is 1.00°C. Also assume that the frequency distribution of errors closely resembles the normal distribution. A thermometer is randomly selected and tested. Find the temperature reading corresponding to the given information.
-If 9% of the thermometers are rejected because they have readings that are too high, but all other thermometers are acceptable, find the temperature that separates the rejected thermometers from the others.
A)1.34°
B)1.26°
C)1.39°
D)1.45°
-If 9% of the thermometers are rejected because they have readings that are too high, but all other thermometers are acceptable, find the temperature that separates the rejected thermometers from the others.
A)1.34°
B)1.26°
C)1.39°
D)1.45°
Unlock Deck
Unlock for access to all 173 flashcards in this deck.
Unlock Deck
k this deck
49
Solve the problem.
For a standard normal distribution, find the percentage of data that are more than 1 standard deviation away from the mean.
A)68.26%
B)15.87%
C)31.74%
D)34.13%
For a standard normal distribution, find the percentage of data that are more than 1 standard deviation away from the mean.
A)68.26%
B)15.87%
C)31.74%
D)34.13%
Unlock Deck
Unlock for access to all 173 flashcards in this deck.
Unlock Deck
k this deck
50
Solve the problem.
-Assume that scores are normally distributed with a mean of 0 and a standard deviation of 1 . If , find .
A)
B)
C)
D)
-Assume that scores are normally distributed with a mean of 0 and a standard deviation of 1 . If , find .
A)
B)
C)
D)
Unlock Deck
Unlock for access to all 173 flashcards in this deck.
Unlock Deck
k this deck
51
Solve the problem.
For a standard normal distribution, find the percentage of data that are more than 2 standard deviations below the mean or more than 3 standard deviations above the mean.
A)4.56%
B)2.41%
C)97.59%
D)0.26%
For a standard normal distribution, find the percentage of data that are more than 2 standard deviations below the mean or more than 3 standard deviations above the mean.
A)4.56%
B)2.41%
C)97.59%
D)0.26%
Unlock Deck
Unlock for access to all 173 flashcards in this deck.
Unlock Deck
k this deck
52
Solve the problem.
-Assume that scores are normally distributed with a mean of 0 and a standard deviation of 1 . If , find .
A)
B)
C)
D)
-Assume that scores are normally distributed with a mean of 0 and a standard deviation of 1 . If , find .
A)
B)
C)
D)
Unlock Deck
Unlock for access to all 173 flashcards in this deck.
Unlock Deck
k this deck
53
If Z is a standard normal variable, find the probability
-P(Z > 0.59)
A)0.2190
B)0.2224
C)0.2776
D)0.7224
-P(Z > 0.59)
A)0.2190
B)0.2224
C)0.2776
D)0.7224
Unlock Deck
Unlock for access to all 173 flashcards in this deck.
Unlock Deck
k this deck
54
The Precision Scientific Instrument Company manufactures thermometers that are supposed to give readings of 0°C at the freezing point of water. Tests on a large sample of these thermometers reveal that at the freezing point of water, some give readings below 0°C (denoted by negative numbers) and some give readings above 0°C (denoted by positive numbers). Assume that the mean reading is 0°C and the standard deviation of the readings is 1.00°C. Also assume that the frequency distribution of errors closely resembles the normal distribution. A thermometer is randomly selected and tested. Find the temperature reading corresponding to the given information.
-If 7% of the thermometers are rejected because they have readings that are too high, but all other thermometers are acceptable, find the temperature that separates the rejected thermometers from the others.
A)1.45°
B)1.26°
C)1.48°
D)1.39°
-If 7% of the thermometers are rejected because they have readings that are too high, but all other thermometers are acceptable, find the temperature that separates the rejected thermometers from the others.
A)1.45°
B)1.26°
C)1.48°
D)1.39°
Unlock Deck
Unlock for access to all 173 flashcards in this deck.
Unlock Deck
k this deck
55
The Precision Scientific Instrument Company manufactures thermometers that are supposed to give readings of 0°C at the freezing point of water. Tests on a large sample of these thermometers reveal that at the freezing point of water, some give readings below 0°C (denoted by negative numbers) and some give readings above 0°C (denoted by positive numbers). Assume that the mean reading is 0°C and the standard deviation of the readings is 1.00°C. Also assume that the frequency distribution of errors closely resembles the normal distribution. A thermometer is randomly selected and tested. Find the temperature reading corresponding to the given information.
-If 7% of the thermometers are rejected because they have readings that are too low, but all other thermometers are acceptable, find the temperature that separates the rejected thermometers from the others.
A)-1.39°
B)-1.26°
C)-1.48°
D)-1.53°
-If 7% of the thermometers are rejected because they have readings that are too low, but all other thermometers are acceptable, find the temperature that separates the rejected thermometers from the others.
A)-1.39°
B)-1.26°
C)-1.48°
D)-1.53°
Unlock Deck
Unlock for access to all 173 flashcards in this deck.
Unlock Deck
k this deck
56
If Z is a standard normal variable, find the probability
-P(Z < 0.97)
A)0.8315
B)0.8340
C)0.8078
D)0.1660
-P(Z < 0.97)
A)0.8315
B)0.8340
C)0.8078
D)0.1660
Unlock Deck
Unlock for access to all 173 flashcards in this deck.
Unlock Deck
k this deck
57
If Z is a standard normal variable, find the probability
-P(-0.73 < Z < 2.27)
A)0.4884
B)0.7557
C)1.54
D)0.2211
-P(-0.73 < Z < 2.27)
A)0.4884
B)0.7557
C)1.54
D)0.2211
Unlock Deck
Unlock for access to all 173 flashcards in this deck.
Unlock Deck
k this deck
58
The Precision Scientific Instrument Company manufactures thermometers that are supposed to give readings of 0°C at the freezing point of water. Tests on a large sample of these thermometers reveal that at the freezing point of water, some give readings below 0°C (denoted by negative numbers) and some give readings above 0°C (denoted by positive numbers). Assume that the mean reading is 0°C and the standard deviation of the readings is 1.00°C. Also assume that the frequency distribution of errors closely resembles the normal distribution. A thermometer is randomly selected and tested. Find the temperature reading corresponding to the given information.
-Find P40, the 40th percentile.
A)0.57°
B)-0.25°
C)-0.57°
D)0.25°
-Find P40, the 40th percentile.
A)0.57°
B)-0.25°
C)-0.57°
D)0.25°
Unlock Deck
Unlock for access to all 173 flashcards in this deck.
Unlock Deck
k this deck
59
Solve the problem.
-If a continuous uniform distribution has parameters of and , then the minimum is and the maximum is . For this distribution, find . Round your answer to three decimal places.
A)
B)
C)
D)
-If a continuous uniform distribution has parameters of and , then the minimum is and the maximum is . For this distribution, find . Round your answer to three decimal places.
A)
B)
C)
D)
Unlock Deck
Unlock for access to all 173 flashcards in this deck.
Unlock Deck
k this deck
60
Solve the problem.
-In a continuous uniform distribution,
Find the mean and standard deviation for a uniform distribution having a minimum of and a maximum of 6
A)
B)
C)
-In a continuous uniform distribution,
Find the mean and standard deviation for a uniform distribution having a minimum of and a maximum of 6
A)
B)
C)
Unlock Deck
Unlock for access to all 173 flashcards in this deck.
Unlock Deck
k this deck
61
Write the word or phrase that best completes each statement or answers the question
-Suppose that you wish to find for a continuous uniform distribution having a minimum of and a maximum of 3 . If you incorrectly assume that the distribution is normal instead of uniform, will your answer be too big, too small, or will you still obtain the correct answer? Explain your thinking.
-Suppose that you wish to find for a continuous uniform distribution having a minimum of and a maximum of 3 . If you incorrectly assume that the distribution is normal instead of uniform, will your answer be too big, too small, or will you still obtain the correct answer? Explain your thinking.
Unlock Deck
Unlock for access to all 173 flashcards in this deck.
Unlock Deck
k this deck
62
The incomes of trainees at a local mill are normally distributed with a mean of $1100 and a standard deviation of $150. What percentage of trainees earn less than $900 a month?
A)9.18%
B)40.82%
C)35.31%
D)90.82%
A)9.18%
B)40.82%
C)35.31%
D)90.82%
Unlock Deck
Unlock for access to all 173 flashcards in this deck.
Unlock Deck
k this deck
63
Assume that X has a normal distribution, and find the indicated probability.
-The mean is and the standard deviation is . Find the probability that is less than .
A)0.9599
B)0.0802
C)0.5589
D)0.0401
-The mean is and the standard deviation is . Find the probability that is less than .
A)0.9599
B)0.0802
C)0.5589
D)0.0401
Unlock Deck
Unlock for access to all 173 flashcards in this deck.
Unlock Deck
k this deck
64
Solve the problem.
In one region, the September energy consumption levels for single-family homes are found to be normally distributed with a mean of 1050 kWh and a standard deviation of 218 kWh. Find P45, which is the consumption level separating the bottom 45% from the top 55%.
A)1148.1
B)1021.7
C)1078.3
D)1087.8
In one region, the September energy consumption levels for single-family homes are found to be normally distributed with a mean of 1050 kWh and a standard deviation of 218 kWh. Find P45, which is the consumption level separating the bottom 45% from the top 55%.
A)1148.1
B)1021.7
C)1078.3
D)1087.8
Unlock Deck
Unlock for access to all 173 flashcards in this deck.
Unlock Deck
k this deck
65
Solve the problem.
-The serum cholesterol levels for men in one age group are normally distributed with a mean of 178.1 and a standard deviation of 40.7. All units are in mg/100 mL. Find the two levels that separate the top 9% and the bottom 9%.
A)107.3 mg/100mL and 248.9 mg/100mL
B)165.1 mg/100mL and 191.12 mg/100mL
C)123.6 mg/100mL and 232.6 mg/100mL
D)161.4 mg/100mL and 194.8 mg/100mL
Unlock Deck
Unlock for access to all 173 flashcards in this deck.
Unlock Deck
k this deck
66
Assume that X has a normal distribution, and find the indicated probability.
-The mean is and the standard deviation is . Find the probability that is greater than .
A)1.0000
B)0.0003
C)0.5000
D)0.9998
-The mean is and the standard deviation is . Find the probability that is greater than .
A)1.0000
B)0.0003
C)0.5000
D)0.9998
Unlock Deck
Unlock for access to all 173 flashcards in this deck.
Unlock Deck
k this deck
67
Solve the problem.
Human body temperatures are normally distributed with a mean of 98.20°F and a standard deviation of 0.62°F. Find the temperature that separates the top 7% from the bottom 93%.
A)98.40°F
B)97.28°F
C)99.12°F
D)98.78°F
Human body temperatures are normally distributed with a mean of 98.20°F and a standard deviation of 0.62°F. Find the temperature that separates the top 7% from the bottom 93%.
A)98.40°F
B)97.28°F
C)99.12°F
D)98.78°F
Unlock Deck
Unlock for access to all 173 flashcards in this deck.
Unlock Deck
k this deck
68
Assume that X has a normal distribution, and find the indicated probability.
-The mean is and the standard deviation is . Find the probability that is between and 140.1.
A)0.4069
B)0.6242
C)0.8138
D)1.0311
-The mean is and the standard deviation is . Find the probability that is between and 140.1.
A)0.4069
B)0.6242
C)0.8138
D)1.0311
Unlock Deck
Unlock for access to all 173 flashcards in this deck.
Unlock Deck
k this deck
69
Assume that X has a normal distribution, and find the indicated probability.
-The mean is and the standard deviation is . Find the probability that is between and 16.1.
A)0.3413
B)0.1587
C)0.8413
D)0.6826
-The mean is and the standard deviation is . Find the probability that is between and 16.1.
A)0.3413
B)0.1587
C)0.8413
D)0.6826
Unlock Deck
Unlock for access to all 173 flashcards in this deck.
Unlock Deck
k this deck
70
The diameters of bolts produced by a certain machine are normally distributed with a mean of 0.30 inches and a standard deviation of 0.01 inches. What percentage of bolts will have a diameter greater than 0.32 inches?
A)47.72%
B)97.72%
C)2.28%
D)37.45%
A)47.72%
B)97.72%
C)2.28%
D)37.45%
Unlock Deck
Unlock for access to all 173 flashcards in this deck.
Unlock Deck
k this deck
71
Solve the problem.
The weights of certain machine components are normally distributed with a mean of 8.05 g and a standard deviation of 0.09 g. Find the two weights that separate the top 3% and the bottom 3%. Theses weights could serve as limits used to identify which components should be rejected.
A)7.85 g and 8.29 g
B)7.88 g and 8.22 g
C)8.01 g and 8.09 g
D)8.03 g and 8.07 g
Unlock Deck
Unlock for access to all 173 flashcards in this deck.
Unlock Deck
k this deck
72
Solve the problem.
Scores on an English test are normally distributed with a mean of 33.8 and a standard deviation of 8.5. Find the score that separates the top 59% from the bottom 41%
A)35.8
B)38.8
C)31.8
D)28.8
Scores on an English test are normally distributed with a mean of 33.8 and a standard deviation of 8.5. Find the score that separates the top 59% from the bottom 41%
A)35.8
B)38.8
C)31.8
D)28.8
Unlock Deck
Unlock for access to all 173 flashcards in this deck.
Unlock Deck
k this deck
73
Assume that X has a normal distribution, and find the indicated probability.
-The mean is and the standard deviation is . Find the probability that is between and .
A)0.7477
B)0.4107
C)0.3370
D)1.0847
-The mean is and the standard deviation is . Find the probability that is between and .
A)0.7477
B)0.4107
C)0.3370
D)1.0847
Unlock Deck
Unlock for access to all 173 flashcards in this deck.
Unlock Deck
k this deck
74
Solve the problem.
-The amount of rainfall in January in a certain city is normally distributed with a mean of 4.6 inches and a standard deviation of 0.3 inches. Find the value of the quartile
A)4.5
B)4.8
C)4.4
D)1.2
-The amount of rainfall in January in a certain city is normally distributed with a mean of 4.6 inches and a standard deviation of 0.3 inches. Find the value of the quartile
A)4.5
B)4.8
C)4.4
D)1.2
Unlock Deck
Unlock for access to all 173 flashcards in this deck.
Unlock Deck
k this deck
75
Solve the problem.
-Scores on a test are normally distributed with a mean of and a standard deviation of . Find P81, which separates the bottom from the top .
A)68.3
B)0.291
C)74.4
D)0.88
-Scores on a test are normally distributed with a mean of and a standard deviation of . Find P81, which separates the bottom from the top .
A)68.3
B)0.291
C)74.4
D)0.88
Unlock Deck
Unlock for access to all 173 flashcards in this deck.
Unlock Deck
k this deck
76
Solve the problem.
Suppose that replacement times for washing machines are normally distributed with a mean of 9.3 years and a standard deviation of 2 years. Find the replacement time that separates the top 18% from the bottom 82%.
A)11.1 years
B)9.7 years
C)10.6 years
D)7.5 years
Suppose that replacement times for washing machines are normally distributed with a mean of 9.3 years and a standard deviation of 2 years. Find the replacement time that separates the top 18% from the bottom 82%.
A)11.1 years
B)9.7 years
C)10.6 years
D)7.5 years
Unlock Deck
Unlock for access to all 173 flashcards in this deck.
Unlock Deck
k this deck
77
Solve the problem.
-Assume that women have heights that are normally distributed with a mean of 63.6 inches and a standard deviation of 2.5 inches. Find the value of the quartile Q
A)67.8 inches
B)64.3 inches
C)66.1 inches
D)65.3 inches
-Assume that women have heights that are normally distributed with a mean of 63.6 inches and a standard deviation of 2.5 inches. Find the value of the quartile Q
A)67.8 inches
B)64.3 inches
C)66.1 inches
D)65.3 inches
Unlock Deck
Unlock for access to all 173 flashcards in this deck.
Unlock Deck
k this deck
78
Assume that X has a normal distribution, and find the indicated probability.
-The mean is and the standard deviation is . Find the probability that is greater than .
A)0.1550
B)0.8413
C)0.1357
D)0.1587
-The mean is and the standard deviation is . Find the probability that is greater than .
A)0.1550
B)0.8413
C)0.1357
D)0.1587
Unlock Deck
Unlock for access to all 173 flashcards in this deck.
Unlock Deck
k this deck
79
Solve the problem.
-A bank's loan officer rates applicants for credit. The ratings are normally distributed with a mean of 200 and a standard deviation of 50 . Find , the score which separates the lower from the top .
A)211.3
B)207.8
C)212.5
D)187.5
-A bank's loan officer rates applicants for credit. The ratings are normally distributed with a mean of 200 and a standard deviation of 50 . Find , the score which separates the lower from the top .
A)211.3
B)207.8
C)212.5
D)187.5
Unlock Deck
Unlock for access to all 173 flashcards in this deck.
Unlock Deck
k this deck
80
Assume that X has a normal distribution, and find the indicated probability.
-The mean is and the standard deviation is . Find the probability that is greater than 17.
A)0.9713
B)0.9772
C)0.0228
D)0.9821
-The mean is and the standard deviation is . Find the probability that is greater than 17.
A)0.9713
B)0.9772
C)0.0228
D)0.9821
Unlock Deck
Unlock for access to all 173 flashcards in this deck.
Unlock Deck
k this deck
Unlock Deck
Unlock for access to all 173 flashcards in this deck.


