Deck 10: Estimation and Hypothesis Testing for Two Population Parameters
Full screen (f)
Question
The Cranston Hardware Company is interested in estimating the difference in the mean purchase for men customers versus women customers. It wishes to estimate this difference using a 95 percent confidence level. Assume that the variances are equal and the populations normally distributed. The following data represent independent samples from each population: 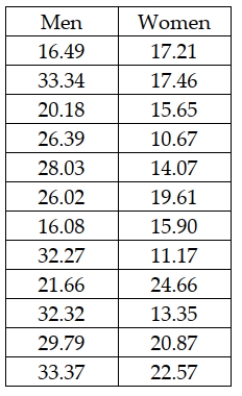 Based on these data, the company can conclude that there is a statistical difference between men and women with regard to mean spending at the hardware store with men tending to spend more on average than women.
Based on these data, the company can conclude that there is a statistical difference between men and women with regard to mean spending at the hardware store with men tending to spend more on average than women. Question
Question
Question
Question
Question
Question
The NCAA is interested in estimating the difference in mean number of daily training hours for men and women athletes on college campuses. It wants 95 percent confidence and will select a sample of 10 men and 10 women for the study. The variances are assumed equal and the populations normally distributed. The sample results are: 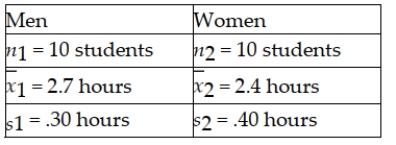 Based on these data, the lower limit for the difference between population means is 0.15 hours.
Based on these data, the lower limit for the difference between population means is 0.15 hours. Question
The NCAA is interested in estimating the difference in mean number of daily training hours for men and women athletes on college campuses. It wants 95 percent confidence and will select a sample of 10 men and 10 women for the study. The variances are assumed equal and the populations normally distributed. The sample results are: 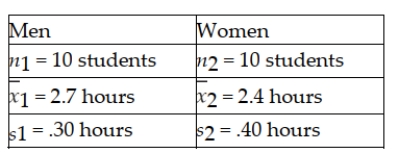 Based on these sample data, the critical value for developing the confidence interval is z = 1.96.
Based on these sample data, the critical value for developing the confidence interval is z = 1.96. Question
Question
Question
The NCAA is interested in estimating the difference in mean number of daily training hours for men and women athletes on college campuses. They want 95 percent confidence and will select a sample of 10 men and 10 women for the study. The sample results are: 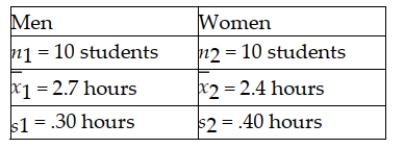 Based on these data, the point estimate is .30 hours.
Based on these data, the point estimate is .30 hours. Question
Question
Question
Question
Question
The NCAA is interested in estimating the difference in mean number of daily training hours for men and women athletes on college campuses. It wants 95 percent confidence and will select a sample of 10 men and 10 women for the study. The variances are assumed equal and the populations normally distributed. The sample results are: 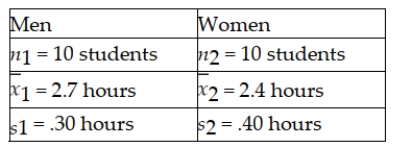 Based on these sample data, the estimate for the standard deviation of the sampling distribution is found by taking the square root of the sum of the two sample variances.
Based on these sample data, the estimate for the standard deviation of the sampling distribution is found by taking the square root of the sum of the two sample variances. Question
Question
The Cranston Hardware Company is interested in estimating the difference in the mean purchase for men customers versus women customers. It wishes to estimate this difference using a 95 percent confidence level. Assume that the variances are equal and the populations normally distributed. The following data represent independent samples from each population: 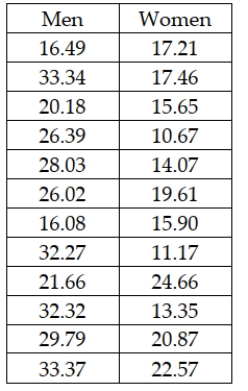 Based on these data, the upper limit of the interval estimate is approximately $13.82.
Based on these data, the upper limit of the interval estimate is approximately $13.82. Question
Question
Question
Question
There is interest at the American Savings and Loan as to whether there is a difference between average daily balances in checking accounts that are joint accounts (two or more members per account) versus single accounts (one member per account). To test this, a random sample of checking accounts was selected with the following results: 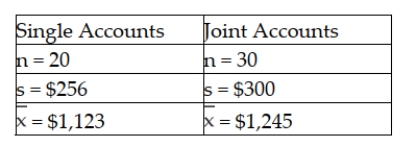 Based upon these data, the critical value from the t-distribution for testing the difference between the two population means using a significance level of 0.05 is t = 1.6772.
Based upon these data, the critical value from the t-distribution for testing the difference between the two population means using a significance level of 0.05 is t = 1.6772. Question
Question
The Sergio Lumber Company manufactures plywood. One step in the process is the one where the veneer is dried by passing through a huge dryer (similar to an oven) where much of the moisture in the veneer is extracted. At the end of this step, samples of veneer are tested for moisture content. It is believed that pine veneer will be less moist on average than will fir veneer. The following data were reported recently where the values represent the percent moisture in the wood: 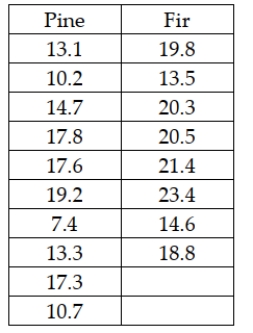 Based on these data, the critical t value from the t-distribution will be 1.7459 if the significance level is set at 0.05 and variances are presumed equal.
Based on these data, the critical t value from the t-distribution will be 1.7459 if the significance level is set at 0.05 and variances are presumed equal. Question
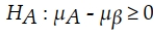
The Sergio Lumber Company manufactures plywood. One step in the process is the one where the veneer is dried by passing through a huge dryer (similar to an oven) where much of the moisture in the veneer is extracted. At the end of this step, samples of veneer are tested for moisture content. It is believed that pine veneer will be less moist on average than will fir veneer. The following data were reported recently where the values represent the percent of moisture in the wood: 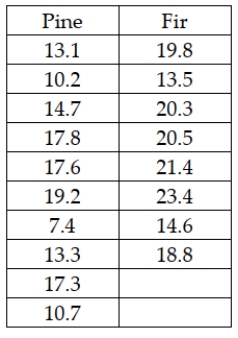 The null and alternative hypotheses to be tested are
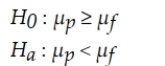
The null and alternative hypotheses to be tested are Question
Question
An accounting firm has been hired by a large computer company to determine whether the proportion of accounts receivables with errors in one division (Division 1) exceeds that of the second division (Division 2). The managers believe that such a difference may exist because of the lax standards employed by the first division. To conduct the test, the accounting firm has selected random samples of accounts from each division with the following results. 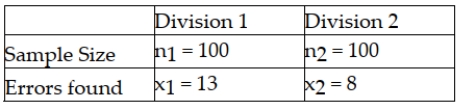 Based on this information and using a significance level equal to 0.05, the critical value from the standard normal table is z = 1.645.
Based on this information and using a significance level equal to 0.05, the critical value from the standard normal table is z = 1.645. Question
Question
Question
Two placement exams are available that students can take to determine which math class they should begin with in their freshman year. It is believed that there is no difference in the mean scores that would be received for the two tests. To test this using a 0.05 level of significance, a randomly selected group of students took both tests and had their scores recorded. The following data were obtained: 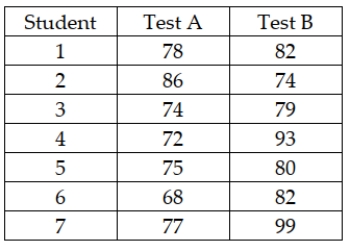 Based on these data, the test statistic is approximately t = -1.892.
Based on these data, the test statistic is approximately t = -1.892. Question
Question
An accounting firm has been hired by a large computer company to determine whether the proportion of accounts receivables with errors in one division (Division 1) exceeds that of the second division (Division 2). The managers believe that such a difference may exist because of the lax standards employed by the first division. To conduct the test, the accounting firm has selected random samples of accounts from each division with the following results. 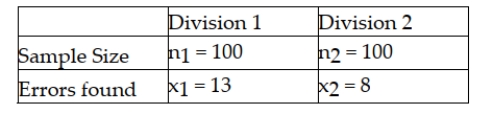 Based on this information, and using a significance level equal to 0.05, the pooled estimator for the overall proportion is = .1050.
Based on this information, and using a significance level equal to 0.05, the pooled estimator for the overall proportion is = .1050. Question
Question
Question
Question
Question
There is interest at the American Savings and Loan as to whether there is a difference between average daily balances in checking accounts that are joint accounts (two or more members per account) versus single accounts (one member per account). To test this, a random sample of checking accounts was selected with the following results: 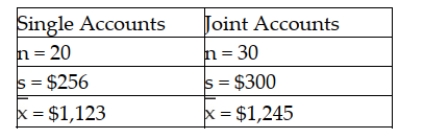 Based upon these data, assuming that the populations are normally distributed with equal variances, the test statistic for testing whether the two populations have equal means is approximately -1.49.
Based upon these data, assuming that the populations are normally distributed with equal variances, the test statistic for testing whether the two populations have equal means is approximately -1.49. Question
In order to test the difference in populations means, samples were collected for two independent populations where the variances are assumed equal and the population normally distributed. The following data resulted: 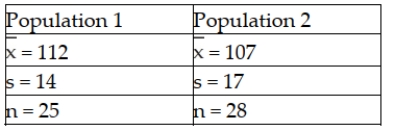 The value of the pooled standard deviation is 15.66.
The value of the pooled standard deviation is 15.66. Question
Question
Question
Question
A recent study posed the question about whether Japanese managers are more motivated than American managers. A randomly selected sample of each was administered the Sarnoff Survey of Attitudes Toward Life (SSATL), which measures motivation for upward mobility. The SSATL scores are summarized below. 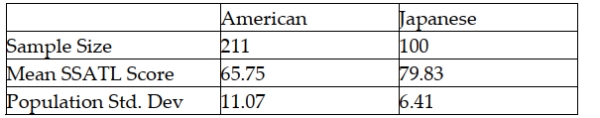 Judging from the way the data were collected, which test would likely be most appropriate?
A) Related samples t-test for mean difference
B) Pooled-variance t-test for the difference in means
C) Independent samples Z-test for the difference in means
D) Related samples Z-test for mean difference
Judging from the way the data were collected, which test would likely be most appropriate?A) Related samples t-test for mean difference
B) Pooled-variance t-test for the difference in means
C) Independent samples Z-test for the difference in means
D) Related samples Z-test for mean difference
Question
A direct retailer that sells clothing on the Internet has two distribution centers and wants to determine if there is a difference between the proportion of customer order shipments that contain errors (wrong color, wrong size, etc.). It takes a sample of orders from each distribution center and obtain the following results: 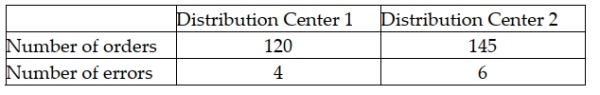 Based on these data it can proceed with assuming the normal distribution for each of the proportion sampling distributions.
Based on these data it can proceed with assuming the normal distribution for each of the proportion sampling distributions. Question
A major manufacturer of home electronics is interested in determining whether customers have a preference between two new speaker designs for their home entertainment centers. To test this, the design department manager has selected a random sample of customers and shown them the first design. A second sample of customers is shown design 2. The manager then asks each customer whether they prefer the new design they were shown over the one they currently own. The following results were observed: 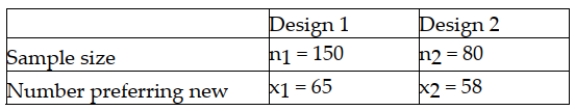 Based on these data and a significance level equal to 0.05, the test statistic is approximately -4.22 and thus the null hypothesis should be rejected.
Based on these data and a significance level equal to 0.05, the test statistic is approximately -4.22 and thus the null hypothesis should be rejected. Question
Question
A company in Maryland has developed a device that can be attached to car engines, which it believes will increase the miles per gallon that cars will get. The owners are interested in estimating the difference between mean mpg for cars using the device versus those that are not using the device. The following data represent the mpg for independent random samples of cars from each population. The variances are assumed equal and the populations normally distributed. 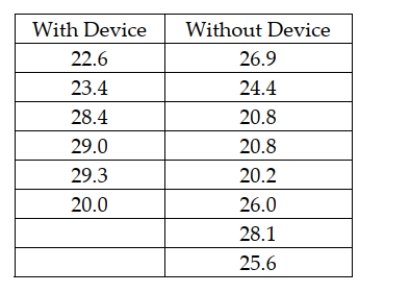 Given this data, what is the critical value if the owners wish to have a 90 percent confidence interval estimate?
A) t = 2.015
B) t = 1.7823
C) z = 1.645
D) z = 1.96
Given this data, what is the critical value if the owners wish to have a 90 percent confidence interval estimate?A) t = 2.015
B) t = 1.7823
C) z = 1.645
D) z = 1.96
Question
A commuter has two different routes available to drive to work. She wants to test whether route A is faster than route B. The best hypotheses are:
A)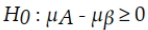
B)
C)
D)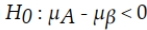
A)
B)
C)
D)
Question
A major retail clothing store is interested in estimating the difference in mean monthly purchases by customers who use the store's in-house credit card versus using a Visa, Mastercard, or one of the other major credit cards. To do this, it has randomly selected a sample of customers who have made one or more purchases with each of the types of credit cards. The following represents the results of the sampling: 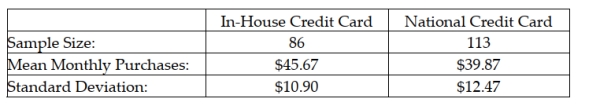 Given this information, which of the following statements is true?
A) If either of the sample sizes is increased, the resulting confidence interval will have a smaller margin of error.
B) If the confidence level were changed from 95 percent to 90 percent, the margin of error in the estimate would be reduced.
C) Neither A nor B are true.
D) Both A and B are true.
Given this information, which of the following statements is true?A) If either of the sample sizes is increased, the resulting confidence interval will have a smaller margin of error.
B) If the confidence level were changed from 95 percent to 90 percent, the margin of error in the estimate would be reduced.
C) Neither A nor B are true.
D) Both A and B are true.
Question
Question
A company in Maryland has developed a device that can be attached to car engines, which it believes will increase the miles per gallon that cars will get. The owners are interested in estimating the difference between mean mpg for cars using the device versus those that are not using the device. The following data represent the mpg for random independent samples of cars from each population. The variances are assumed equal and the populations normally distributed. 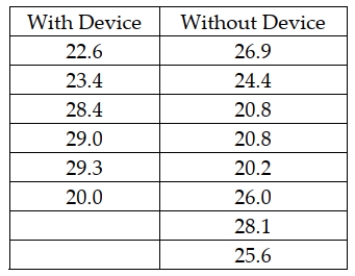 Given this data, what is the upper limit for a 95 percent confidence interval estimate for the difference in mean mpg?
A) Approximately 3.88 mpg
B) About 5.44 mpg
C) Just under 25.0
D) None of the above
Given this data, what is the upper limit for a 95 percent confidence interval estimate for the difference in mean mpg?A) Approximately 3.88 mpg
B) About 5.44 mpg
C) Just under 25.0
D) None of the above
Question
A major retail clothing store is interested in estimating the difference in mean monthly purchases by customers who use the store's in-house credit card versus using a Visa, Mastercard, or one of the other major credit cards. To do this, it has randomly selected a sample of customers who have made one or more purchases with each of the types of credit cards. The following represents the results of the sampling: 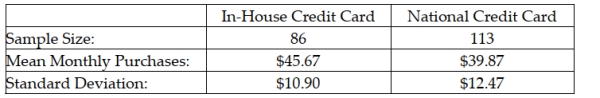 Based on these sample data, what is the lower limit for the 95 percent confidence interval estimate for the difference between population means?
A) About $5.28
B) Approximately $4.85
C) Approximately $2.54
D) Approximately $3.41
Based on these sample data, what is the lower limit for the 95 percent confidence interval estimate for the difference between population means?A) About $5.28
B) Approximately $4.85
C) Approximately $2.54
D) Approximately $3.41
Question
The management of a department store is interested to estimate the difference in the amount of money spent by female and male shoppers. You are given the following information. 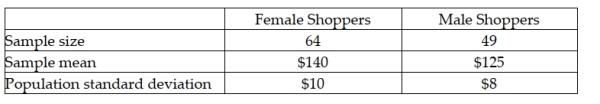 A 95 percent confidence interval estimate for the difference between the average purchases of the customers using the two different credit cards is:
A) 49 to 64
B) 11.68 to 18.32
C) 125 to 140
D) 8 to 10
A 95 percent confidence interval estimate for the difference between the average purchases of the customers using the two different credit cards is:A) 49 to 64
B) 11.68 to 18.32
C) 125 to 140
D) 8 to 10
Question
A major manufacturer of home electronics is interested in determining whether customers have a preference between two new speaker designs for their home entertainment centers. To test this, the design department manager has selected a random sample of customers and shown them the first design. A second sample of customers is shown design 2. The manager then asks each customer whether they prefer the new design they were shown over the one they currently own. The following results were observed: 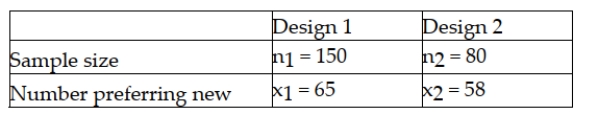 Based on these data and a significance level equal to 0.05, the appropriate null and alternative hypotheses are: H0 : 1 ≥ 2 Ha : 1 < 2
Based on these data and a significance level equal to 0.05, the appropriate null and alternative hypotheses are: H0 : 1 ≥ 2 Ha : 1 < 2 Question
Question
Question
A recent study posed the question about whether Japanese managers are more motivated than American managers. A randomly selected sample of each was administered the Sarnoff Survey of Attitudes Toward Life (SSATL), which measures motivation for upward mobility. The SSATL scores are summarized below. 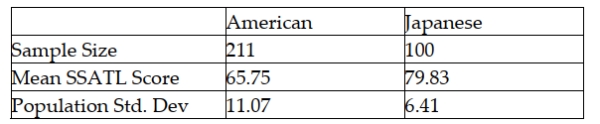 Which of the following is the correct the null and alternative hypotheses to determine if the average SSATL score of Japanese managers differs from the average SSATL score of American managers?
A)
B)
C)
D)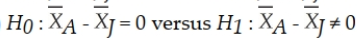
Which of the following is the correct the null and alternative hypotheses to determine if the average SSATL score of Japanese managers differs from the average SSATL score of American managers? A)
B)
C)
D)
Question
Question
A major retail clothing store is interested in estimating the difference in mean monthly purchases by customers who use the store's in-house credit card versus using a Visa, Mastercard, or one of the other major credit cards. To do this, it has randomly selected a sample of customers who have made one or more purchases with each of the types of credit cards. The following represents the results of the sampling: 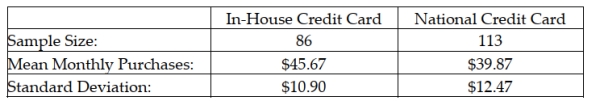 Suppose that the managers wished to test whether there is a statistical difference in the mean monthly purchases by customers using the two types of credit cards, using a significance level of .05, what is the value of the test statistic assuming the standard deviations are known?
A) t = 3.49
B) z = 11.91
C) z = 2.86
D) z = 3.49
Suppose that the managers wished to test whether there is a statistical difference in the mean monthly purchases by customers using the two types of credit cards, using a significance level of .05, what is the value of the test statistic assuming the standard deviations are known?A) t = 3.49
B) z = 11.91
C) z = 2.86
D) z = 3.49
Question
Question
An accounting firm has been hired by a large computer company to determine whether the proportion of accounts receivables with errors in one division (Division 1) exceeds that of the second division (Division 2). The managers believe that such a difference may exist because of the lax standards employed by the first division. To conduct the test, the accounting firm has selected random samples of accounts from each division with the following results. 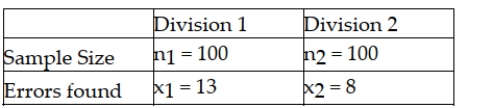 Based on this information and using a significance level equal to 0.05, the test statistic for the hypothesis test is approximately 1.153 and, therefore, the null hypothesis is not rejected.
Based on this information and using a significance level equal to 0.05, the test statistic for the hypothesis test is approximately 1.153 and, therefore, the null hypothesis is not rejected. Question
Most companies that make golf balls and golf clubs use a one-armed robot named "Iron Mike" to test their balls for length and accuracy, but because of swing variations by real golfers, these test robots don't always indicate how the clubs will perform in actual use. One company in the golfing industry is interested in testing its new driver to see if it has greater length off the tee than the best-selling driver. To do this, it has selected a group of golfers of differing abilities and ages. Its plan is to have each player use each of the two clubs and hit five balls. It will record the average length of the drives with each club for each player. The resulting data for a sample of 10 players are: 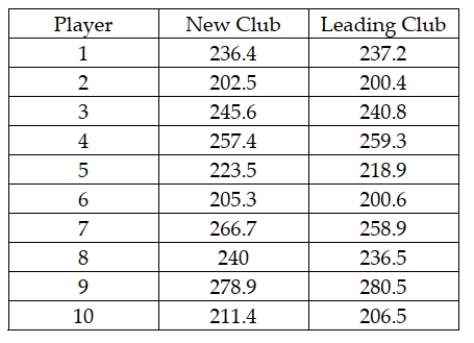 What is the critical value for the appropriate hypothesis test if the test is conducted using a 0.05 level of significance?
A) z = 1.645
B) t = 1.7341
C) t = 1.8331
D) t = 2.2622
What is the critical value for the appropriate hypothesis test if the test is conducted using a 0.05 level of significance?A) z = 1.645
B) t = 1.7341
C) t = 1.8331
D) t = 2.2622
Question
Question
Question
Question
Most companies that make golf balls and golf clubs use a one-armed robot named "Iron Byron" to test their balls for length and accuracy, but because of swing variations by real golfers, these test robots don't always indicate how the clubs will perform in actual use. One company in the golfing industry is interested in testing its new driver to see if has greater length off the tee than the best-selling driver. To do this, it has selected a group of golfers of differing abilities and ages. Its plan is to have each player use each of the two clubs and hit five balls. It will record the average length of the drives with each club for each player. The resulting data for a sample of 10 players is: 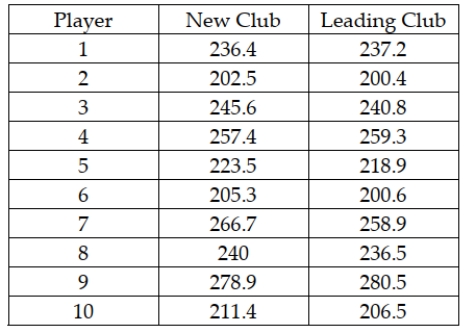 Based on these sample data, what is the point estimate for the difference between the mean distance for the new driver versus the leading driver?
A) 2.81
B) 1.55
C) -3.45
D) 233.4
Based on these sample data, what is the point estimate for the difference between the mean distance for the new driver versus the leading driver?A) 2.81
B) 1.55
C) -3.45
D) 233.4
Question
Question
There have been complaints recently from homeowners in the north end claiming that their homes have been assessed at values that are too high compare with other parts of town. They say that the mean increase from last year to this year has been higher in their part of town than elsewhere. To test this, the assessor's office staff plans to select a random sample of north end properties (group 1) and a random sample of properties from other areas within the city (group 2) and perform a hypothesis test. The following sample information is available: 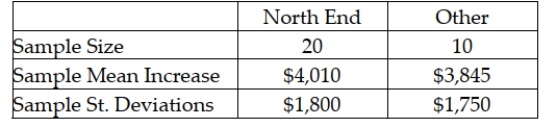 Assuming that the null hypothesis will be tested using an alpha level equal to 0.05, what is the value of the test statistic?
A) z = 1.578
B) t = 1.7011
C) t = 0.2388
D) t = 0.3944
Assuming that the null hypothesis will be tested using an alpha level equal to 0.05, what is the value of the test statistic?A) z = 1.578
B) t = 1.7011
C) t = 0.2388
D) t = 0.3944
Question
Most companies that make golf balls and golf clubs use a one-armed robot named "Iron Byron" to test their balls for length and accuracy, but because of swing variations by real golfers, these test robots don't always indicate how the clubs will perform in actual use. One company in the golfing industry is interested in testing its new driver to see if it has greater length off the tee than the best-selling driver. To do this, it has selected a group of golfers of differing abilities and ages. Its plan is to have each player use each of the two clubs and hit five balls. It will record the average length of the drives with each club for each player. The resulting data for a sample of 10 players are: 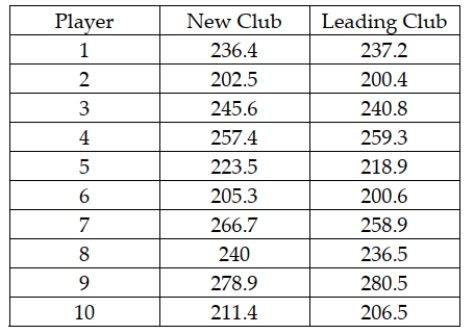 What is an appropriate null hypothesis to be tested?
A) H0 : μ1 = μ2
B) H0 : μ1 ≥ μ2
C) H0 : μd ≤ 0
D) H0 : μD = 0
What is an appropriate null hypothesis to be tested?A) H0 : μ1 = μ2
B) H0 : μ1 ≥ μ2
C) H0 : μd ≤ 0
D) H0 : μD = 0
Question
Question
There have been complaints recently from homeowners in the north end claiming that their homes have been assessed at values that are too high compare with other parts of town. They say that the mean increase from last year to this year has been higher in their part of town than elsewhere. To test this, the assessor's office staff plans to select a random sample of north end properties (group 1) and a random sample of properties from other areas within the city (group 2) and perform a hypothesis test. The following sample information is available: 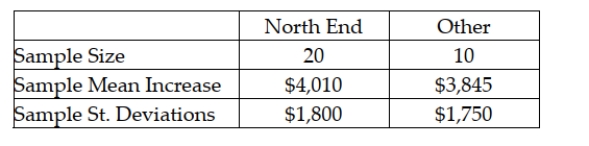 Assuming that the null hypothesis will be tested using an alpha level equal to 0.05, what is the critical value?
A) z = 1.578
B) t = 1.7011
C) t = 0.2388
D) t = 2.0484
Assuming that the null hypothesis will be tested using an alpha level equal to 0.05, what is the critical value?A) z = 1.578
B) t = 1.7011
C) t = 0.2388
D) t = 2.0484
Question
Question
To increase productivity, workers went through a training program. The management wanted to know the effectiveness of the program. A sample of seven workers was taken and their daily production rates before and after the training are shown below. 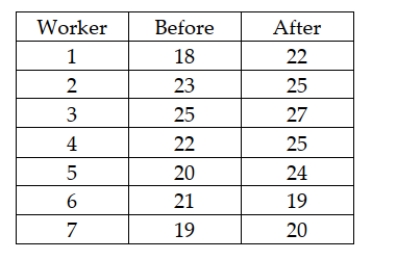 Based on the data, the training program is:
A) effective.
B) ineffective.
C) neither effective nor ineffective.
D) None of the above
Based on the data, the training program is:A) effective.
B) ineffective.
C) neither effective nor ineffective.
D) None of the above
Question
Question
The U.S. Golf Association provides a number of services for its members. One of these is the evaluation of golf equipment to make sure that the equipment satisfies the rules of golf. For example, they regularly test the golf balls made by the various companies that sell balls in the United States. Recently they undertook a study of two brands of golf balls with the objective to see whether there is a difference in the mean distance that the two golf ball brands will fly off the tee. To conduct the test, the U.S.G.A. uses a robot named "Iron Byron," which swings the club at the same speed and with the same swing pattern each time it is used. The following data reflect sample data for a random sample of balls of each brand.  Given this information, what is the test statistic for testing whether the two population means are equal?
A) t = 1.115
B) t = 1.96
C) t = -4.04
D) t = -2.58
Given this information, what is the test statistic for testing whether the two population means are equal?A) t = 1.115
B) t = 1.96
C) t = -4.04
D) t = -2.58
Question
Question
Question
Question
Question
Question
There have been complaints recently from homeowners in the north end claiming that their homes have been assessed at values that are too high compared with other parts of town. They say that the mean increase from last year to this year has been higher in their part of town than elsewhere. To test this, the assessor's office staff plans to select a random sample of north end properties (group 1) and a random sample of properties from other areas within the city (group 2) and perform a hypothesis test. Based on the information provided, the research (or alternate) hypothesis is:
A)
B)
C)
D)
A)
B)
C)
D)

Unlock Deck
Sign up to unlock the cards in this deck!
Unlock Deck
Unlock Deck
1/121
Play
Full screen (f)
Deck 10: Estimation and Hypothesis Testing for Two Population Parameters
1
The Cranston Hardware Company is interested in estimating the difference in the mean purchase for men customers versus women customers. It wishes to estimate this difference using a 95 percent confidence level. Assume that the variances are equal and the populations normally distributed. The following data represent independent samples from each population: Based on these data, the company can conclude that there is a statistical difference between men and women with regard to mean spending at the hardware store with men tending to spend more on average than women.
Based on these data, the company can conclude that there is a statistical difference between men and women with regard to mean spending at the hardware store with men tending to spend more on average than women.True
2
Box and whisker plots are often useful for determining whether two populations have distributions that might be skewed.
True
3
In estimating the difference between two population means, if a 95 percent confidence interval includes zero, then we can conclude that there is a 95 percent chance that the difference between the two population means is zero.
False
4
Increasing the size of the samples in a study to estimate the difference between two population means will increase the level of confidence that a decision maker can have regarding the interval estimate.
Unlock Deck
Unlock for access to all 121 flashcards in this deck.
Unlock Deck
k this deck
5
Marketing managers for a toy store located in two separate cities is interested in estimating the difference in the mean daily sales for the two cities. They want to calculate a 90 percent confidence interval and will select a sample of 10 days in each store for the study. If the marketing managers assume that the population standard deviations are known, the critical value for the confidence interval is z = 1.645.
Unlock Deck
Unlock for access to all 121 flashcards in this deck.
Unlock Deck
k this deck
6
In order to make the test for the difference between two population means valid, the sample size in each independent sample must be the same.
Unlock Deck
Unlock for access to all 121 flashcards in this deck.
Unlock Deck
k this deck
7
The NCAA is interested in estimating the difference in mean number of daily training hours for men and women athletes on college campuses. It wants 95 percent confidence and will select a sample of 10 men and 10 women for the study. The variances are assumed equal and the populations normally distributed. The sample results are: Based on these data, the lower limit for the difference between population means is 0.15 hours.
Based on these data, the lower limit for the difference between population means is 0.15 hours. Unlock Deck
Unlock for access to all 121 flashcards in this deck.
Unlock Deck
k this deck
8
The NCAA is interested in estimating the difference in mean number of daily training hours for men and women athletes on college campuses. It wants 95 percent confidence and will select a sample of 10 men and 10 women for the study. The variances are assumed equal and the populations normally distributed. The sample results are: Based on these sample data, the critical value for developing the confidence interval is z = 1.96.
Based on these sample data, the critical value for developing the confidence interval is z = 1.96. Unlock Deck
Unlock for access to all 121 flashcards in this deck.
Unlock Deck
k this deck
9
All other things held constant, decreasing the level of confidence for a confidence interval estimate for the difference between two population means will result in a smaller margin of error.
Unlock Deck
Unlock for access to all 121 flashcards in this deck.
Unlock Deck
k this deck
10
The Cranston Hardware Company is interested in estimating the difference in the mean purchase for men customers versus women customers. It wishes to estimate this difference using a 95 percent confidence level. If the sample size is n = 10 from each population, the samples are independent, and sample standard deviations are used, and the variances are assumed equal, then the critical value will be t = 2.1009.
Unlock Deck
Unlock for access to all 121 flashcards in this deck.
Unlock Deck
k this deck
11
The NCAA is interested in estimating the difference in mean number of daily training hours for men and women athletes on college campuses. They want 95 percent confidence and will select a sample of 10 men and 10 women for the study. The sample results are: Based on these data, the point estimate is .30 hours.
Based on these data, the point estimate is .30 hours. Unlock Deck
Unlock for access to all 121 flashcards in this deck.
Unlock Deck
k this deck
12
The t-distribution is still applicable even when there are small violations of the assumptions for the case when the variances for two populations are unknown. This is particularly true when the sample sizes are approximately equal.
Unlock Deck
Unlock for access to all 121 flashcards in this deck.
Unlock Deck
k this deck
13
Recently the managers for a large retail department store stated that a study has revealed that female shoppers spend on average 23.5 minutes longer in the store per visit than do male shoppers. Based on this information, the managers can be confident that female shoppers, as a population, do spend longer times in the store than do males shoppers, as a population.
Unlock Deck
Unlock for access to all 121 flashcards in this deck.
Unlock Deck
k this deck
14
In estimating the difference between two population means based on small, independent samples from the two populations, two important assumptions are that the populations each be normally distributed and the populations have equal variances.
Unlock Deck
Unlock for access to all 121 flashcards in this deck.
Unlock Deck
k this deck
15
In estimating a confidence interval for the difference between two means, when the samples are independent and the standard deviations are unknown, it can be acceptable for there to be small violations of the assumptions of normality and equal variances, especially when the sample sizes are equal.
Unlock Deck
Unlock for access to all 121 flashcards in this deck.
Unlock Deck
k this deck
16
The NCAA is interested in estimating the difference in mean number of daily training hours for men and women athletes on college campuses. It wants 95 percent confidence and will select a sample of 10 men and 10 women for the study. The variances are assumed equal and the populations normally distributed. The sample results are: Based on these sample data, the estimate for the standard deviation of the sampling distribution is found by taking the square root of the sum of the two sample variances.
Based on these sample data, the estimate for the standard deviation of the sampling distribution is found by taking the square root of the sum of the two sample variances. Unlock Deck
Unlock for access to all 121 flashcards in this deck.
Unlock Deck
k this deck
17
When performing a hypothesis test for the difference between the means of two independent populations, where the standard deviations are known, the variances must be assumed equal.
Unlock Deck
Unlock for access to all 121 flashcards in this deck.
Unlock Deck
k this deck
18
The Cranston Hardware Company is interested in estimating the difference in the mean purchase for men customers versus women customers. It wishes to estimate this difference using a 95 percent confidence level. Assume that the variances are equal and the populations normally distributed. The following data represent independent samples from each population: Based on these data, the upper limit of the interval estimate is approximately $13.82.
Based on these data, the upper limit of the interval estimate is approximately $13.82. Unlock Deck
Unlock for access to all 121 flashcards in this deck.
Unlock Deck
k this deck
19
Two samples are said to be independent if they are collected at different points in time.
Unlock Deck
Unlock for access to all 121 flashcards in this deck.
Unlock Deck
k this deck
20
To find a confidence interval for the difference between the means of independent samples, when the variances are unknown but assumed equal, the sample sizes of the two groups must be the same.
Unlock Deck
Unlock for access to all 121 flashcards in this deck.
Unlock Deck
k this deck
21
If you are interested in estimating the difference between the means of two samples that have been paired, the point estimate for this difference is the mean value of the paired differences.
Unlock Deck
Unlock for access to all 121 flashcards in this deck.
Unlock Deck
k this deck
22
There is interest at the American Savings and Loan as to whether there is a difference between average daily balances in checking accounts that are joint accounts (two or more members per account) versus single accounts (one member per account). To test this, a random sample of checking accounts was selected with the following results: Based upon these data, the critical value from the t-distribution for testing the difference between the two population means using a significance level of 0.05 is t = 1.6772.
Based upon these data, the critical value from the t-distribution for testing the difference between the two population means using a significance level of 0.05 is t = 1.6772. Unlock Deck
Unlock for access to all 121 flashcards in this deck.
Unlock Deck
k this deck
23
To test whether Model A and Model B cars have the same MPG, the first step is to select two independent random samples of drivers and assign one of them to drive Model A and the other Model B.
Unlock Deck
Unlock for access to all 121 flashcards in this deck.
Unlock Deck
k this deck
24
The Sergio Lumber Company manufactures plywood. One step in the process is the one where the veneer is dried by passing through a huge dryer (similar to an oven) where much of the moisture in the veneer is extracted. At the end of this step, samples of veneer are tested for moisture content. It is believed that pine veneer will be less moist on average than will fir veneer. The following data were reported recently where the values represent the percent moisture in the wood: Based on these data, the critical t value from the t-distribution will be 1.7459 if the significance level is set at 0.05 and variances are presumed equal.
Based on these data, the critical t value from the t-distribution will be 1.7459 if the significance level is set at 0.05 and variances are presumed equal. Unlock Deck
Unlock for access to all 121 flashcards in this deck.
Unlock Deck
k this deck
25
The Sergio Lumber Company manufactures plywood. One step in the process is the one where the veneer is dried by passing through a huge dryer (similar to an oven) where much of the moisture in the veneer is extracted. At the end of this step, samples of veneer are tested for moisture content. It is believed that pine veneer will be less moist on average than will fir veneer. The following data were reported recently where the values represent the percent of moisture in the wood: The null and alternative hypotheses to be tested are
The null and alternative hypotheses to be tested are Unlock Deck
Unlock for access to all 121 flashcards in this deck.
Unlock Deck
k this deck
26
To find the pooled standard deviation involves taking a weighted average of the two sample variances, then finding its square root.
Unlock Deck
Unlock for access to all 121 flashcards in this deck.
Unlock Deck
k this deck
27
An accounting firm has been hired by a large computer company to determine whether the proportion of accounts receivables with errors in one division (Division 1) exceeds that of the second division (Division 2). The managers believe that such a difference may exist because of the lax standards employed by the first division. To conduct the test, the accounting firm has selected random samples of accounts from each division with the following results. Based on this information and using a significance level equal to 0.05, the critical value from the standard normal table is z = 1.645.
Based on this information and using a significance level equal to 0.05, the critical value from the standard normal table is z = 1.645. Unlock Deck
Unlock for access to all 121 flashcards in this deck.
Unlock Deck
k this deck
28
In comparing two populations using paired differences, after the difference is found for each pair, the method for testing whether the mean difference is equal to 0 becomes the same as was used for a one- sample hypothesis test with unknown standard deviation.
Unlock Deck
Unlock for access to all 121 flashcards in this deck.
Unlock Deck
k this deck
29
The test statistic that is used when testing hypotheses about the difference between two population proportions is the t-value from the t-distribution.
Unlock Deck
Unlock for access to all 121 flashcards in this deck.
Unlock Deck
k this deck
30
Two placement exams are available that students can take to determine which math class they should begin with in their freshman year. It is believed that there is no difference in the mean scores that would be received for the two tests. To test this using a 0.05 level of significance, a randomly selected group of students took both tests and had their scores recorded. The following data were obtained: Based on these data, the test statistic is approximately t = -1.892.
Based on these data, the test statistic is approximately t = -1.892. Unlock Deck
Unlock for access to all 121 flashcards in this deck.
Unlock Deck
k this deck
31
The point estimate in a paired difference estimation example is an estimation of the population differences lying halfway between the interval limits of a confidence interval.
Unlock Deck
Unlock for access to all 121 flashcards in this deck.
Unlock Deck
k this deck
32
An accounting firm has been hired by a large computer company to determine whether the proportion of accounts receivables with errors in one division (Division 1) exceeds that of the second division (Division 2). The managers believe that such a difference may exist because of the lax standards employed by the first division. To conduct the test, the accounting firm has selected random samples of accounts from each division with the following results. Based on this information, and using a significance level equal to 0.05, the pooled estimator for the overall proportion is = .1050.
Based on this information, and using a significance level equal to 0.05, the pooled estimator for the overall proportion is = .1050. Unlock Deck
Unlock for access to all 121 flashcards in this deck.
Unlock Deck
k this deck
33
When performing a hypothesis test for the difference between the means of two independent populations where the standard deviations are known, it is necessary to use the pooled standard deviation in calculating the test statistic.
Unlock Deck
Unlock for access to all 121 flashcards in this deck.
Unlock Deck
k this deck
34
If the sample data lead us to suspect that the variances of the two populations are not equal, the t-test statistic and the degrees of freedom must be adjusted accordingly.
Unlock Deck
Unlock for access to all 121 flashcards in this deck.
Unlock Deck
k this deck
35
The Sergio Lumber Company manufactures plywood. One step in the process is the one where the veneer is dried by passing through a huge dryer (similar to an oven) where much of the moisture in the veneer is extracted. At the end of this step, samples of veneer are tested for moisture content. It is believed that pine veneer will be less moist on average than will fir veneer. The hypothesis test that will be conducted using an alpha = 0.05 level will be a two-tailed test.
Unlock Deck
Unlock for access to all 121 flashcards in this deck.
Unlock Deck
k this deck
36
An accounting firm has been hired by a large computer company to determine whether the proportion of accounts receivables with errors in one division (Division 1) exceeds that of the second division (Division 2). The managers believe that such a difference may exist because of the lax standards employed by the first division. The null and alternative hypotheses that will be tested are: H0 : μ1 ≥ μ2 Ha : μ1 < μ2
Unlock Deck
Unlock for access to all 121 flashcards in this deck.
Unlock Deck
k this deck
37
There is interest at the American Savings and Loan as to whether there is a difference between average daily balances in checking accounts that are joint accounts (two or more members per account) versus single accounts (one member per account). To test this, a random sample of checking accounts was selected with the following results: Based upon these data, assuming that the populations are normally distributed with equal variances, the test statistic for testing whether the two populations have equal means is approximately -1.49.
Based upon these data, assuming that the populations are normally distributed with equal variances, the test statistic for testing whether the two populations have equal means is approximately -1.49. Unlock Deck
Unlock for access to all 121 flashcards in this deck.
Unlock Deck
k this deck
38
In order to test the difference in populations means, samples were collected for two independent populations where the variances are assumed equal and the population normally distributed. The following data resulted: The value of the pooled standard deviation is 15.66.
The value of the pooled standard deviation is 15.66. Unlock Deck
Unlock for access to all 121 flashcards in this deck.
Unlock Deck
k this deck
39
The t-distribution can be used to test hypotheses about the difference between two population means given the following two assumptions: - each population is normally distributed, and - the two populations have equal variances.
Unlock Deck
Unlock for access to all 121 flashcards in this deck.
Unlock Deck
k this deck
40
When conducting a hypothesis test to determine whether or not two groups differ, using paired samples rather than independent samples has the advantage of controlling for sources of variation that might distort the conclusions of the study.
Unlock Deck
Unlock for access to all 121 flashcards in this deck.
Unlock Deck
k this deck
41
When estimating a confidence interval for the difference between 2 means using the method where sample variances are pooled, which of the following assumptions is not needed?
A) The populations are normally distributed.
B) The populations have equal variances.
C) The samples are independent.
D) The sample sizes are equal.
A) The populations are normally distributed.
B) The populations have equal variances.
C) The samples are independent.
D) The sample sizes are equal.
Unlock Deck
Unlock for access to all 121 flashcards in this deck.
Unlock Deck
k this deck
42
A recent study posed the question about whether Japanese managers are more motivated than American managers. A randomly selected sample of each was administered the Sarnoff Survey of Attitudes Toward Life (SSATL), which measures motivation for upward mobility. The SSATL scores are summarized below. Judging from the way the data were collected, which test would likely be most appropriate?
A) Related samples t-test for mean difference
B) Pooled-variance t-test for the difference in means
C) Independent samples Z-test for the difference in means
D) Related samples Z-test for mean difference
Judging from the way the data were collected, which test would likely be most appropriate?A) Related samples t-test for mean difference
B) Pooled-variance t-test for the difference in means
C) Independent samples Z-test for the difference in means
D) Related samples Z-test for mean difference
Unlock Deck
Unlock for access to all 121 flashcards in this deck.
Unlock Deck
k this deck
43
A direct retailer that sells clothing on the Internet has two distribution centers and wants to determine if there is a difference between the proportion of customer order shipments that contain errors (wrong color, wrong size, etc.). It takes a sample of orders from each distribution center and obtain the following results: Based on these data it can proceed with assuming the normal distribution for each of the proportion sampling distributions.
Based on these data it can proceed with assuming the normal distribution for each of the proportion sampling distributions. Unlock Deck
Unlock for access to all 121 flashcards in this deck.
Unlock Deck
k this deck
44
A major manufacturer of home electronics is interested in determining whether customers have a preference between two new speaker designs for their home entertainment centers. To test this, the design department manager has selected a random sample of customers and shown them the first design. A second sample of customers is shown design 2. The manager then asks each customer whether they prefer the new design they were shown over the one they currently own. The following results were observed: Based on these data and a significance level equal to 0.05, the test statistic is approximately -4.22 and thus the null hypothesis should be rejected.
Based on these data and a significance level equal to 0.05, the test statistic is approximately -4.22 and thus the null hypothesis should be rejected. Unlock Deck
Unlock for access to all 121 flashcards in this deck.
Unlock Deck
k this deck
45
A direct retailer that sells clothing on the Internet has two distribution centers and wants to determine if there is a difference between the proportion of customer order shipments that contain errors (wrong color, wrong size, etc.). It calculates a 95 percent confidence interval on the difference in the sample proportions to be -0.012 to 0.037. Based on this, it can conclude that the distribution centers differ significantly for the proportion of orders with errors.
Unlock Deck
Unlock for access to all 121 flashcards in this deck.
Unlock Deck
k this deck
46
A company in Maryland has developed a device that can be attached to car engines, which it believes will increase the miles per gallon that cars will get. The owners are interested in estimating the difference between mean mpg for cars using the device versus those that are not using the device. The following data represent the mpg for independent random samples of cars from each population. The variances are assumed equal and the populations normally distributed. Given this data, what is the critical value if the owners wish to have a 90 percent confidence interval estimate?
A) t = 2.015
B) t = 1.7823
C) z = 1.645
D) z = 1.96
Given this data, what is the critical value if the owners wish to have a 90 percent confidence interval estimate?A) t = 2.015
B) t = 1.7823
C) z = 1.645
D) z = 1.96
Unlock Deck
Unlock for access to all 121 flashcards in this deck.
Unlock Deck
k this deck
47
A commuter has two different routes available to drive to work. She wants to test whether route A is faster than route B. The best hypotheses are:
A)
B)
C)
D)
A)
B)
C)
D)
Unlock Deck
Unlock for access to all 121 flashcards in this deck.
Unlock Deck
k this deck
48
A major retail clothing store is interested in estimating the difference in mean monthly purchases by customers who use the store's in-house credit card versus using a Visa, Mastercard, or one of the other major credit cards. To do this, it has randomly selected a sample of customers who have made one or more purchases with each of the types of credit cards. The following represents the results of the sampling: Given this information, which of the following statements is true?
A) If either of the sample sizes is increased, the resulting confidence interval will have a smaller margin of error.
B) If the confidence level were changed from 95 percent to 90 percent, the margin of error in the estimate would be reduced.
C) Neither A nor B are true.
D) Both A and B are true.
Given this information, which of the following statements is true?A) If either of the sample sizes is increased, the resulting confidence interval will have a smaller margin of error.
B) If the confidence level were changed from 95 percent to 90 percent, the margin of error in the estimate would be reduced.
C) Neither A nor B are true.
D) Both A and B are true.
Unlock Deck
Unlock for access to all 121 flashcards in this deck.
Unlock Deck
k this deck
49
If the population variances are assumed to be known in an application where a manager wishes to estimate the difference between two population means, the 90 percent confidence interval estimate can be developed using which of the following critical values?
A) z = 1.645
B) z = 1.96
C) t value that depends on the sample sizes from the two populations
D) z = 2.575
A) z = 1.645
B) z = 1.96
C) t value that depends on the sample sizes from the two populations
D) z = 2.575
Unlock Deck
Unlock for access to all 121 flashcards in this deck.
Unlock Deck
k this deck
50
A company in Maryland has developed a device that can be attached to car engines, which it believes will increase the miles per gallon that cars will get. The owners are interested in estimating the difference between mean mpg for cars using the device versus those that are not using the device. The following data represent the mpg for random independent samples of cars from each population. The variances are assumed equal and the populations normally distributed. Given this data, what is the upper limit for a 95 percent confidence interval estimate for the difference in mean mpg?
A) Approximately 3.88 mpg
B) About 5.44 mpg
C) Just under 25.0
D) None of the above
Given this data, what is the upper limit for a 95 percent confidence interval estimate for the difference in mean mpg?A) Approximately 3.88 mpg
B) About 5.44 mpg
C) Just under 25.0
D) None of the above
Unlock Deck
Unlock for access to all 121 flashcards in this deck.
Unlock Deck
k this deck
51
A major retail clothing store is interested in estimating the difference in mean monthly purchases by customers who use the store's in-house credit card versus using a Visa, Mastercard, or one of the other major credit cards. To do this, it has randomly selected a sample of customers who have made one or more purchases with each of the types of credit cards. The following represents the results of the sampling: Based on these sample data, what is the lower limit for the 95 percent confidence interval estimate for the difference between population means?
A) About $5.28
B) Approximately $4.85
C) Approximately $2.54
D) Approximately $3.41
Based on these sample data, what is the lower limit for the 95 percent confidence interval estimate for the difference between population means?A) About $5.28
B) Approximately $4.85
C) Approximately $2.54
D) Approximately $3.41
Unlock Deck
Unlock for access to all 121 flashcards in this deck.
Unlock Deck
k this deck
52
The management of a department store is interested to estimate the difference in the amount of money spent by female and male shoppers. You are given the following information. A 95 percent confidence interval estimate for the difference between the average purchases of the customers using the two different credit cards is:
A) 49 to 64
B) 11.68 to 18.32
C) 125 to 140
D) 8 to 10
A 95 percent confidence interval estimate for the difference between the average purchases of the customers using the two different credit cards is:A) 49 to 64
B) 11.68 to 18.32
C) 125 to 140
D) 8 to 10
Unlock Deck
Unlock for access to all 121 flashcards in this deck.
Unlock Deck
k this deck
53
A major manufacturer of home electronics is interested in determining whether customers have a preference between two new speaker designs for their home entertainment centers. To test this, the design department manager has selected a random sample of customers and shown them the first design. A second sample of customers is shown design 2. The manager then asks each customer whether they prefer the new design they were shown over the one they currently own. The following results were observed: Based on these data and a significance level equal to 0.05, the appropriate null and alternative hypotheses are: H0 : 1 ≥ 2 Ha : 1 < 2
Based on these data and a significance level equal to 0.05, the appropriate null and alternative hypotheses are: H0 : 1 ≥ 2 Ha : 1 < 2 Unlock Deck
Unlock for access to all 121 flashcards in this deck.
Unlock Deck
k this deck
54
An Internet service provider is interested in estimating the proportion of homes in a particular community that have computers but do not already have Internet access. To do this, the company has selected a random sample of n = 200 homes and made calls. A total of 188 homes responded to the survey question with 38 saying that they had a computer with no Internet access. The 95 percent confidence interval estimate for the true population proportion is approximately 0.1447 - 0.2595.
Unlock Deck
Unlock for access to all 121 flashcards in this deck.
Unlock Deck
k this deck
55
Given the following information, calculate the degrees of freedom that should be used in the pooled- standard deviation t-test.
A) df = 41
B) df = 39
C) df = 16
D) df = 25
A) df = 41
B) df = 39
C) df = 16
D) df = 25
Unlock Deck
Unlock for access to all 121 flashcards in this deck.
Unlock Deck
k this deck
56
A recent study posed the question about whether Japanese managers are more motivated than American managers. A randomly selected sample of each was administered the Sarnoff Survey of Attitudes Toward Life (SSATL), which measures motivation for upward mobility. The SSATL scores are summarized below. Which of the following is the correct the null and alternative hypotheses to determine if the average SSATL score of Japanese managers differs from the average SSATL score of American managers?
A)
B)
C)
D)
Which of the following is the correct the null and alternative hypotheses to determine if the average SSATL score of Japanese managers differs from the average SSATL score of American managers? A)
B)
C)
D)
Unlock Deck
Unlock for access to all 121 flashcards in this deck.
Unlock Deck
k this deck
57
If we are testing for the difference between the means of two independent populations with samples of n1 = 20 and n2 = 20, the number of degrees of freedom is equal to:
A) 39
B) 38
C) 19
D) 18
A) 39
B) 38
C) 19
D) 18
Unlock Deck
Unlock for access to all 121 flashcards in this deck.
Unlock Deck
k this deck
58
A major retail clothing store is interested in estimating the difference in mean monthly purchases by customers who use the store's in-house credit card versus using a Visa, Mastercard, or one of the other major credit cards. To do this, it has randomly selected a sample of customers who have made one or more purchases with each of the types of credit cards. The following represents the results of the sampling: Suppose that the managers wished to test whether there is a statistical difference in the mean monthly purchases by customers using the two types of credit cards, using a significance level of .05, what is the value of the test statistic assuming the standard deviations are known?
A) t = 3.49
B) z = 11.91
C) z = 2.86
D) z = 3.49
Suppose that the managers wished to test whether there is a statistical difference in the mean monthly purchases by customers using the two types of credit cards, using a significance level of .05, what is the value of the test statistic assuming the standard deviations are known?A) t = 3.49
B) z = 11.91
C) z = 2.86
D) z = 3.49
Unlock Deck
Unlock for access to all 121 flashcards in this deck.
Unlock Deck
k this deck
59
If a manager wishes to develop a confidence interval estimate for estimating the difference between two population means, an increase in confidence level will result in:
A) a decrease in the size of the critical value.
B) a wider confidence interval.
C) a need for an increased sample size.
D) all of the above.
A) a decrease in the size of the critical value.
B) a wider confidence interval.
C) a need for an increased sample size.
D) all of the above.
Unlock Deck
Unlock for access to all 121 flashcards in this deck.
Unlock Deck
k this deck
60
An accounting firm has been hired by a large computer company to determine whether the proportion of accounts receivables with errors in one division (Division 1) exceeds that of the second division (Division 2). The managers believe that such a difference may exist because of the lax standards employed by the first division. To conduct the test, the accounting firm has selected random samples of accounts from each division with the following results. Based on this information and using a significance level equal to 0.05, the test statistic for the hypothesis test is approximately 1.153 and, therefore, the null hypothesis is not rejected.
Based on this information and using a significance level equal to 0.05, the test statistic for the hypothesis test is approximately 1.153 and, therefore, the null hypothesis is not rejected. Unlock Deck
Unlock for access to all 121 flashcards in this deck.
Unlock Deck
k this deck
61
Most companies that make golf balls and golf clubs use a one-armed robot named "Iron Mike" to test their balls for length and accuracy, but because of swing variations by real golfers, these test robots don't always indicate how the clubs will perform in actual use. One company in the golfing industry is interested in testing its new driver to see if it has greater length off the tee than the best-selling driver. To do this, it has selected a group of golfers of differing abilities and ages. Its plan is to have each player use each of the two clubs and hit five balls. It will record the average length of the drives with each club for each player. The resulting data for a sample of 10 players are: What is the critical value for the appropriate hypothesis test if the test is conducted using a 0.05 level of significance?
A) z = 1.645
B) t = 1.7341
C) t = 1.8331
D) t = 2.2622
What is the critical value for the appropriate hypothesis test if the test is conducted using a 0.05 level of significance?A) z = 1.645
B) t = 1.7341
C) t = 1.8331
D) t = 2.2622
Unlock Deck
Unlock for access to all 121 flashcards in this deck.
Unlock Deck
k this deck
62
Under what conditions can the t-distribution be correctly employed to test the difference between two population means?
A) When the samples from the two populations are small and the population variances are unknown
B) When the two populations of interest are assumed to be normally distributed
C) When the population variances are assumed to be equal
D) All of the above
A) When the samples from the two populations are small and the population variances are unknown
B) When the two populations of interest are assumed to be normally distributed
C) When the population variances are assumed to be equal
D) All of the above
Unlock Deck
Unlock for access to all 121 flashcards in this deck.
Unlock Deck
k this deck
63
If we are testing for the difference between the means of two paired populations with samples of n1 = 20 and n2 = 20, the number of degrees of freedom is equal to:
A) 39
B) 38
C) 19
D) 18
A) 39
B) 38
C) 19
D) 18
Unlock Deck
Unlock for access to all 121 flashcards in this deck.
Unlock Deck
k this deck
64
Suppose that a group of 10 people join a weight loss program for 3 months. Each person's weight is recorded at the beginning and at the end of the 3-month program. To test whether the weight loss program is effective, the data should be treated as:
A) independent samples using the normal distribution.
B) paired samples using the t-distribution.
C) independent samples using the t-distribution.
D) independent proportions.
A) independent samples using the normal distribution.
B) paired samples using the t-distribution.
C) independent samples using the t-distribution.
D) independent proportions.
Unlock Deck
Unlock for access to all 121 flashcards in this deck.
Unlock Deck
k this deck
65
Most companies that make golf balls and golf clubs use a one-armed robot named "Iron Byron" to test their balls for length and accuracy, but because of swing variations by real golfers, these test robots don't always indicate how the clubs will perform in actual use. One company in the golfing industry is interested in testing its new driver to see if has greater length off the tee than the best-selling driver. To do this, it has selected a group of golfers of differing abilities and ages. Its plan is to have each player use each of the two clubs and hit five balls. It will record the average length of the drives with each club for each player. The resulting data for a sample of 10 players is: Based on these sample data, what is the point estimate for the difference between the mean distance for the new driver versus the leading driver?
A) 2.81
B) 1.55
C) -3.45
D) 233.4
Based on these sample data, what is the point estimate for the difference between the mean distance for the new driver versus the leading driver?A) 2.81
B) 1.55
C) -3.45
D) 233.4
Unlock Deck
Unlock for access to all 121 flashcards in this deck.
Unlock Deck
k this deck
66
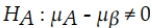
In conducting a hypothesis test for the difference between two population means where the standard deviations are known and the null hypothesis is: H0 : μA - μβ ≥ 0 What is the p-value assuming that the test statistic has been found to be z = 2.52?
A) 0.0059
B) 0.9882
C) 0.0118
D) 0.4941
A) 0.0059
B) 0.9882
C) 0.0118
D) 0.4941
Unlock Deck
Unlock for access to all 121 flashcards in this deck.
Unlock Deck
k this deck
67
There have been complaints recently from homeowners in the north end claiming that their homes have been assessed at values that are too high compare with other parts of town. They say that the mean increase from last year to this year has been higher in their part of town than elsewhere. To test this, the assessor's office staff plans to select a random sample of north end properties (group 1) and a random sample of properties from other areas within the city (group 2) and perform a hypothesis test. The following sample information is available: Assuming that the null hypothesis will be tested using an alpha level equal to 0.05, what is the value of the test statistic?
A) z = 1.578
B) t = 1.7011
C) t = 0.2388
D) t = 0.3944
Assuming that the null hypothesis will be tested using an alpha level equal to 0.05, what is the value of the test statistic?A) z = 1.578
B) t = 1.7011
C) t = 0.2388
D) t = 0.3944
Unlock Deck
Unlock for access to all 121 flashcards in this deck.
Unlock Deck
k this deck
68
Most companies that make golf balls and golf clubs use a one-armed robot named "Iron Byron" to test their balls for length and accuracy, but because of swing variations by real golfers, these test robots don't always indicate how the clubs will perform in actual use. One company in the golfing industry is interested in testing its new driver to see if it has greater length off the tee than the best-selling driver. To do this, it has selected a group of golfers of differing abilities and ages. Its plan is to have each player use each of the two clubs and hit five balls. It will record the average length of the drives with each club for each player. The resulting data for a sample of 10 players are: What is an appropriate null hypothesis to be tested?
A) H0 : μ1 = μ2
B) H0 : μ1 ≥ μ2
C) H0 : μd ≤ 0
D) H0 : μD = 0
What is an appropriate null hypothesis to be tested?A) H0 : μ1 = μ2
B) H0 : μ1 ≥ μ2
C) H0 : μd ≤ 0
D) H0 : μD = 0
Unlock Deck
Unlock for access to all 121 flashcards in this deck.
Unlock Deck
k this deck
69
In testing for differences between the means of two paired populations, an appropriate null hypothesis would be:
A) H0 : μD = 2
B) H0 : μD = 0
C) H0 : μD < 0
D) H0 : μD > 0
A) H0 : μD = 2
B) H0 : μD = 0
C) H0 : μD < 0
D) H0 : μD > 0
Unlock Deck
Unlock for access to all 121 flashcards in this deck.
Unlock Deck
k this deck
70
There have been complaints recently from homeowners in the north end claiming that their homes have been assessed at values that are too high compare with other parts of town. They say that the mean increase from last year to this year has been higher in their part of town than elsewhere. To test this, the assessor's office staff plans to select a random sample of north end properties (group 1) and a random sample of properties from other areas within the city (group 2) and perform a hypothesis test. The following sample information is available: Assuming that the null hypothesis will be tested using an alpha level equal to 0.05, what is the critical value?
A) z = 1.578
B) t = 1.7011
C) t = 0.2388
D) t = 2.0484
Assuming that the null hypothesis will be tested using an alpha level equal to 0.05, what is the critical value?A) z = 1.578
B) t = 1.7011
C) t = 0.2388
D) t = 2.0484
Unlock Deck
Unlock for access to all 121 flashcards in this deck.
Unlock Deck
k this deck
71
The t-test for the mean difference between 2 related populations assumes that the respective:
A) sample sizes are equal.
B) sample variances are equal.
C) populations are approximately normal or sample sizes are large.
D) All of the above
A) sample sizes are equal.
B) sample variances are equal.
C) populations are approximately normal or sample sizes are large.
D) All of the above
Unlock Deck
Unlock for access to all 121 flashcards in this deck.
Unlock Deck
k this deck
72
To increase productivity, workers went through a training program. The management wanted to know the effectiveness of the program. A sample of seven workers was taken and their daily production rates before and after the training are shown below. Based on the data, the training program is:
A) effective.
B) ineffective.
C) neither effective nor ineffective.
D) None of the above
Based on the data, the training program is:A) effective.
B) ineffective.
C) neither effective nor ineffective.
D) None of the above
Unlock Deck
Unlock for access to all 121 flashcards in this deck.
Unlock Deck
k this deck
73
Assume that 20 people participated in a speed reading class for 6 months. Each person's speed of reading words per minute both before and after the program is determined and recorded. The following summarizes the results for the 20 people: Mean weight lost = 9 pounds Sample standard deviation of weight lost = 4.6 pounds Assume that the hypothesis test will be conducted to determine whether or not the weight loss program is effective using a 0.05 level of significance. What is the value of the test statistic?
A) t = 18.634
B) t = 1.96
C) z = 1.96
D) z = 6.19
A) t = 18.634
B) t = 1.96
C) z = 1.96
D) z = 6.19
Unlock Deck
Unlock for access to all 121 flashcards in this deck.
Unlock Deck
k this deck
74
The U.S. Golf Association provides a number of services for its members. One of these is the evaluation of golf equipment to make sure that the equipment satisfies the rules of golf. For example, they regularly test the golf balls made by the various companies that sell balls in the United States. Recently they undertook a study of two brands of golf balls with the objective to see whether there is a difference in the mean distance that the two golf ball brands will fly off the tee. To conduct the test, the U.S.G.A. uses a robot named "Iron Byron," which swings the club at the same speed and with the same swing pattern each time it is used. The following data reflect sample data for a random sample of balls of each brand. Given this information, what is the test statistic for testing whether the two population means are equal?
A) t = 1.115
B) t = 1.96
C) t = -4.04
D) t = -2.58
Given this information, what is the test statistic for testing whether the two population means are equal?A) t = 1.115
B) t = 1.96
C) t = -4.04
D) t = -2.58
Unlock Deck
Unlock for access to all 121 flashcards in this deck.
Unlock Deck
k this deck
75
Assume that you are testing the difference in the means of two independent populations at the 0.05 level of significance. The null hypothesis is: H0 : μA - μβ ≥ 0 and you have found the test statistic is What should you conclude?
A) The mean of pop. A is greater than the mean of pop. B because p-value < α.
B) The mean of pop. A is greater than the mean of pop. B because p-value > α.
C) There is no significant difference in the two means because p-value > α.
D) The mean of pop. B is greater than the mean of pop. A because p-value < α.
Unlock Deck
Unlock for access to all 121 flashcards in this deck.
Unlock Deck
k this deck
76
An advertising company has developed a new ad for one of the national car manufacturing companies. The ad agency is interested in testing whether the proportion of favorable response to the ad is the same between male adults versus female adults. It plans on conducting the test using an alpha level equal to 0.05. A sample of 100 adults of each gender will be used in the study. Each person will be asked to view the ad and indicate whether they find the ad to be "pleasing" or not. Given this information, what is the critical value?
A) z = 1.645
B) t = 1.96
C) z = 1.96
D) Can't be determined without knowing the results of the sample.
A) z = 1.645
B) t = 1.96
C) z = 1.96
D) Can't be determined without knowing the results of the sample.
Unlock Deck
Unlock for access to all 121 flashcards in this deck.
Unlock Deck
k this deck
77
A hypothesis test for the difference between two means is considered a two-tailed test when:
A) the population variances are equal.
B) the null hypothesis states that the population means are equal.
C) the alpha level is 0.10 or higher.
D) the standard deviations are unknown.
A) the population variances are equal.
B) the null hypothesis states that the population means are equal.
C) the alpha level is 0.10 or higher.
D) the standard deviations are unknown.
Unlock Deck
Unlock for access to all 121 flashcards in this deck.
Unlock Deck
k this deck
78
Most companies that make golf balls and golf clubs use a one-armed robot named "Iron Byron" to test their balls for length and accuracy, but because of swing variations by real golfers, these test robots don't always indicate how the clubs will perform in actual use. One company in the golfing industry is interested in testing its new driver to see how it compares with the best-selling driver. To do this, it has selected a group of golfers of differing abilities and ages. Its plan is to have each player use each of the two clubs and hit five balls. It will record the average length of the drives with each club for each player. Given this description of the planned test, which of the following statements is true?
A) The test won't be meaningful if only five balls are hit by each player with each club.
B) The samples in this case are called paired samples since the same players are hitting both golf clubs.
C) The test will be invalid unless different players are used to hit each club so that the samples will be independent.
D) The samples are independent because each player is independent of the other players.
Unlock Deck
Unlock for access to all 121 flashcards in this deck.
Unlock Deck
k this deck
79
An advertising company has developed a new ad for one of the national car manufacturing companies. The ad agency is interested in testing whether the proportion of favorable responses to the ad is the same between male adults versus female adults. It plans on conducting the test using an alpha level equal to 0.05. A sample of 100 adults of each gender will be used in the study. Each person will be asked to view the ad and indicate whether they find the ad to be "pleasing" or not. Given this, what is the appropriate null hypothesis?
A) H0 : μ1 = μ2
B) H0 : p1 ≠ p2
C) H0 : 1 = 2
D) H0 : p1 = p2
A) H0 : μ1 = μ2
B) H0 : p1 ≠ p2
C) H0 : 1 = 2
D) H0 : p1 = p2
Unlock Deck
Unlock for access to all 121 flashcards in this deck.
Unlock Deck
k this deck
80
There have been complaints recently from homeowners in the north end claiming that their homes have been assessed at values that are too high compared with other parts of town. They say that the mean increase from last year to this year has been higher in their part of town than elsewhere. To test this, the assessor's office staff plans to select a random sample of north end properties (group 1) and a random sample of properties from other areas within the city (group 2) and perform a hypothesis test. Based on the information provided, the research (or alternate) hypothesis is:
A)
B)
C)
D)
A)
B)
C)
D)
Unlock Deck
Unlock for access to all 121 flashcards in this deck.
Unlock Deck
k this deck
Unlock Deck
Unlock for access to all 121 flashcards in this deck.


